Rift Valley fever risk map model and seroprevalence in selected wild ungulates and camels from Kenya
- PMID: 23840512
- PMCID: PMC3695998
- DOI: 10.1371/journal.pone.0066626
Rift Valley fever risk map model and seroprevalence in selected wild ungulates and camels from Kenya
Abstract
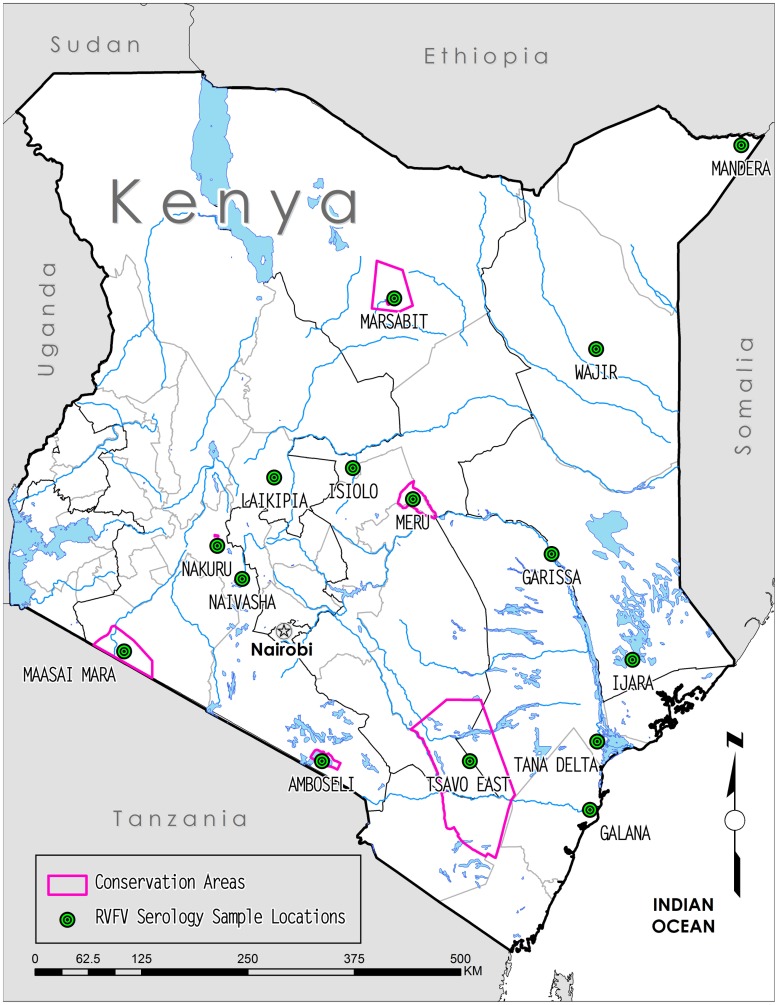
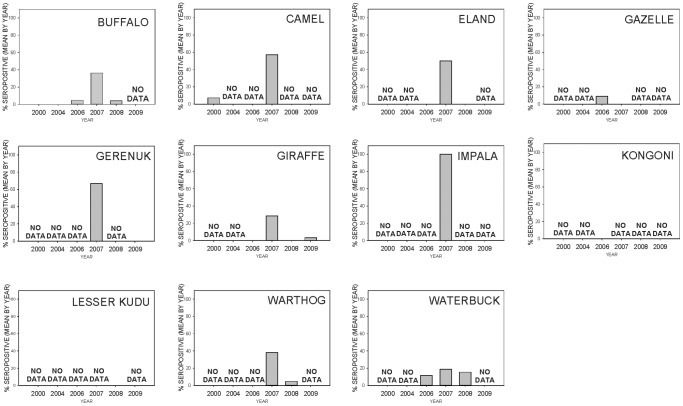
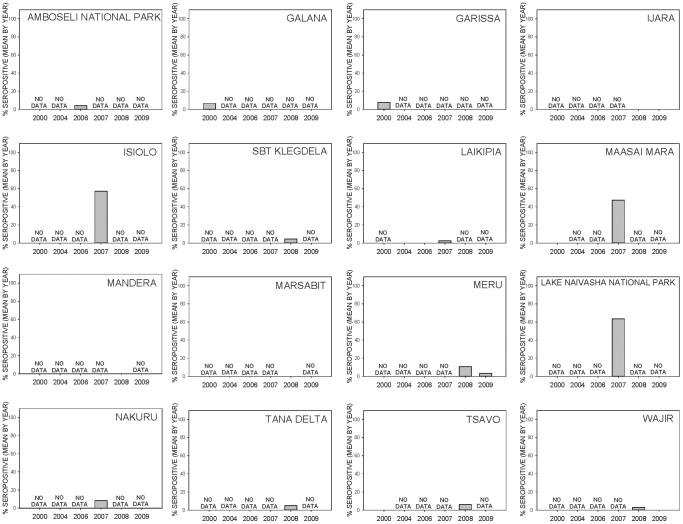
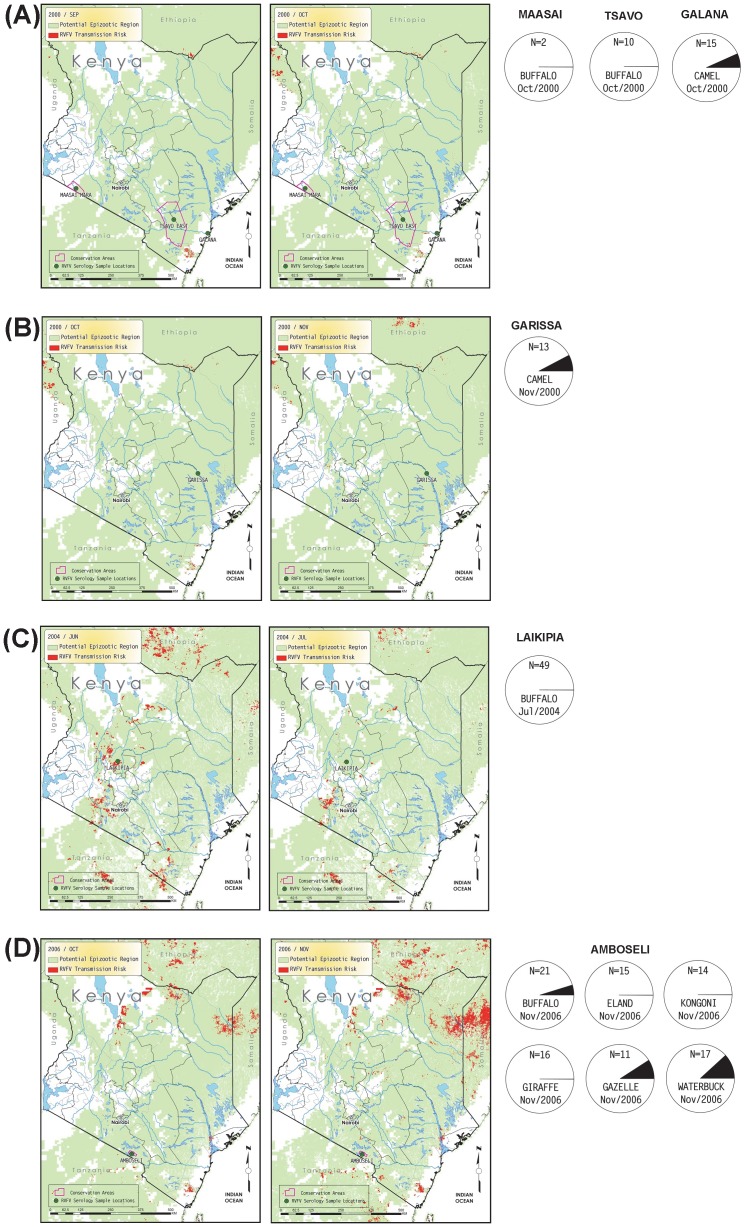
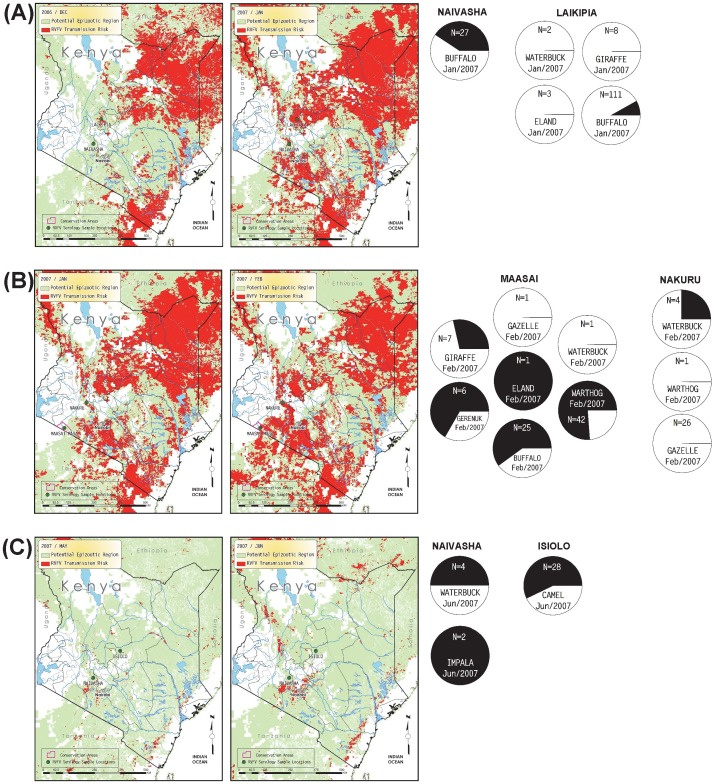
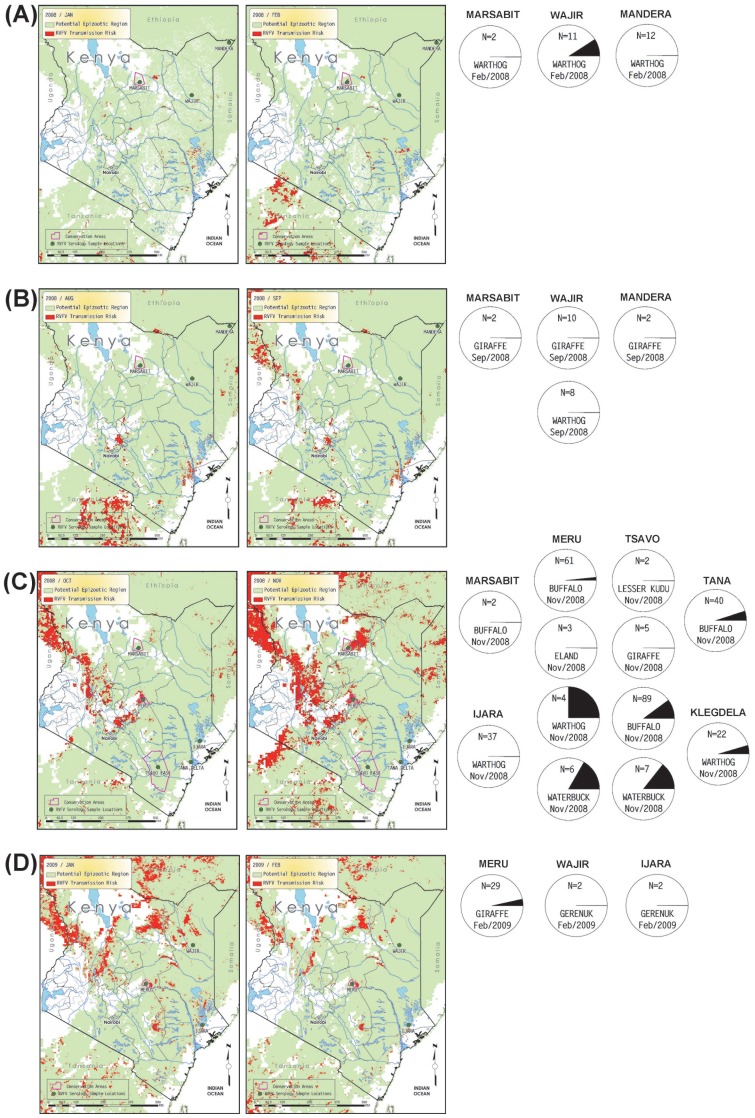
Since the first isolation of Rift Valley fever virus (RVFV) in the 1930s, there have been multiple epizootics and epidemics in animals and humans in sub-Saharan Africa. Prospective climate-based models have recently been developed that flag areas at risk of RVFV transmission in endemic regions based on key environmental indicators that precede Rift Valley fever (RVF) epizootics and epidemics. Although the timing and locations of human case data from the 2006-2007 RVF outbreak in Kenya have been compared to risk zones flagged by the model, seroprevalence of RVF antibodies in wildlife has not yet been analyzed in light of temporal and spatial predictions of RVF activity. Primarily wild ungulate serum samples from periods before, during, and after the 2006-2007 RVF epizootic were analyzed for the presence of RVFV IgM and/or IgG antibody. Results show an increase in RVF seropositivity from samples collected in 2007 (31.8%), compared to antibody prevalence observed from 2000-2006 (3.3%). After the epizootic, average RVF seropositivity diminished to 5% in samples collected from 2008-2009. Overlaying maps of modeled RVF risk assessments with sampling locations indicated positive RVF serology in several species of wild ungulate in or near areas flagged as being at risk for RVF. Our results establish the need to continue and expand sero-surveillance of wildlife species Kenya and elsewhere in the Horn of Africa to further calibrate and improve the RVF risk model, and better understand the dynamics of RVFV transmission.
Conflict of interest statement
Figures
References
-
- Ellis DS, Simpson DI, Stamford S, Abdel Wahab KS (1979) Rift Valley fever virus: some ultrastructural observations on material from the outbreak in Egypt 1977. J Gen Virol 42: 329–337. - PubMed
-
- Ellis DS, Shirodaria PV, Fleming E, Simpson DI (1988) Morphology and development of Rift Valley fever virus in Vero cell cultures. J Med Virol 24: 161–174. - PubMed
-
- Turell MJ, Wilson WC, Bennett KE (2010) Potential for North American mosquitoes (Diptera: Culicidae) to transmit Rift Valley fever virus. J Med Entomol 47: 884–889. - PubMed
-
- Collett MS (1986) Messenger RNA of the M segment RNA of Rift Valley fever virus. Virology 151: 151–156. - PubMed
-
- Giorgi C, Accardi L, Nicoletti L, Gro MC, Takehara K, et al. (1991) Sequences and coding strategies of the S RNAs of Toscana and Rift Valley fever viruses compared to those of Punta Toro, Sicilian sandfly fever, and Uukuniemi viruses. Virology 180: 738–753. - PubMed
Publication types
MeSH terms
Substances
LinkOut - more resources
Full Text Sources
Other Literature Sources