This site needs JavaScript to work properly. Please enable it to take advantage of the complete set of features!
Skip to main page content
U.S. flag

An official website of the United States government

Dot gov

The .gov means it’s official.
Federal government websites often end in .gov or .mil. Before sharing sensitive information, make sure you’re on a federal government site.

Https

The site is secure.
The https:// ensures that you are connecting to the official website and that any information you provide is encrypted and transmitted securely.

NIH NLM Logo
Log in
Access keys NCBI Homepage MyNCBI Homepage Main Content Main Navigation
. 2013 Jul;30(7):1675-86.
doi: 10.1093/molbev/mst062. Epub 2013 Apr 4.

The branch-site test of positive selection is surprisingly robust but lacks power under synonymous substitution saturation and variation in GC

Affiliations

The branch-site test of positive selection is surprisingly robust but lacks power under synonymous substitution saturation and variation in GC

Walid H Gharib et al. Mol Biol Evol. 2013 Jul.

Abstract

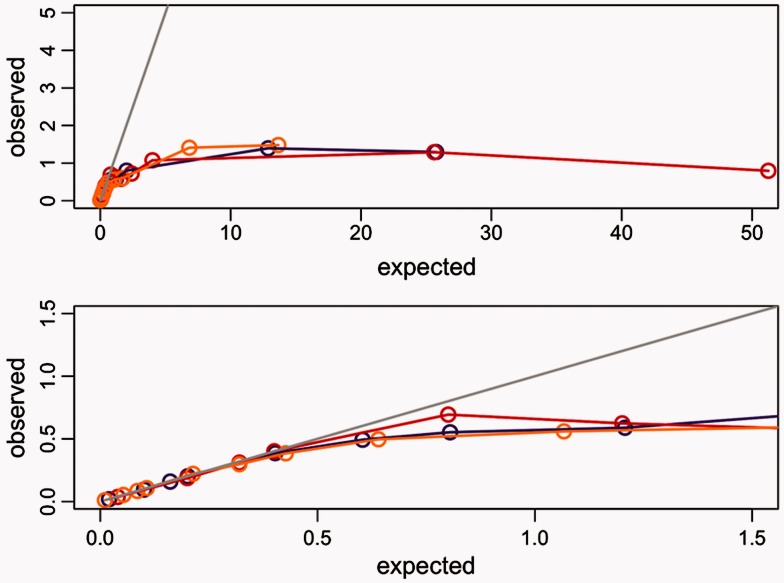
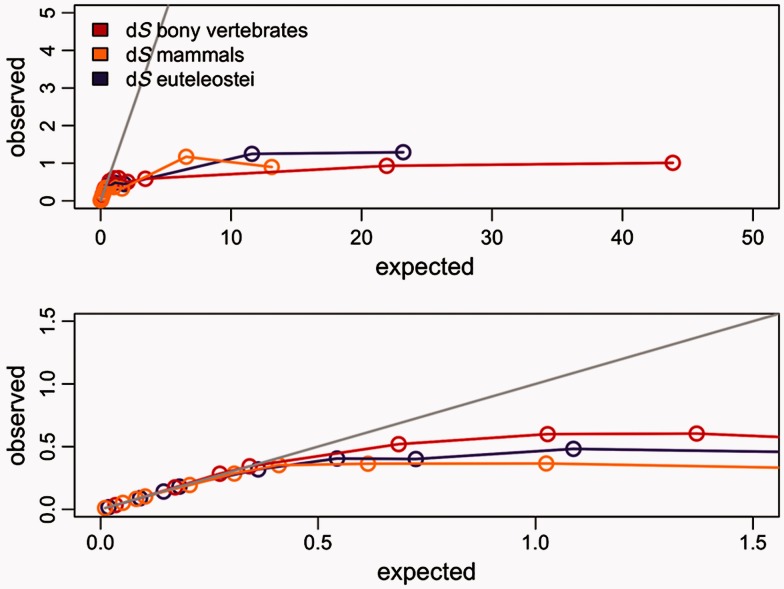
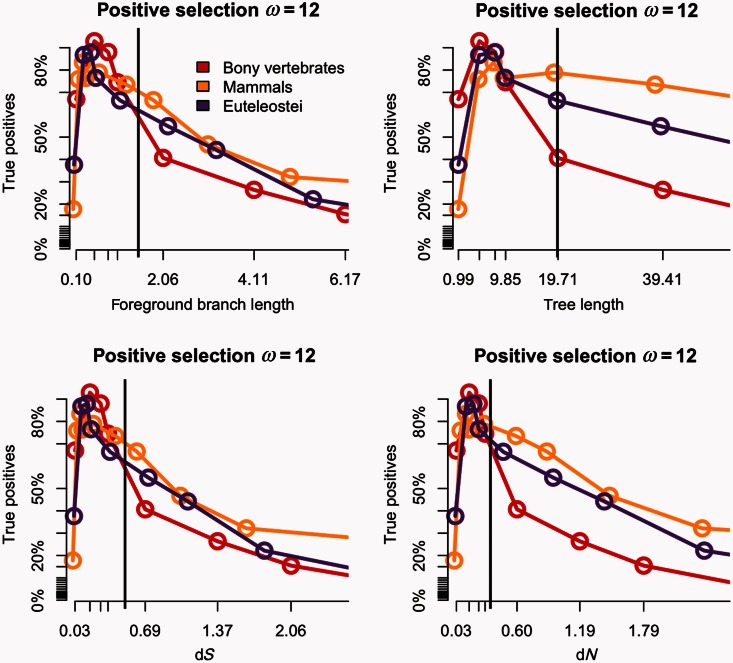
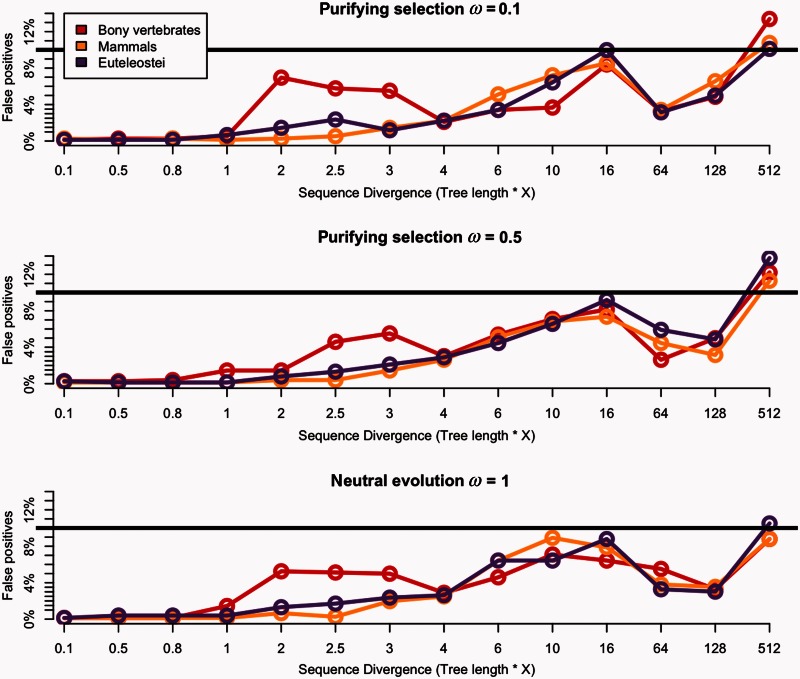
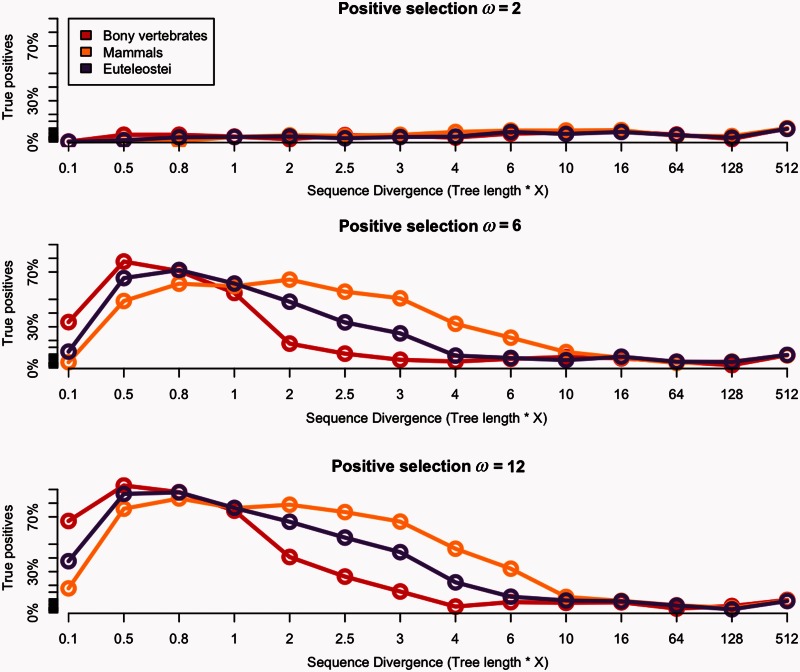
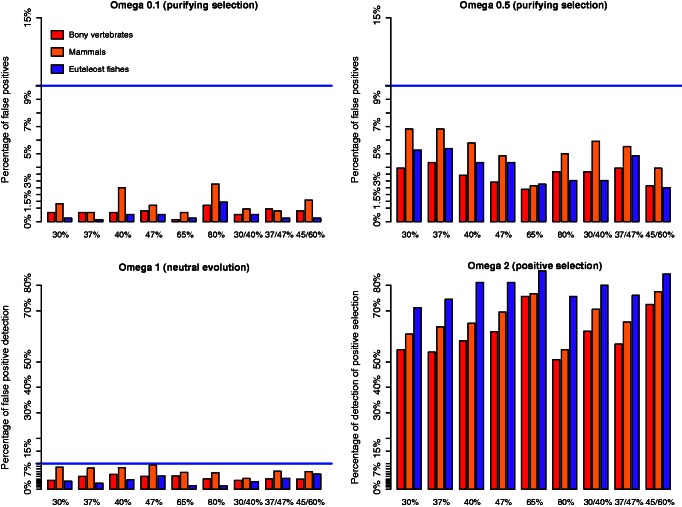
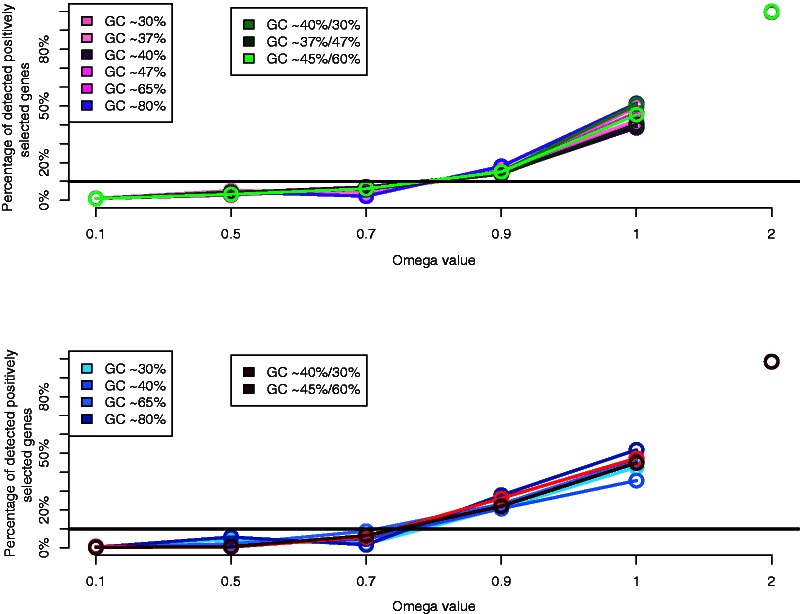
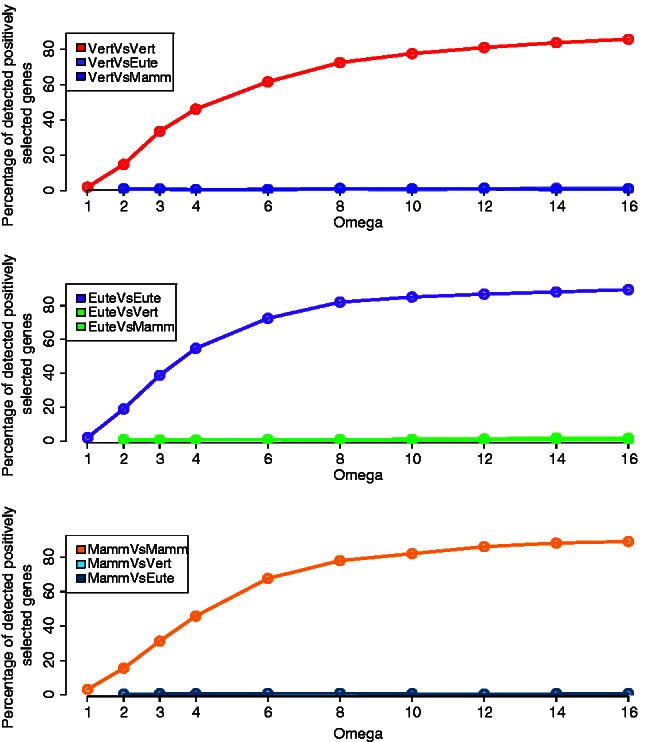
Positive selection is widely estimated from protein coding sequence alignments by the nonsynonymous-to-synonymous ratio ω. Increasingly elaborate codon models are used in a likelihood framework for this estimation. Although there is widespread concern about the robustness of the estimation of the ω ratio, more efforts are needed to estimate this robustness, especially in the context of complex models. Here, we focused on the branch-site codon model. We investigated its robustness on a large set of simulated data. First, we investigated the impact of sequence divergence. We found evidence of underestimation of the synonymous substitution rate for values as small as 0.5, with a slight increase in false positives for the branch-site test. When dS increases further, underestimation of dS is worse, but false positives decrease. Interestingly, the detection of true positives follows a similar distribution, with a maximum for intermediary values of dS. Thus, high dS is more of a concern for a loss of power (false negatives) than for false positives of the test. Second, we investigated the impact of GC content. We showed that there is no significant difference of false positives between high GC (up to ∼80%) and low GC (∼30%) genes. Moreover, neither shifts of GC content on a specific branch nor major shifts in GC along the gene sequence generate many false positives. Our results confirm that the branch-site is a very conservative test.

Keywords: adaptive evolution; base composition; codon model.


Figures

F<sc>ig</sc>. 1.
Fig. 1.
Saturation of the dS with purifying selection (ω = 0.1). The x axis shows the median dS values expected against y axis for the median dS values observed using the branch-site model. The bony vertebrates branch "α" is shown in red, the mammalian branch "β" in yellow, and the euteleostei branch "γ" in purple. Each dot corresponds to each divergence test conducted multiplying the initial tree length by 0.1 up to 512. The gray line shows the expected values. Both plots are same, whereas the lower figure is the zoomed version for more accuracy.
F<sc>ig</sc>. 2.
Fig. 2.
Saturation of the dS with positive selection (ω = 12). The x axis shows the median dS values expected against y axis for the median dS values observed using the branch-site model. The bony vertebrates branch "α" is shown in red, the mammalian branch "β" in yellow, and the euteleostei branch "γ" in purple. Each dot corresponds to each divergence test conducted multiplying the initial tree length by 0.1 up to 512. The gray line shows the expected values. Both plots are the same, whereas the lower figure is the zoomed version for more accuracy.
F<sc>ig</sc>. 3.
Fig. 3.
Power of the branch-site model against sequence divergence under positive selection ω = 12. Various expected parameters values against the power (percent of true positives). The bony vertebrates branch "α" is shown in red, the mammalian branch "β" in yellow, and the euteleostei branch "γ" in purple. Each dot corresponds to each divergence test conducted multiplying the initial tree length with 10% FDR correction. The vertical black lines correspond to the branches with dS of 0.5.
F<sc>ig</sc>. 4.
Fig. 4.
Power of the branch-site model against sequence divergence under purifying selection and neutral evolution. The x axis shows the ratio multiplication of the tree length, and the y axis shows percentage of false positives detection under ω = 0.1, ω = 0.5, and ω = 1, respectively, from upper to lower part of the figure. The bony vertebrates branch "α" is shown in red, the mammalian branch "β" in yellow, and the euteleostei branch "γ" in purple. Each dot corresponds to each divergence test conducted multiplying the initial tree length by 0.1 up to 512 shown on the x axis. The black line shows threshold of 10% FDR correction.
F<sc>ig</sc>. 5.
Fig. 5.
Power of the branch-site model against sequence divergence under positive selection. The x axis shows the ratio multiplication of the tree length, and the y axis shows percentage of true positives detection under ω = 2, ω = 6, and ω = 12, respectively, from upper to lower part of the figure. The bony vertebrates branch "α" is shown in red, the mammalian branch "β" in yellow, and the euteleostei branch "γ" in purple. Each dot corresponds to each divergence test conducted multiplying the initial tree length by 0.1 up to 512 shown on the x axis. The black line shows threshold of 10% FDR correction.
F<sc>ig</sc>. 6.
Fig. 6.
Power of the branch-site model under different GC content and GC shifts. From left to right, graphs show the rate of false positives under purifying selection and neutral evolution (lower left). The graph on the right down corner shows the rate of true positives. The bony vertebrates branch "α" is shown in red, the mammalian branch "β" in yellow, and the euteleostei branch "γ" in purple.
F<sc>ig</sc>. 7.
Fig. 7.
GC variation effect on the branch-site model. Power of the site model (M2a vs. M1a) and (M7 vs. M8a) under various GC content and GC shifts. Linked dots are rates of false positives, whereas single dots are true positives.
F<sc>ig</sc>. 8.
Fig. 8.
Effect of positive selection on nearby branches. (a) The red line (VertVsVert) shows the detection of positive selection on the vertebrates branch "α" as foreground branch, when positive selection is simulated on the same branch "α." The light (VertVsEute) and dark (VertVsMamm) purple lines show the detection of positive selection on the euteleostei branch "γ" and the mammalian branch "β," respectively, for these same data with positive selection simulated on branch "α". (b and c) These are similar figures but with the positive selection fixed to the mammalian branch "β" or the euteleostei branch "γ," respectively. The foreground branches were always set to the three branches "α," "β," and "γ".
F<sc>ig</sc>. 9.
Fig. 9.
Schematic tree of the data set showing the foreground branches tested. The bony vertebrates branch "α" is shown in red, the mammalian branch "β" in yellow, and euteleostei branch "γ" in purple.

References

    1. Anisimova M, Bielawski JP, Yang Z. Accuracy and power of the likelihood ratio test in detecting adaptive molecular evolution. Mol Biol Evol. 2001;18:1585–1592. - PubMed
    1. Anisimova M, Bielawski JP, Yang Z. Accuracy and power of bayes prediction of amino acid sites under positive selection. Mol Biol Evol. 2002;19:950–958. - PubMed
    1. Anisimova M, Kosiol C. Investigating protein-coding sequence evolution with probabilistic codon substitution models. Mol Biol Evol. 2009;26:255–271. - PubMed
    1. Anisimova M, Nielsen R, Yang Z. Effect of recombination on the accuracy of the likelihood method for detecting positive selection at amino acid sites. Genetics. 2003;164:1229–1236. - PMC - PubMed
    1. Anisimova M, Yang Z. Multiple hypothesis testing to detect lineages under positive selection that affects only a few sites. Mol Biol Evol. 2007;24:1219–1228. - PubMed

Publication types

Cite

AltStyle によって変換されたページ (->オリジナル) /