This site needs JavaScript to work properly. Please enable it to take advantage of the complete set of features!
Skip to main page content
U.S. flag

An official website of the United States government

Dot gov

The .gov means it’s official.
Federal government websites often end in .gov or .mil. Before sharing sensitive information, make sure you’re on a federal government site.

Https

The site is secure.
The https:// ensures that you are connecting to the official website and that any information you provide is encrypted and transmitted securely.

NIH NLM Logo
Log in
Access keys NCBI Homepage MyNCBI Homepage Main Content Main Navigation
doi: 10.1371/journal.pone.0058177. Epub 2013 Mar 5.

Methods for applying accurate digital PCR analysis on low copy DNA samples

Affiliations

Methods for applying accurate digital PCR analysis on low copy DNA samples

Alexandra S Whale et al. PLoS One. 2013.

Abstract

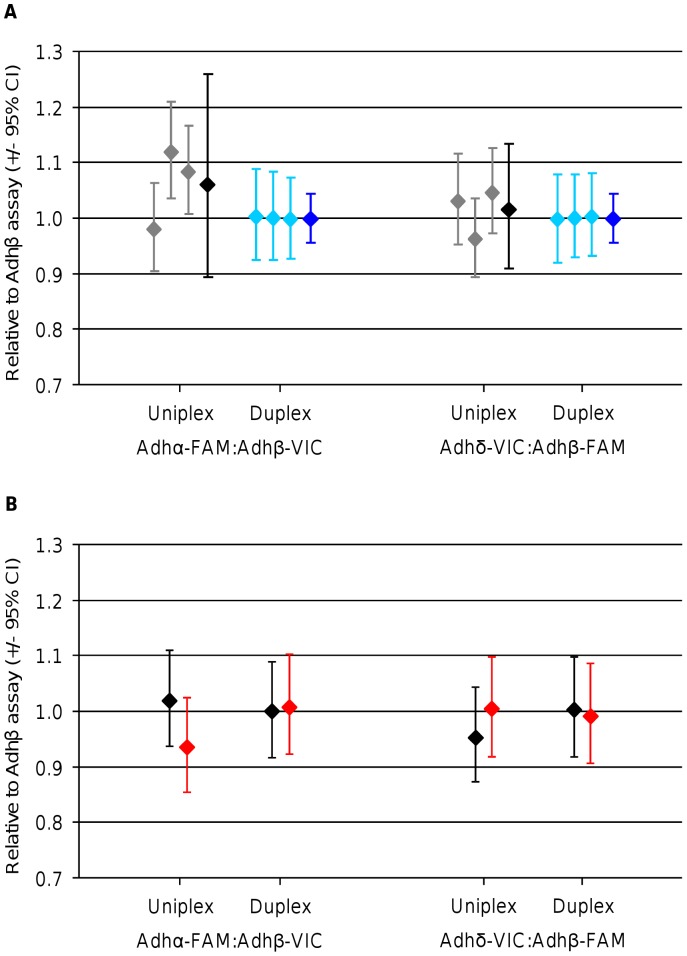
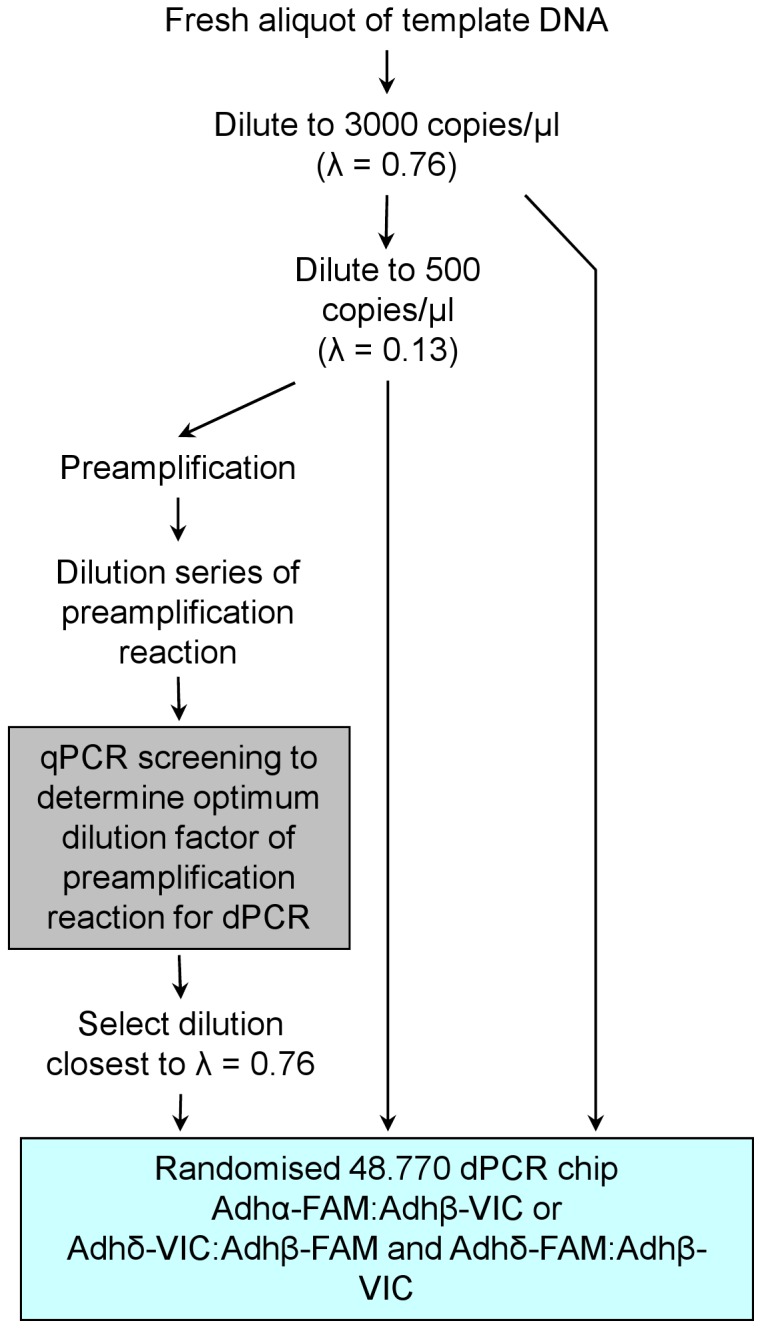
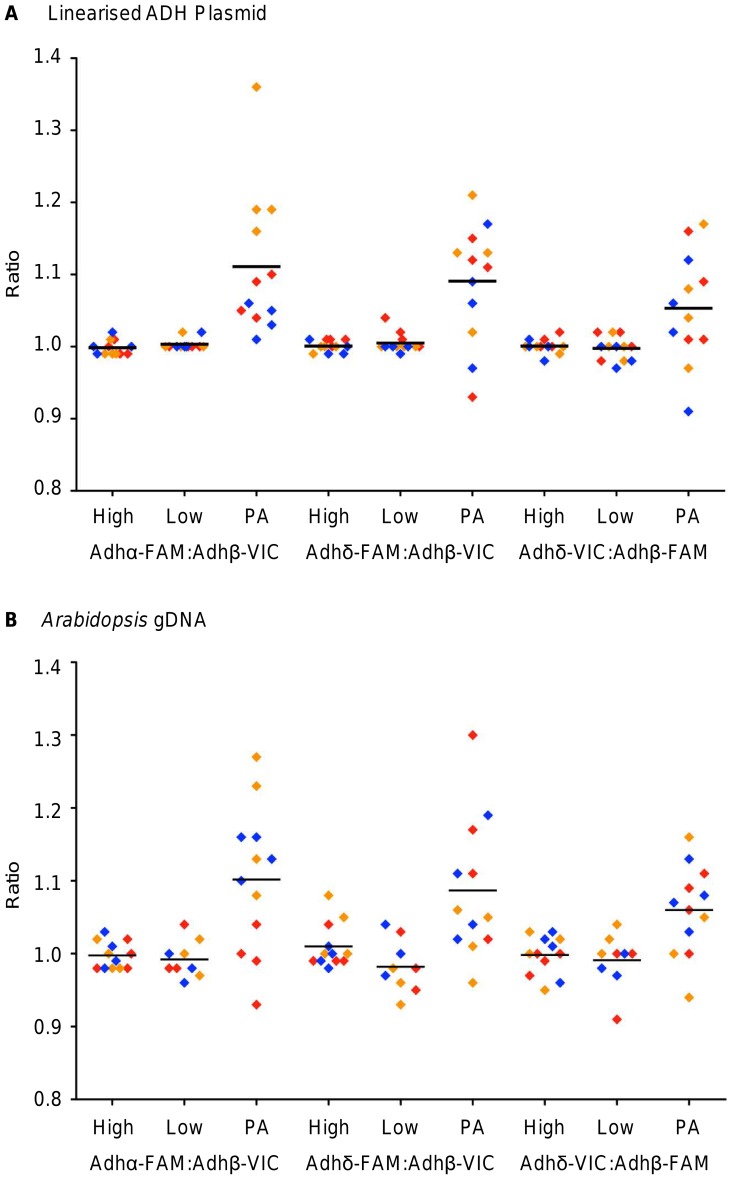
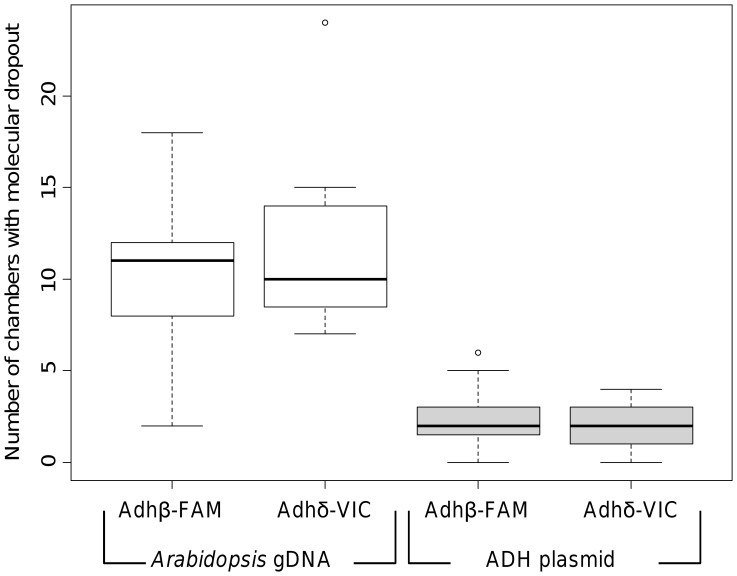
Digital PCR (dPCR) is a highly accurate molecular approach, capable of precise measurements, offering a number of unique opportunities. However, in its current format dPCR can be limited by the amount of sample that can be analysed and consequently additional considerations such as performing multiplex reactions or pre-amplification can be considered. This study investigated the impact of duplexing and pre-amplification on dPCR analysis by using three different assays targeting a model template (a portion of the Arabidopsis thaliana alcohol dehydrogenase gene). We also investigated the impact of different template types (linearised plasmid clone and more complex genomic DNA) on measurement precision using dPCR. We were able to demonstrate that duplex dPCR can provide a more precise measurement than uniplex dPCR, while applying pre-amplification or varying template type can significantly decrease the precision of dPCR. Furthermore, we also demonstrate that the pre-amplification step can introduce measurement bias that is not consistent between experiments for a sample or assay and so could not be compensated for during the analysis of this data set. We also describe a model for estimating the prevalence of molecular dropout and identify this as a source of dPCR imprecision. Our data have demonstrated that the precision afforded by dPCR at low sample concentration can exceed that of the same template post pre-amplification thereby negating the need for this additional step. Our findings also highlight the technical differences between different templates types containing the same sequence that must be considered if plasmid DNA is to be used to assess or control for more complex templates like genomic DNA.


Conflict of interest statement

Competing Interests: The authors are all employees at LGC and have no financial or non-financial competing interests in the work performed. This does not alter the authors' adherence to all the PLOS ONE policies on sharing data and materials.

Figures

Figure 1
Figure 1. Comparison of uniplex and duplex reactions by digital PCR.
(A) Graph showing the ratios calculated for the three experiments using either uniplex (grey data points) or duplex (light blue data points) reactions on the linearised ADH plasmid for two Adh ratios: Adhα-FAM:Adhβ-VIC and Adhδ-VIC:Adhβ-FAM. Each data point and its associated 95% CIs were calculated from triplicate panels on a single 12.765 dPCR array (panel-to-panel variation). The expanded uncertainty was calculated from the three experiments for each ratio using uniplex (black data points) and duplex (dark blue data points) reactions. For the uniplex reactions, the standard error of the mean for the three experiments was used to calculate the 95% CIs as the between experiment variance exceeds that of the within experiment variance. For the duplex reactions, the 95% CIs were calculated from the mean variance across the three experiments as the between and within experiment variance was very small. (B) Graph showing the ratios calculated for either linearised ADH plasmid (black diamonds) or gDNA (red diamonds) using either uniplex or duplex reactions for two Adh ratios: Adhα-FAM:Adhβ-VIC and Adhδ-VIC:Adhβ-FAM. 95% CIs were calculated from triplicate panels from a single 48.770 dPCR array. The absolute counts used to generate this figure are found in Table S3.
Figure 2
Figure 2. Workflow of pre-amplification experiments.
A fresh aliquot of template DNA (linearised ADH plasmid or Arabidopsis gDNA) was diluted in carrier to a ‘high’ concentration (3000 copies/μl to give λ = 0.76) and a ‘low’ concentration (500 copies/μl to give λ = 0.13). The ‘low’ concentration was used as the template in the pre-amplification reaction. The pre-amplification reaction was serially diluted in ×ばつ TE (pH 8.0) and using qPCR, the dilution to give an approximately λ = 0.76 for the Adhβ target was selected. dPCR analysis using the 48.770 arrays was performed with the Adhα-FAM:Adhβ-VIC duplex assay for the ‘high’ and ‘low’ concentration non-amplified template DNA and diluted pre-amplified template DNA. This experimental workflow was repeated on three separate days. A further three experiments were performed on three separate days using the Adhδ-FAM:Adhβ-VIC and Adhδ-VIC:Adhβ-VIC duplex assays.
Figure 3
Figure 3. Assessment of the pre-amplification reaction on the A) linearised ADH plasmid or B) Arabidopsis gDNA.
For each duplex assay combination, two concentrations of non pre-amplified template (High and Low) were analysed in parallel with the pre-amplified template (PA). Each sample was analysed on quadruplicate panels, with the exception of the ‘low’ non pre-amplified Arabidopsis gDNA that was analysed on triplicate panels, and the copy number ratio between the two Adh targets was calculated for each panel (diamond data points). Three experiments were performed (red, orange and blue diamonds) with three duplex assay combinations (Adhα-FAM:Adhβ-VIC, Adhδ-FAM:Adhβ-VIC and Adhδ-VIC:Adhβ-FAM). Horizontal black bars represent the mean ratio across all three experiments. The absolute counts used to generate this figure are found in Table S4.
Figure 4
Figure 4. Assessment of molecular dropout by digital PCR.
Box and whisker plot showing the effect of using different template types: Arabidopsis gDNA (white plots) or linearised ADH plasmid (grey plots) on molecular dropout in the data from the ‘high’ concentration template using the Adhδ-VIC:Adhβ-FAM duplex assay. The vertical axis corresponds to the number of chambers per panel in which known dropout occurred, that is, one assay (labelled with FAM or VIC) did not produce a positive signal, but the other assay did. For each data set the box plot represent the inter-quartile range with the mean, the whiskers represent the 95% range. The full range of the data set is represented by a circle.

References

    1. Ceulemans S, van der Ven K, Del-Favero J (2012) Targeted screening and validation of copy number variations. Methods Mol Biol 838: 311–328. - PubMed
    1. Whale AS, Huggett JF, Cowen S, Speirs V, Shaw J, et al. (2012) Comparison of microfluidic digital PCR and conventional quantitative PCR for measuring copy number variation. Nucleic Acids Res 40: e82. - PMC - PubMed
    1. Huggett JF, Novak T, Garson JA, Green C, Morris-Jones SD, et al. (2008) Differential susceptibility of PCR reactions to inhibitors: an important and unrecognised phenomenon. BMC Res Notes 1: 70–79. - PMC - PubMed
    1. Fox BC, Devonshire AS, Baradez MO, Marshall D, Foy CA (2012) Comparison of reverse transcription-quantitative polymerase chain reaction methods and platforms for single cell gene expression analysis. Anal Biochem 427: 178–186. - PubMed
    1. Ferruelo A, El-Assar M, Lorente JA, Nin N, Penuelas O, et al. (2011) Transcriptional profiling and genotyping of degraded nucleic acids from autopsy tissue samples after prolonged formalin fixation times. Int J Clin Exp Pathol 4: 156–161. - PMC - PubMed

Publication types

Cite

AltStyle によって変換されたページ (->オリジナル) /