This site needs JavaScript to work properly. Please enable it to take advantage of the complete set of features!
Skip to main page content
U.S. flag

An official website of the United States government

Dot gov

The .gov means it’s official.
Federal government websites often end in .gov or .mil. Before sharing sensitive information, make sure you’re on a federal government site.

Https

The site is secure.
The https:// ensures that you are connecting to the official website and that any information you provide is encrypted and transmitted securely.

NIH NLM Logo
Log in
Access keys NCBI Homepage MyNCBI Homepage Main Content Main Navigation
. 2012;6(8):e1760.
doi: 10.1371/journal.pntd.0001760. Epub 2012 Aug 7.

Refining the global spatial limits of dengue virus transmission by evidence-based consensus

Affiliations

Refining the global spatial limits of dengue virus transmission by evidence-based consensus

Oliver J Brady et al. PLoS Negl Trop Dis. 2012.

Abstract

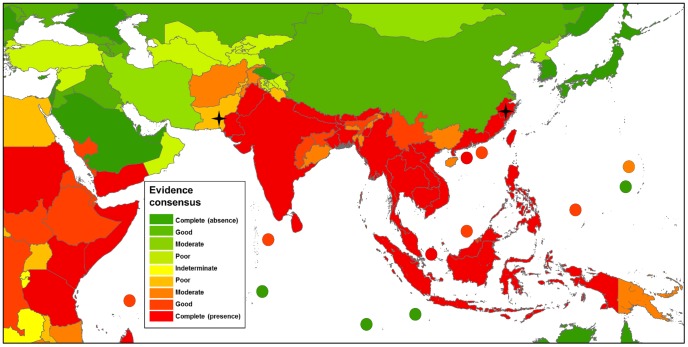
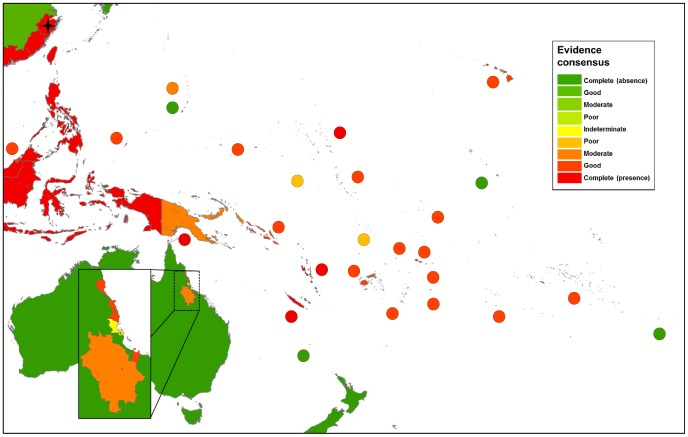
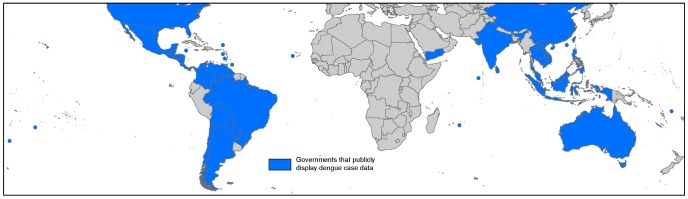
Background: Dengue is a growing problem both in its geographical spread and in its intensity, and yet current global distribution remains highly uncertain. Challenges in diagnosis and diagnostic methods as well as highly variable national health systems mean no single data source can reliably estimate the distribution of this disease. As such, there is a lack of agreement on national dengue status among international health organisations. Here we bring together all available information on dengue occurrence using a novel approach to produce an evidence consensus map of the disease range that highlights nations with an uncertain dengue status.

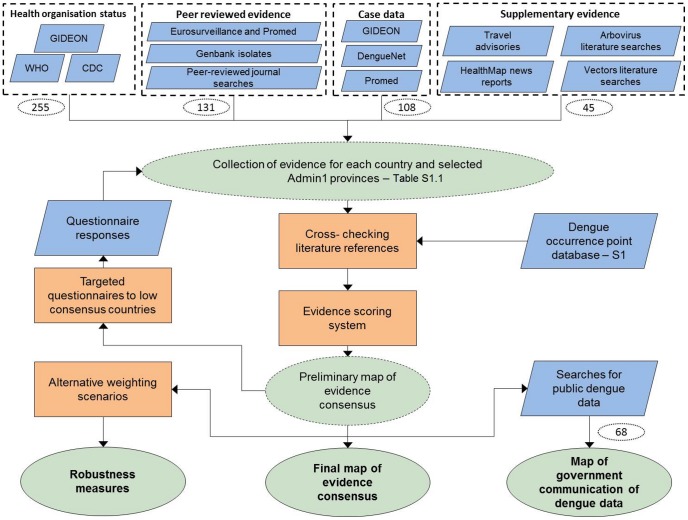
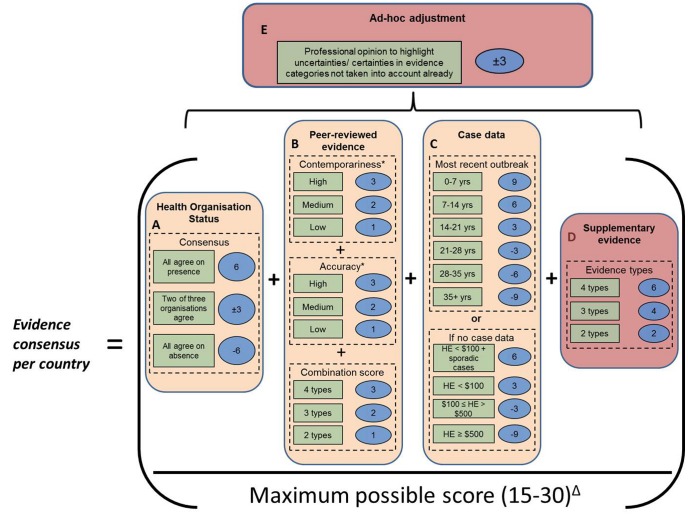
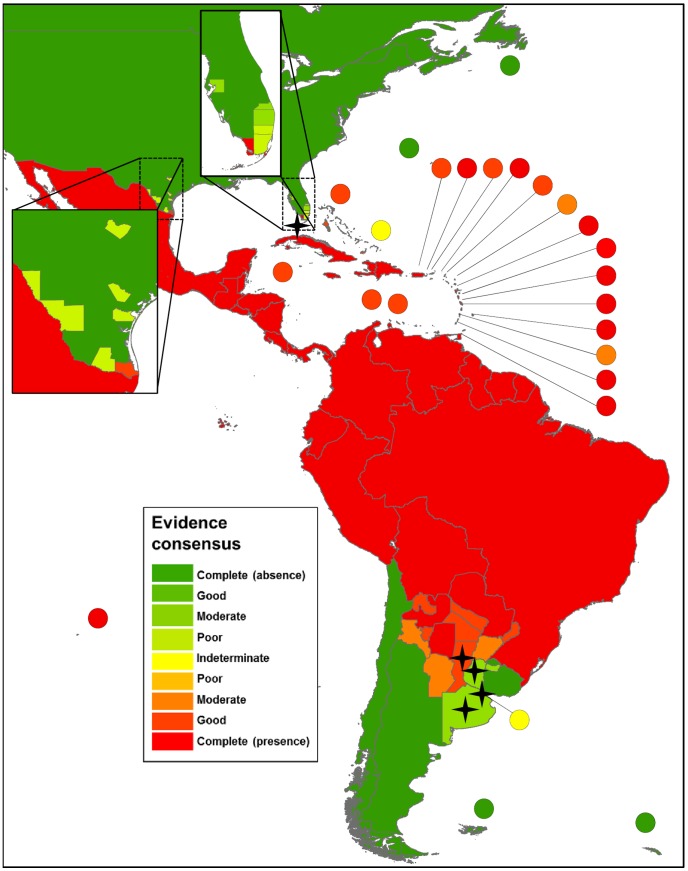
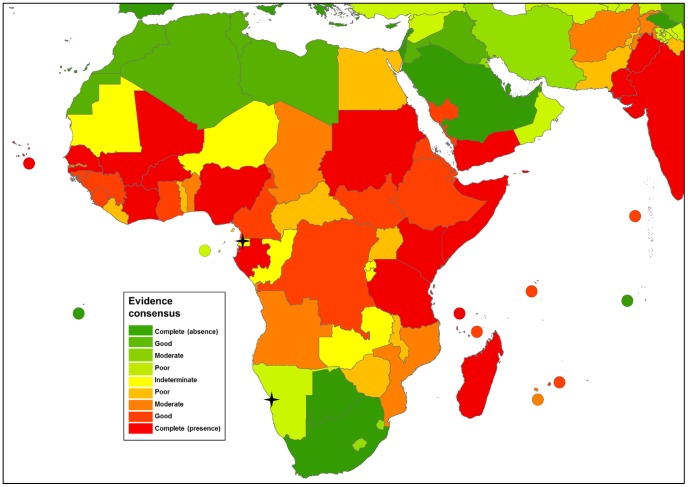
Methods/principal findings: A baseline methodology was used to assess a range of evidence for each country. In regions where dengue status was uncertain, additional evidence types were included to either clarify dengue status or confirm that it is unknown at this time. An algorithm was developed that assesses evidence quality and consistency, giving each country an evidence consensus score. Using this approach, we were able to generate a contemporary global map of national-level dengue status that assigns a relative measure of certainty and identifies gaps in the available evidence.

Conclusion: The map produced here provides a list of 128 countries for which there is good evidence of dengue occurrence, including 36 countries that have previously been classified as dengue-free by the World Health Organization and/or the US Centers for Disease Control. It also identifies disease surveillance needs, which we list in full. The disease extents and limits determined here using evidence consensus, marks the beginning of a five-year study to advance the mapping of dengue virus transmission and disease risk. Completion of this first step has allowed us to produce a preliminary estimate of population at risk with an upper bound of 3.97 billion people. This figure will be refined in future work.


Conflict of interest statement

The authors have declared that no competing interests exist.

Figures

Figure 1
Figure 1. Schematic overview of the methods.
Blue diamonds describe input data; orange boxes denote experimental procedures; green ovals indicate output data; dashed lines represent intermediate outputs and solid lines final outputs; dotted white ovals denote the number of countries for which data was available and added to the final output. Dotted rectangles identify the different evidence categories and their main data sources. S1 = Protocol S1.
Figure 2
Figure 2. Overview of the evidence scoring system.
Cream boxes represent mandatory categories while red boxes represent optional categories that are only used where required (see Methods). Dashed lines surround individual parameters that are assessed and totalled in the scoring system. Green boxes describe the level of evidence, with a given score in the blue oval. * Each individual piece of literary evidence is scored for contemporariness and accuracy before taking an average of the whole set then adding the combination score. Evidence consensus is calculated as the proportion of the maximum possible score from the dashed lined characteristics that are used. Δ Maximum possible score depends on which categories are included and can vary from 15 (Case data and Health organisation status, but no peer-reviewed evidence available) to 30 (all evidence categories included). Yrs = years. HE = total healthcare expenditure per capita at average U.S. $ exchange rates.
Figure 3
Figure 3. Evidence consensus on dengue virus presence and absence in the Americas.
Figure 3 shows the areas categorised as complete evidence consensus on dengue absence in dark green, through to areas with indeterminate evidence consensus on dengue status in yellow, then up to areas with complete evidence consensus on dengue presence in dark red. Stars indicate one off indigenous transmission events with fewer than 50 cases. The map displays evidence consensus at Admin1 (state) level for Argentina and Uruguay, Admin2 (county) level for the United States of America and Admin0 (country) level for all other countries.
Figure 4
Figure 4. Evidence consensus on dengue virus presence and absence in Africa.
Figure 4 shows the areas categorised as complete evidence consensus on dengue absence in dark green, through to areas with indeterminate evidence consensus on dengue status in yellow, then up to areas with complete evidence consensus on dengue presence in dark red. Stars indicate one off indigenous transmission events with fewer than 50 cases. The map displays evidence consensus at Admin1 (state) level for Saudi Arabia and Pakistan and Admin0 (country) level for all other countries.
Figure 5
Figure 5. Evidence consensus on dengue virus presence and absence in Asia.
Figure 5 shows the areas categorised as complete evidence consensus on dengue absence in dark green, through to areas with indeterminate evidence consensus on dengue status in yellow, then up to areas with complete evidence consensus on dengue presence in dark red. Stars indicate one off indigenous transmission events with fewer than 50 cases. The map displays evidence consensus at Admin1 (state) level for Saudi Arabia, Pakistan, India, China and South Korea and Admin0 (country) level for all other countries.
Figure 6
Figure 6. Evidence consensus on dengue virus presence and absence in Europe.
Figure 6 shows the areas categorised as complete evidence consensus on dengue absence in dark green, through to areas with indeterminate evidence consensus on dengue status in yellow. Stars indicate one off indigenous transmission events with fewer than 50 cases. The map displays evidence consensus at Admin2 (county) level for France and Croatia and Admin0 (country) level for all other countries.
Figure 7
Figure 7. Evidence consensus on dengue virus presence and absence in Australasia.
Figure 7 shows the areas categorised as complete evidence consensus on dengue absence in dark green, through to areas with indeterminate evidence consensus on dengue status in yellow, then up to areas with complete evidence consensus on dengue presence in dark red. Stars indicate one off indigenous transmission events with fewer than 50 cases. The map displays evidence consensus at Admin1 (state) level China, Admin2 (county) level for Australia and Admin0 (country) level for all other countries.
Figure 8
Figure 8. The worldwide variation in governments that publicly display dengue data.
The map shows governments that at a minimum display dengue case data at a national level yearly via their official Ministry of Health website.

References

    1. Hales S, de Wet N, Maindonald J, Woodward A (2002) Potential effect of population and climate changes on global distribution of dengue fever: an empirical model. Lancet 360: 830–834. - PubMed
    1. Beatty M, Letson W, Edgil D, Margolis H (2007) Estimating the total world population at risk for locally acquired dengue infection. Philadelphia. 170–257.
    1. WHO (2009) Dengue guidelines for diagnosis, treatment, prevention and control. In: Ciceri K, Tissot P, editors. 2009 ed. Geneva: World Health Organization. - PubMed
    1. Tapia-Conyer R, Mendez-Galvan JF, Gallardo-Rincon H (2009) The growing burden of dengue in Latin America. Journal of clinical virology : the official publication of the Pan American Society for Clinical Virology 46 Suppl 2: S3–6. - PubMed
    1. Van Kleef E, Bambrick H, Hales S (2010) The geographic distribution of dengue fever and the potential influence of global climate change. TropIKA 1–18.

Publication types

Cite

AltStyle によって変換されたページ (->オリジナル) /