This site needs JavaScript to work properly. Please enable it to take advantage of the complete set of features!
Skip to main page content
U.S. flag

An official website of the United States government

Dot gov

The .gov means it’s official.
Federal government websites often end in .gov or .mil. Before sharing sensitive information, make sure you’re on a federal government site.

Https

The site is secure.
The https:// ensures that you are connecting to the official website and that any information you provide is encrypted and transmitted securely.

NIH NLM Logo
Log in
Access keys NCBI Homepage MyNCBI Homepage Main Content Main Navigation
. 2012 Jan;6(1):e1455.
doi: 10.1371/journal.pntd.0001455. Epub 2012 Jan 10.

A systematically improved high quality genome and transcriptome of the human blood fluke Schistosoma mansoni

Affiliations

A systematically improved high quality genome and transcriptome of the human blood fluke Schistosoma mansoni

Anna V Protasio et al. PLoS Negl Trop Dis. 2012 Jan.

Abstract

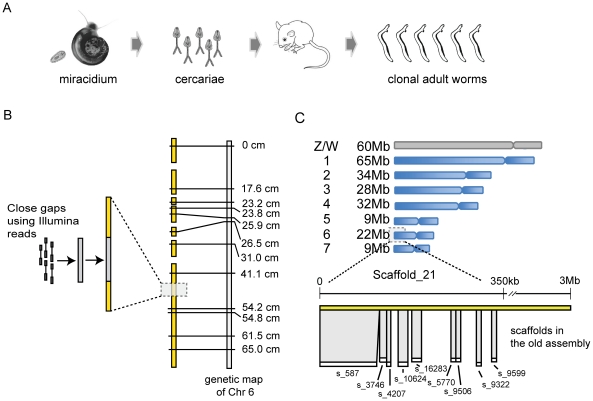
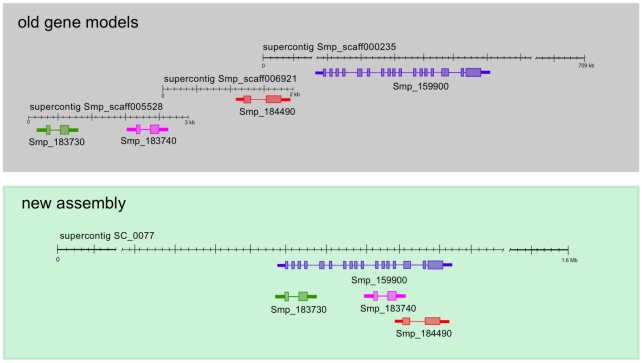
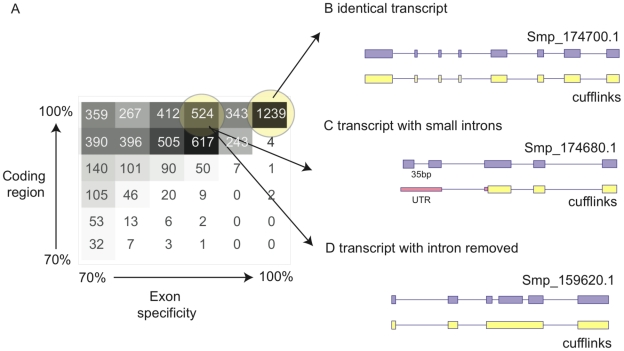
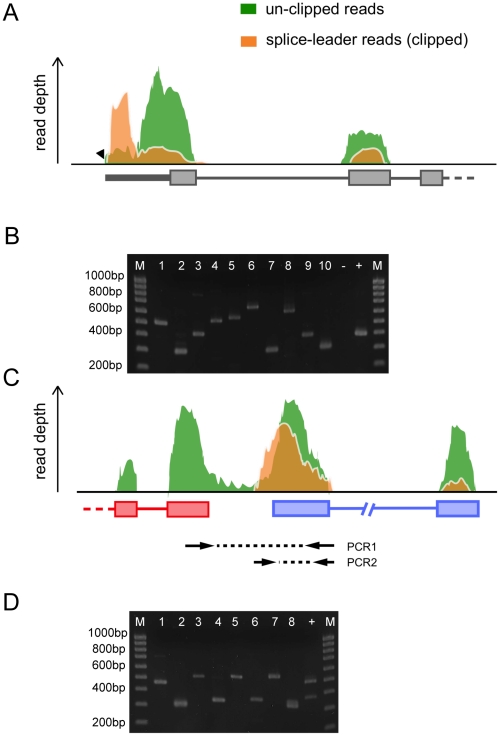
Schistosomiasis is one of the most prevalent parasitic diseases, affecting millions of people in developing countries. Amongst the human-infective species, Schistosoma mansoni is also the most commonly used in the laboratory and here we present the systematic improvement of its draft genome. We used Sanger capillary and deep-coverage Illumina sequencing from clonal worms to upgrade the highly fragmented draft 380 Mb genome to one with only 885 scaffolds and more than 81% of the bases organised into chromosomes. We have also used transcriptome sequencing (RNA-seq) from four time points in the parasite's life cycle to refine gene predictions and profile their expression. More than 45% of predicted genes have been extensively modified and the total number has been reduced from 11,807 to 10,852. Using the new version of the genome, we identified trans-splicing events occurring in at least 11% of genes and identified clear cases where it is used to resolve polycistronic transcripts. We have produced a high-resolution map of temporal changes in expression for 9,535 genes, covering an unprecedented dynamic range for this organism. All of these data have been consolidated into a searchable format within the GeneDB (www.genedb.org) and SchistoDB (www.schistodb.net) databases. With further transcriptional profiling and genome sequencing increasingly accessible, the upgraded genome will form a fundamental dataset to underpin further advances in schistosome research.


Conflict of interest statement

The authors have declared that no competing interests exist.

Figures

Figure 1
Figure 1. Improving the genome assembly of S. mansoni.
(A) Generation of clonal adult worms for Illumina sequencing. A single B. glabrata snail was infected with one miracidum only. The normal asexual reproduction stage of the sporocyst in the snail produces thousands of clonal cercariae that were used to infect mice. Clonal adult worms were recovered 7 weeks post-infection and processed for DNA extraction. (B) Closing gaps with IMAGE. Illumina data generated from the clonal adult worms were used to close gaps in the assembly using IMAGE and, in conjunction with previous sequencing data, linkage markers and BAC ends, allowed the genome to be assembled into chromosomes. (C) Organisation of the S. mansoni genome into chromosomes. Top: The total length of the scaffolds that have evidence (either linkage markers or FISH-mapped BACs) assigning them to the 7 autosomal and W/Z chromosomes. Bottom: A schematic diagram showing the example of supercontig_21 (3 Mb), which was allocated to chromosome 6 using information from genetic mapping , and was able to link together 9 supercontigs from the old assembly into the first 350 kb.
Figure 2
Figure 2. Removal of assembly redundancies produces a more reliable set of gene models.
Gene models were migrated from previous version using RATT . Repeats and sequencing errors in the old assembly resulted in ambiguities and sequences being represented more than once. In the new version, many scaffolds coalesced into one region and hence the gene models contained in them overlap each other. In this example, four supercontigs from the previous version collapsed on an unplaced region of Chromosome 3 in the new assembly. The smaller gene models are now obsolete as they were clearly incomplete annotations and their coding region are part of the exons of the larger gene model.
Figure 3
Figure 3. Improvement of gene annotation using RNA-seq.
(A) Heatmap displaying comparisons between previous gene models and transcript fragments generated from Cufflinks. For each model, the extent of coding region that overlaps with a Cufflinks' model and the proportion of correctly predicted exon boundaries was calculated and categorised into bins of 70–100%. Models in this plot were excluded with less than 70% of their exon boundaries or coding regions predicted. (B), (C) and (D) Example scenarios of Cufflinks' models compared with previous gene models where (B) the Cufflinks prediction is identical to the 1,239 existing models; (C) Cufflinks fails to identify small introns; (D) Cufflinks removes incorrect introns present in the previous gene model, probably due to the improved assembly which, by correcting gaps, produced a longer single exon while the reading frame is preserved.
Figure 4
Figure 4. RNA-seq reveals trans-spliced transcripts.
(A) Schematic view of the 5′ end of trans-spliced gene Smp_176420. Shaded coverage plots represent non-normalized RNA-seq reads still containing the spliced-leader (SL) sequence (green – unclipped reads) and reads previously found to contain the SL sequence (orange - clipped). In the latter, the SL sequence was removed prior to aligning the reads to the genome; which improved the reads mapability (lower in the unclipped reads than in the orange reads). (B) RT-PCR validation of 10 putative trans-spliced genes with SL1 as forward primer and a gene-specific reverse primer. Smp_024110.1, previously described as trans-spliced , was included as a positive control (indicated with ‘+’) while Smp_045200.1 was included as a negative control (‘−’). All PCRs but one (Smp_176590.1) show bands corresponding to expected PCR product size. (C) Schematic view of the putative polycistron Smp_079750-Smp_079760. PCR1 represents the amplicon obtained from the unprocessed polycistronic transcript containing the intergenic region while PCR2 the trans-spliced form of Smp_079760. (D) RT-PCR validation of 5 putative polycistrons and a positive control (Smp_024110-Smp_024120; lane 9) previously reported in . Each putative polycistron was subjected to two PCRs that correspond to PCR1 (e.g lane 1) and PCR2 (e.g lane 2) in panel C.
Figure 5
Figure 5. Comparison of expression of genes previously identified to be developmentally regulated.
Barplots represent relative normalized reads (from RNA-seq data) for 3 transcripts, asterisks represent comparisons where differential expression is significant (adjusted p-value<0.01). Relative expression reported in the literature , , is shown at the bottom (+++, high expression, ++ medium expression, + some expression, − not expressed, NA no information available). C = cercariae, 3S = 3-hour schistosomula, 24S = 24-hour schistosomula, A = adult.
Figure 6
Figure 6. Detection of differentially expressed genes.
The plot (left) shows the log fold change (y-axis) vs. log relative concentration (x-axis) for the cercariae – 3-hour schistosomula comparison. A total of 1,518 genes are differentially expressed between these two life cycles stages (adjusted p-value<0.01). On the right, example coverage plots for differentially and non-differentially expressed genes. Of particular interest, genes up regulated in the 3-hour schistosomula stage are enriched in G-protein coupled receptors and integrins, suggesting that signalling is a key process in this life-cycle transition.
Figure 7
Figure 7. Genes with expression above the 95 percentile different in cercariae and intra-mammalian stages.
Venn diagram represents the distribution of genes above 95 percentile of expression in 3 different life cycle stages of the parasite. Examples of the genes/processes found within these groups are discussed in the main text.

References

    1. Steinmann P, Keiser J, Bos R, Tanner M, Utzinger J. Schistosomiasis and water resources development: systematic review, meta-analysis, and estimates of people at risk. Lancet Infect Dis. 2006;6:411–425. - PubMed
    1. Cook GC, Zumla A, Manson PSTd. Manson's tropical diseases. Edinburgh: Saunders; 2003. [1812] p. of plates p. xiii, 1847.
    1. Berriman M, Haas BJ, LoVerde PT, Wilson RA, Dillon GP, et al. The genome of the blood fluke Schistosoma mansoni. Nature. 2009;460:352–358. - PMC - PubMed
    1. The Schistosoma japonicum Genome Sequencing and Functional Analysis Consortium. The Schistosoma japonicum genome reveals features of host-parasite interplay. Nature. 2009;460:345–351. - PMC - PubMed
    1. Li R, Fan W, Tian G, Zhu H, He L, et al. The sequence and de novo assembly of the giant panda genome. Nature. 2010;463:311–317. - PMC - PubMed

Publication types

Cite

AltStyle によって変換されたページ (->オリジナル) /