This site needs JavaScript to work properly. Please enable it to take advantage of the complete set of features!
Skip to main page content
U.S. flag

An official website of the United States government

Dot gov

The .gov means it’s official.
Federal government websites often end in .gov or .mil. Before sharing sensitive information, make sure you’re on a federal government site.

Https

The site is secure.
The https:// ensures that you are connecting to the official website and that any information you provide is encrypted and transmitted securely.

NIH NLM Logo
Log in
Access keys NCBI Homepage MyNCBI Homepage Main Content Main Navigation
. 2012 May;74(5):1098-124.
doi: 10.1007/s11538-011-9710-0. Epub 2012 Jan 5.

A periodically-forced mathematical model for the seasonal dynamics of malaria in mosquitoes

Affiliations

A periodically-forced mathematical model for the seasonal dynamics of malaria in mosquitoes

Nakul Chitnis et al. Bull Math Biol. 2012 May.

Abstract

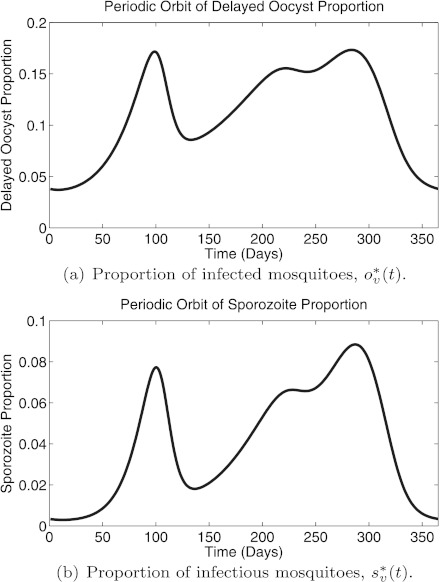
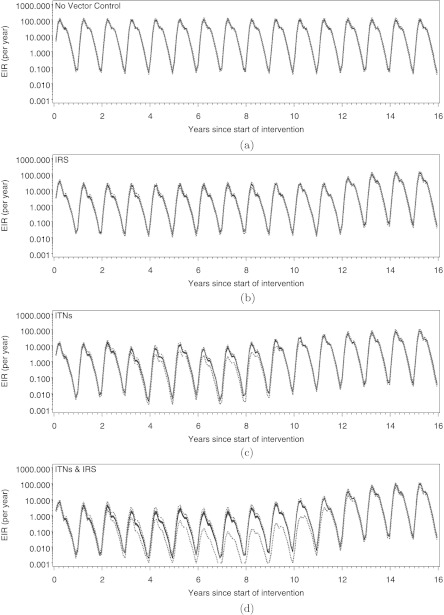
We describe and analyze a periodically-forced difference equation model for malaria in mosquitoes that captures the effects of seasonality and allows the mosquitoes to feed on a heterogeneous population of hosts. We numerically show the existence of a unique globally asymptotically stable periodic orbit and calculate periodic orbits of field-measurable quantities that measure malaria transmission. We integrate this model with an individual-based stochastic simulation model for malaria in humans to compare the effects of insecticide-treated nets (ITNs) and indoor residual spraying (IRS) in reducing malaria transmission, prevalence, and incidence. We show that ITNs are more effective than IRS in reducing transmission and prevalence though IRS would achieve its maximal effects within 2 years while ITNs would need two mass distribution campaigns over several years to do so. Furthermore, the combination of both interventions is more effective than either intervention alone. However, although these interventions reduce transmission and prevalence, they can lead to increased clinical malaria; and all three malaria indicators return to preintervention levels within 3 years after the interventions are withdrawn.


Figures

Fig. 1
Fig. 1
New mosquitoes emerge from water bodies (and mate) at rate N v0(t) into the host-seeking state A, where they actively search for blood meals. A mosquito may encounter and feed on up to n different types of hosts. Each type of host, represented by subscript i for 1≤in, is available to mosquitoes at rate α i(t). If a mosquito does not encounter a host in a given night, it waits in the host-seeking phase till the next night, with probability, P A(t). When a mosquito encounters a host of type i and is committed to biting the host, it moves to state B i. If the mosquito bites, it moves to state C i where it searches for a resting place. If it finds a resting place, it moves to state D i where it rests for τ days. After resting, the mosquito moves to state E i where it seeks to lay eggs. If it is successful in laying eggs, it returns to host-seeking state, A, where it may then encounter any type of host. At each state, the mosquito may die with some probability, labeled by subscript μ. The survival probabilities and the emergence rate are periodic with a period of one year. (b) is reproduced, with permission, from Chitnis et al. (, Fig. 2)
Fig. 2
Fig. 2
Input periodic sequences for the parameter values of the mosquito emergence rate, N v0(t), and the human infectivity to mosquitoes, K vi(t), used to drive the mosquito malaria model
Fig. 3
Fig. 3
The simulated total number, number of infected, and number of infectious host-seeking mosquitoes from parameter values in Table 3 and Fig. 2 of the periodically forced mosquito malaria model (2a), (2b), (2c)
Fig. 4
Fig. 4
Globally asymptotically stable periodic sequence of the proportion of mosquitoes who have fed at least once; calculated from (9a), (9b) and (10) with parameter values in Table 3 and Fig. 2
Fig. 5
Fig. 5
Globally asymptotically stable periodic sequences for the proportion of infected and infectious mosquitoes for (2a), (2b), (2c) with parameter values in Table 3 and Fig. 2
Fig. 6
Fig. 6
Globally asymptotically stable periodic sequences for the number of bites and number of infectious bites each person receives per day for (2a), (2b), (2c) with parameter values in Table 3 and Fig. 2
Fig. 7
Fig. 7
(Color online) The annual EIR (number of infectious bites per person per year) with (a) no vector control interventions; (b) two annual spray rounds of IRS from year 0 to year 11 with 95% coverage; (c) three mass distributions of ITNs at years 0, 3, and 6 with 95% coverage; (d) combined distribution of both ITNs and IRS as above. The solid (blue) line is the median; the shaded (grey) area is the interquartile range; and the dotted (black) lines are the minimum and the maximum values, at each time point of simulation results of the ensemble of malaria models with multiple random seeds. All entomological, epidemiological, and health systems settings for the simulations are based on Namawala, Tanzania, with a human population size of 1,000, and an initial preintervention annual EIR of 320 infectious bites per person
Fig. 8
Fig. 8
(Color online) The prevalence of malaria infection (proportion of people infected with the malaria parasite) with (a) no vector control interventions; (b) two annual spray rounds of IRS from year 0 to year 11 with 95% coverage; (c) three mass distributions of ITNs at years 0, 3, and 6 with 95% coverage; (d) combined distribution of both ITNs and IRS as above. The solid (blue) line is the median; the shaded (grey) area is the interquartile range; and the dotted (black) lines are the minimum and the maximum values, at each time point, of simulation results of the ensemble of malaria models with multiple random seeds. All entomological, epidemiological, and health systems settings for the simulations are based on Namawala, Tanzania, with a human population size of 1,000, and an initial preintervention annual EIR of 320 infectious bites per person
Fig. 9
Fig. 9
(Color online) The rate of clinical incidence (number of uncomplicated clinical malaria episodes per year) with (a) no vector control interventions; (b) two annual spray rounds of IRS from year 0 to year 11 with 95% coverage; (c) three mass distributions of ITNs at years 0, 3, and 6 with 95% coverage; (d) combined distribution of both ITNs and IRS as above. The solid (blue) line is the median; the shaded (grey) area is the interquartile range; and the dotted (black) lines are the minimum and the maximum values, at each time point of simulation results of the ensemble of malaria models with multiple random seeds. All entomological, epidemiological, and health systems settings for the simulations are based on Namawala, Tanzania with a human population size of 1,000, and an initial preintervention annual EIR of 320 infectious bites per person

References

    1. Anderson R. M., May R. M. Infectious diseases of humans: dynamics and control. Oxford: Oxford Unversity Press; 1991.
    1. Anderson R. A., Knols B. G. J., Koella J. C. Plasmodium falciparum sporozoites increase feeding-associated mortality of their mosquito hosts Anopheles gambiae s.l. Parasitology. 2000;120:329–333. doi: 10.1017/S0031182099005570. - DOI - PubMed
    1. Aron J. L. Mathematical modeling of immunity to malaria. Math. Biosci. 1988;90:385–396. doi: 10.1016/0025-5564(88)90076-4. - DOI
    1. Aron J. L., May R. M. The population dynamics of malaria. In: Anderson R. M., editor. The population dynamics of infectious disease: theory and applications. London: Chapman and Hall; 1982. pp. 139–179.
    1. Charlwood J. D., Smith T., Billingsley P. F., Takken W., Lyimo E. O. K., Meuwissen J. H. E. T. Survival and infection probabilities of anthropophagic anophelines from an area of high prevalence of Plasmodium falciparum in humans. Bull. Entomol. Res. 1997;87:445–453. doi: 10.1017/S0007485300041304. - DOI

Publication types

Cite

AltStyle によって変換されたページ (->オリジナル) /