An official website of the United States government
Dot gov
The .gov means it’s official.
Federal government websites often end in .gov or .mil. Before
sharing sensitive information, make sure you’re on a federal
government site.
Https
The site is secure.
The https:// ensures that you are connecting to the
official website and that any information you provide is encrypted
and transmitted securely.
To sense myriad environmental odors, animals have evolved multiple, large families of divergent olfactory receptors. How and why distinct receptor repertoires and their associated circuits are functionally and anatomically integrated is essentially unknown. We have addressed these questions through comprehensive comparative analysis of the Drosophila olfactory subsystems that express the ionotropic receptors (IRs) and odorant receptors (ORs). We identify ligands for most IR neuron classes, revealing their specificity for select amines and acids, which complements the broader tuning of ORs for esters and alcohols. IR and OR sensory neurons exhibit glomerular convergence in segregated, although interconnected, zones of the primary olfactory center, but these circuits are extensively interdigitated in higher brain regions. Consistently, behavioral responses to odors arise from an interplay between IR- and OR-dependent pathways. We integrate knowledge on the different phylogenetic and developmental properties of these receptors and circuits to propose models for the functional contributions and evolution of these distinct olfactory subsystems.
Odor response profiles of IR-expressing coeloconic sensilla neurons. Electrophysiological responses in the four...
Figure 1.
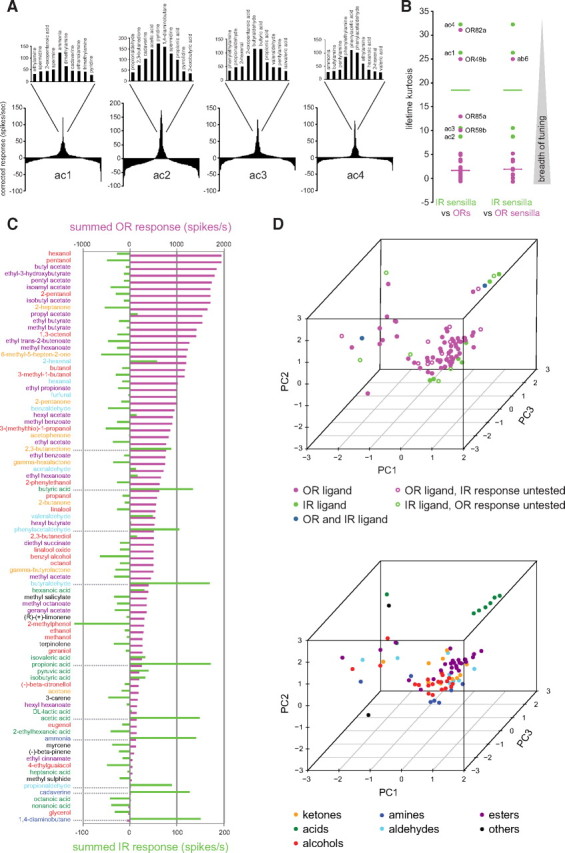
Odor response profiles of IR-expressing coeloconic sensilla neurons. Electrophysiological responses in the four antennal coeloconic sensilla classes (ac1–ac4) to 168 odors (mean ± SEM; n ≥ 4, mixed genders), representing the summed, solvent-corrected activities of the IR-expressing neurons they house, indicated in the diagrams at the top [the broadly expressed IR8a and IR25a coreceptors are not indicated (Abuin et al., 2011)]. We quantified summed responses because the small and overlapping spike amplitude of coeloconic neurons makes reliable spike sorting extremely difficult (Benton et al., 2009); a previous analysis was able to distinguish only two of the three neurons in ac1 and ac2 sensilla and was unable to discriminate the three OSNs in ac4 (Yao et al., 2005). Negative values indicate responses smaller than those evoked by the corresponding solvent, most likely attributable to suppression of basal activity in these neurons (Yao et al., 2005). Solvent responses are as follows: ac1, water, 19.69 ± 3.06; paraffin oil, 19.69 ± 3.25; ac2, water, 23.33 ± 4.79; paraffin oil, 28.22 ± 4.92; ac3, water, 14.39 ± 2.47; paraffin oil, 16.48 ± 2.16; ac4, water, 6.06 ± 1.91; paraffin oil, 1.56 ± 1.36. The summing of responses from neurons within a sensillum that display opposite changes in spike frequency will unavoidably lead to underestimations of evoked responses, but this is likely to affect only a very small minority of odor/neuron pairs. Odorants are color coded by functional group; chemicals containing multiple distinct functional groups were classified according to the IUPAC nomenclature of organic chemistry (Panico et al., 1993). We used a wild-type strain for all sensilla except for ac3, in which we recorded from a mutant line, OR35af02057, which lacks the function of this broadly tuned OR (Yao et al., 2005). Data for ac4 sensilla are in part adapted from our unpublished observations (Y.G., R.R., and R.B.).
Comparison of the odor tuning properties of IR and OR repertoires. A ,...
Figure 2.
Comparison of the odor tuning properties of IR and OR repertoires. A, Tuning curves of coeloconic sensilla classes. The 168 odorants are displayed along the x-axis according to the magnitude of response they elicit, with the best agonists placed near the center of the distribution and the weakest agonists toward the edges. The top 10 odor ligands for each sensillum class are shown in the magnification of the central portion of the distribution. B, Lifetime kurtosis of the four classes of coeloconic sensilla (green) compared with that of individual ORs (magenta, left) and of the sensilla classes housing OR-expressing neurons (magenta, right), calculated from data in Figure 1 and the study by Hallem and Carlson (2006). Horizontal bars represent the median values. To calculate the response profiles of sensilla housing OR-expressing neurons, we summed the responses of all OR-expressing neurons housed in the same sensillum class (see Materials and Methods). The functional significance, if any, of the more narrowly tuned ORs (lifetime kurtosis values >10) is unknown; the high lifetime kurtosis value for the ab6 sensillum is likely an artifact because this value reflects the tuning of only one of two ORs in this sensillum [OR49b; the other has not been identified (Couto et al., 2005)]. C, Summed responses of OR (magenta) (Hallem and Carlson, 2006) and IR (green) OSNs to a set of odors common to both studies. Odor names are color coded by functional group as in Figure 1. D, PCA of the physicochemical properties of the best OR and IR ligands (see Materials and Methods). Top, Data points are colored according to the receptor family they activate; open circles indicate that the respective odor was present in only the IR or OR dataset. Bottom, Data points are colored according to their functional group. PC1, PC2, and PC3 explain 21, 18, and 14% of the variance, respectively.
Peripheral and central spatial maps of IR olfactory sensory neurons. A , Peripheral...
Figure 3.
Peripheral and central spatial maps of IR olfactory sensory neurons. A, Peripheral distributions of coeloconic sensilla visualized by expression of a nuclear GFP reporter under the control of a sensillum class-specific driver: ac1 (IR92a–GAL4;UAS–nlsGFP); ac2 (IR41a–GAL4;UAS–nlsGFP); ac3 (OR35a–GAL4;UAS–nlsGFP); ac4 (IR84a–GAL4;UAS–nlsGFP). Scale bar, 20 μm. A schematic representation of these distributions is shown on the left. B–D, Antennal lobes expressing a UAS–mCD8:GFP reporter (or UAS–nsyb:GFP for IR25a) under the control of distinct IR–GAL4 driver transgenes, stained for GFP (green) and the general neuropil marker mAb nc82 (magenta). Scale bar, 20 μm. The images are grouped by coeloconic sensilla uniglomerular projections (B), sacculus neuron projections (C), and multiglomerular projection of neurons expressing reporters for IR coreceptors (D). E, Antennal lobe projections of IR neurons, visualized as in B–D, in animals subject to unilateral (left) deafferation 10 d before staining. Scale bar, 20 μm. F, Three-dimensional reconstruction of a female left antennal lobe, orientated from different viewpoints, illustrating segregation of OR (purple) and IR (green) OSN-innervated glomeruli. G, Posterior view of the 3D reconstruction shown in F in which glomeruli innervated by neurons housed in the same antennal structure are highlighted. H, Distribution of antennal lobe glomeruli receiving bilateral (cyan) or exclusively ipsilateral (yellow) sensory input, as determined by the unilateral deafferation experiments shown in E. D, Dorsal; L, lateral; M, medial; V, ventral.
Definition of IR neuron odor specificity. Odor-evoked calcium responses in axon termini in...
Figure 4.
Definition of IR neuron odor specificity. Odor-evoked calcium responses in axon termini in the antennal lobe (AL) of individual populations of IR OSNs were visualized with UAS–GCaMP1.6 expressed under the control of the indicated IR–GAL4 lines. IR OSNs are organized by coeloconic sensilla class (ac1–ac4). The schematic at the top left shows the view of the antennal lobes in the in vivo preparation. For each IR neuron population, a raw fluorescence image shows the position in the antennal lobe of the corresponding glomerulus. The responses to the best ligands (color coded by chemical class as in Fig. 1) of each sensillar class, together with solvent controls, are shown as heat maps. Each box represents the relative changes in fluorescence measured in seven flies during 10 s recordings. The black line under the boxes indicates the stimulation time (1 s). The range of the color scale was adjusted for each OSN type and is indicated within the scale bar, with the vertical white or black line showing the position of zero fluorescence change. Responses in the DL2 glomerulus (red oval), presumed to be innervated by ac3 IR75a/IR75b/IR75c neurons, were visualized using the IR8a–GAL4 driver. For ammonia responses in ac1 IR92a neurons and pyrrolidine responses in ac2 IR41a neurons, the standard 1% stimulus concentration appeared to cause sensory adaption, and the strongest odor-evoked responses in these cases was observed at 0.1 and 0.01% stimulus concentrations, respectively (data not shown). Certain IR75d OSN response data are replicated across ac1, ac2, and ac4—in which this receptor is expressed—for ease of comparison of different neural responses within sensillum types.
Evolutionary, developmental, and functional organization...
Figure 5.
Evolutionary, developmental, and functional organization of IR sensory input. A , A functional...
Figure 5.
Evolutionary, developmental, and functional organization of IR sensory input. A, A functional map of the antennal lobe summarizing the principal ligands and receptors corresponding to each IR glomerulus. B, Distribution of target glomeruli receiving input from acid-sensitive (red) and amine-sensitive (blue) OSNs. Dark gray glomeruli, in this and subsequent panels, represent IR glomeruli for which data is unavailable; light gray glomeruli correspond to those innervated by OR-expressing OSNs. C, Distribution of target glomeruli receiving input from IR8a-dependent (red) and IR25a-dependent (blue) OSNs. The innervations of IR40a neurons are shown in light blue because these neurons robustly coexpress IR25a, but not IR8a, although their function and coreceptor dependency is unknown. D, Distribution of target glomeruli receiving input from OSNs in which Notch signaling is inactive (Notch OFF) (red) or active (Notch ON) (blue), based on data from Endo et al. (2007). E, Distribution of target glomeruli receiving input from OSNs in which a Patched (magenta) or Engrailed (green) reporter is active, representing proteins that receive or regulate Hedgehog signals, respectively, based on data from Chou et al. (2010a). F, Phylogenetic tree of antennal IRs and selected iGluRs. The sequences were aligned with ProbCons (Do et al., 2005). The tree was built using PhyML (Guindon and Gascuel, 2003) based on a manually cleaned alignment with 1000 bootstrap replicates. Filled circles indicate a bootstrap support of >90, open circles indicate a bootstrap support between 70 and 90. iTOL (Letunic and Bork, 2007) was used to view and graphically edit the tree. The phylogeny was rooted using the iGluRs. The scale bar represents the expected number of substitutions per site. G, Scatter plot of glomerular separation (distance between geometric centers) versus molecular distance (a measure of primary sequence divergence) for all 36 pairwise combinations of uniglomerular IRs. The sequences were aligned using ProbCons (probabilistic consistency), and the JTT (Jones, Taylor, and Thornton) method as implemented in MEGA (Tamura et al., 2007) was used to calculate the pairwise molecular distances. D, Dorsal; L, lateral; M, medial; V, ventral.
Neuroanatomy of processing and higher-order representations of IR-dependent odor stimuli. A , A...
Figure 6.
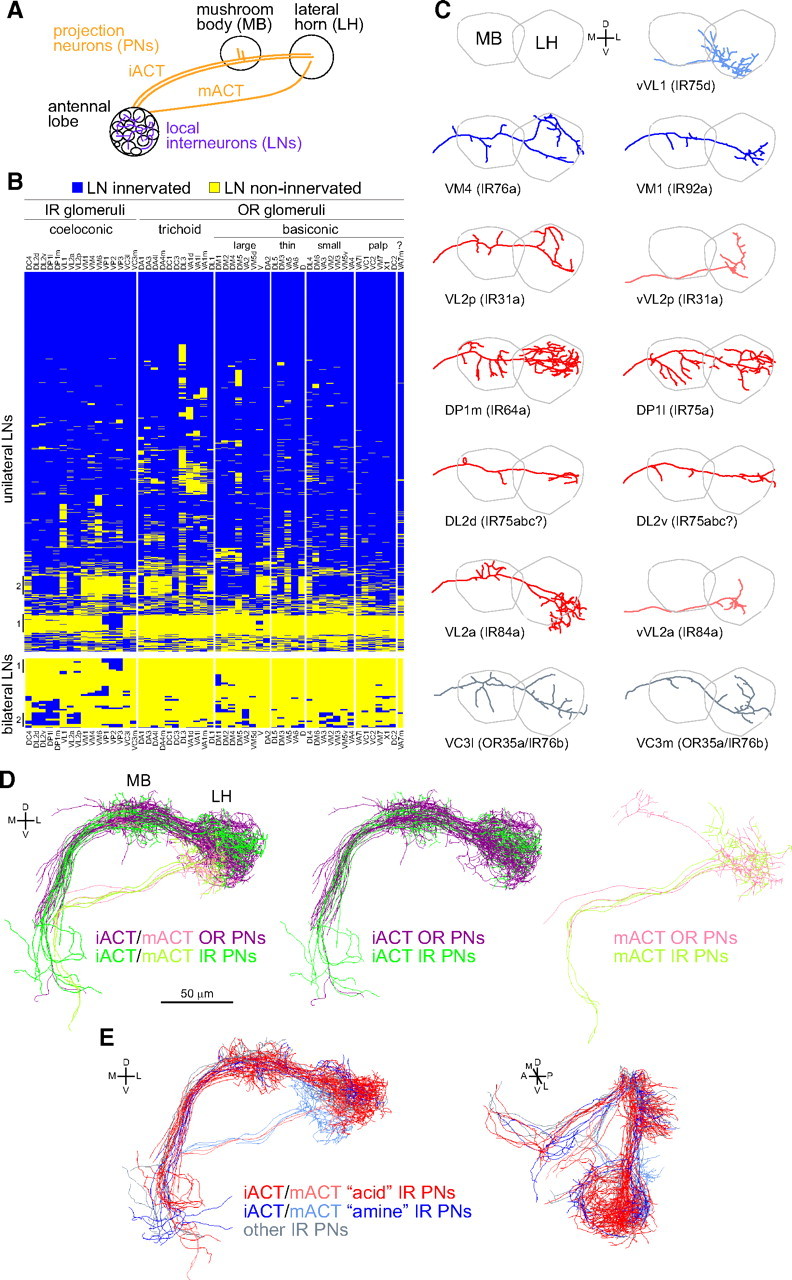
Neuroanatomy of processing and higher-order representations of IR-dependent odor stimuli. A, A schematic of higher olfactory brain center anatomy. PNs take one of two tracts to the higher centers, the inner antennocerebral tract (iACT) or mACT, depending on whether they derive from the anterodorsal/lateral neuroblasts or ventral neuroblast, respectively. B, Glomerular innervation patterns of 1489 singly labeled unilateral LNs (top) or 43 singly labeled bilateral LNs (bottom) organized by hierarchical clustering, using data from Chou et al. (2010b). Each row represents the innervation pattern of a single LN (blue, innervated; yellow, non-innervated). The columns represent 54 glomeruli, arranged by sensillar class to broadly demarcate the IR and OR olfactory subsystems. VA7m (marked with a "?") is innervated by a molecularly undefined population of OSNs. Vertical lines to the left of the table mark subsets of LNs with notable glomerular innervations (see Results). Cluster analysis, using complete linkage and Euclidean distances, was performed using R software (www.r-project.org). C, Plots of single representative traced neurons, after registration, for 13 available PN classes innervating IR glomeruli. PN classes are ordered by putative functional classes (defined by corresponding IR OSN inputs) and then by IR gene name. VL2a and VL2p are innervated by PNs derived from both lateral and ventral neuroblasts that follow the iACT and mACT tracts, respectively; the "v" suffix denotes the latter type. PNs are colored according to the classes described in E. Raw image data for different PN classes are from the following sources: VL2a (Wong et al., 2002); vVL1, VL2p, VM1 (Jefferis et al., 2007); DL2d, DL2v, DP1l, VC3l, VC3m, vVL2a, vVL2p, VM1, VM4 (Chiang et al., 2011). D, 3D renderings of tracings for all registered OR (purple/pink) and IR (dark/light green) PN classes. Separate renderings for iACT and mACT PNs (in paler colors) are shown to the right. Data for OR PNs is adapted from Jefferis et al. (2007). E, 3D renderings of tracings for all registered IR PNs innervating IR8a-dependent/acid-responsive glomeruli (red: IR31a/VL2p, IR64a/DP1m, IR75a/DP1l, IR75abc/DL2, IR84a/VL2a), IR25a-dependent/amine-responsive glomeruli (blue: IR76b/VM4, IR75d/VL1, IR92a/VM1), and PNs innervating other IR-positive glomeruli (gray: IR76b/OR35a/VC3). Paler red and blue colors are used for mACT neurons. D, Dorsal; L, lateral; M, medial; V, ventral.
Behavioral integration of odor stimuli by OR and IR sensory channels. A ,...
Figure 7.
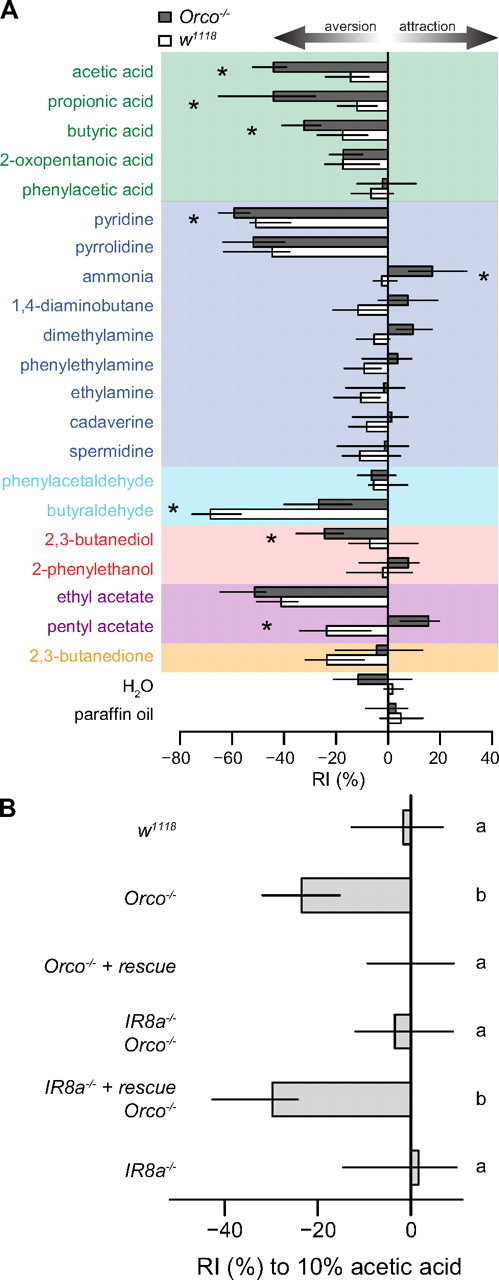
Behavioral integration of odor stimuli by OR and IR sensory channels. A, Response indices (RIs) of Orco1 mutant and wild-type (w1118) flies to a set of IR and OR odor ligands in a T-maze choice assay (see Materials and Methods). Bars indicate the median of 7–12 independent experiments and the first and third quartiles of the distribution. Asterisks indicate that the comparison between the two genotypes for a given odor resulted in an adjusted p value of <0.05 (Mann–Whitney U test, p values corrected with the Benjamini–Hochberg method for multiple comparisons). Ligands are colored according to their chemical class as in Figure 1. B, Response indices to 10% acetic acid in the T-maze of flies of the following genotypes (top to bottom): (i) w118, (ii) ORCO1, (iii) ORCO1, ORCOrescue, (iv) IR8a1; ORCO1, (v) IR8a1, IR8arescue; ORCO1 and (vi) IR8a1. Bars labeled with different letters are significantly different (adjusted p < 0.05, all pairwise comparisons with Mann–Whitney U test corrected with the Benjamini–Hochberg method for multiple comparisons, n = 15–16).
Adams MD, Celniker SE, Holt RA, Evans CA, Gocayne JD, Amanatides PG, Scherer SE, Li PW, Hoskins RA, Galle RF, George RA, Lewis SE, Richards S, Ashburner M, Henderson SN, Sutton GG, Wortman JR, Yandell MD, Zhang Q, Chen LX, et al. The genome sequence of Drosophila melanogaster. Science. 2000;287:2185–2195.
-
PubMed
Ai M, Min S, Grosjean Y, Leblanc C, Bell R, Benton R, Suh GS. Acid sensing by the Drosophila olfactory system. Nature. 2010;468:691–695.
-
PMC
-
PubMed
Armstrong N, Sun Y, Chen GQ, Gouaux E. Structure of a glutamate-receptor ligand-binding core in complex with kainate. Nature. 1998;395:913–917.
-
PubMed
Becher PG, Bengtsson M, Hansson BS, Witzgall P. Flying the fly: long-range flight behavior of Drosophila melanogaster to attractive odors. J Chem Ecol. 2010;36:599–607.
-
PubMed