Spatio-temporal analysis of mortality among children under the age of five in Manhiça (Mozambique) during the period 1997-2005
- PMID: 21332980
- PMCID: PMC3050678
- DOI: 10.1186/1476-072X-10-14
Spatio-temporal analysis of mortality among children under the age of five in Manhiça (Mozambique) during the period 1997-2005
Abstract
Background: Reducing childhood mortality is the fourth goal of the Millennium Development Goals agreed at the United Nations Millennium Summit in September 2000. However, childhood mortality in developing countries remains high. Providing an accurate picture of space and time-trend variations in child mortality in a region might generate further ideas for health planning actions to achieve such a reduction. The purpose of this study was to examine the spatio-temporal variation for child mortality rates in Manhiça, a district within the Maputo province of southern rural Mozambique during the period 1997-2005 using a proper generalized linear mixed model.
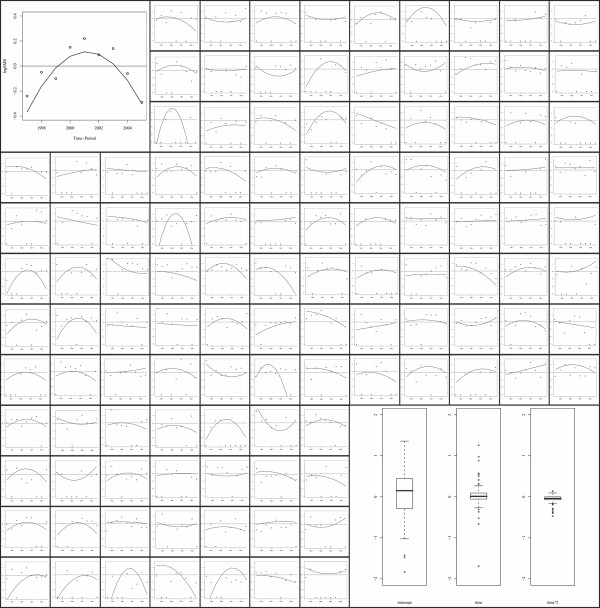
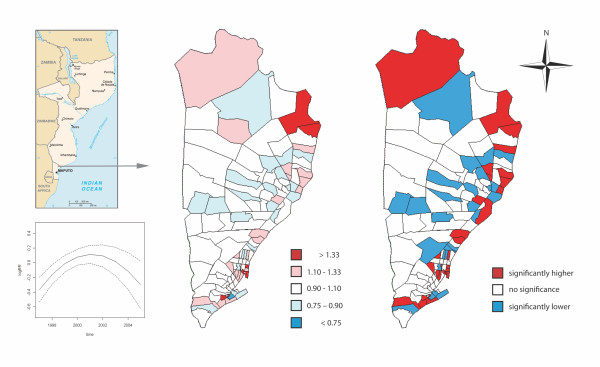
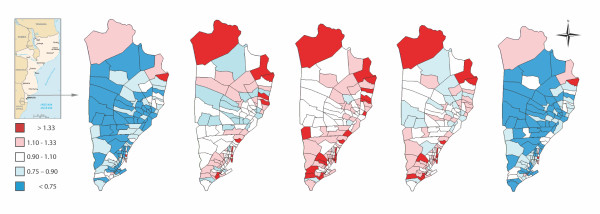
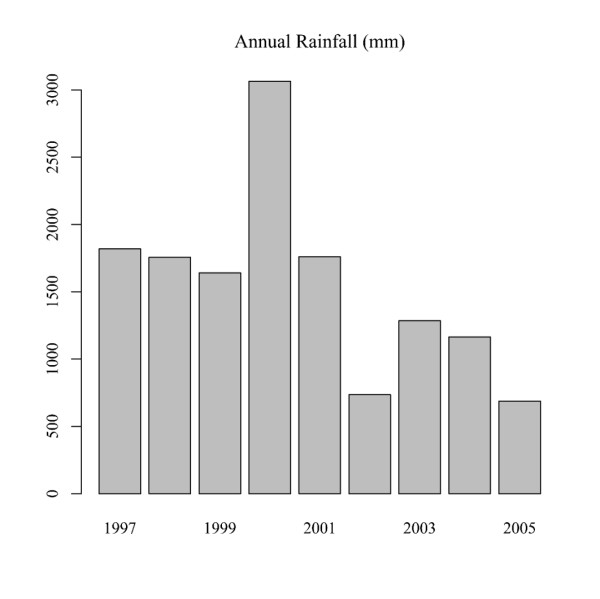
Results: The results showed that childhood mortality in all the area was modified from year to year describing a convex time-trend but the spatial pattern described by the neighbourhood-specific underlying mortality rates did not change during the entire period from 1997 to 2005, where neighbourhoods with highest risks are situated in the peripheral side of the district. The spatial distribution, though more blurred here, was similar to the spatial distribution of child malaria incidence in the same area. The peak in mortality rates observed in 2001 could have been caused by the precipitation system that started in early February 2000, following which heavy rains flooded parts of Mozambique's southern provinces. However, the mortality rates at the end of the period returned to initial values.
Conclusions: The results of this study suggest that the health intervention programmes established in Manhiça to alleviate the effects of flooding on child mortality should cover a period of around five years and that special attention might be focused on eradicating malaria transmission. These outcomes also suggest the utility of suitably modelling space-time trend variations in a region when a point effect of an environmental factor affects all the study area.
Figures
References
-
- Stansfeld SK, Walsh J, Prate N, Evans T. Information to improve decision making for health. In Disease control priorities in developing countries. New York, Oxford University Press; 2006. pp. 1017–30.
-
- Alonso P, Saute F, Aponte JJ. Population and health in developing countries; vol.1, population, health and survival at INDEPTH sites. Ottawa: International Development Research Centre (IDCR); 2002.
Publication types
MeSH terms
LinkOut - more resources
Full Text Sources