This site needs JavaScript to work properly. Please enable it to take advantage of the complete set of features!
Skip to main page content
U.S. flag

An official website of the United States government

Dot gov

The .gov means it’s official.
Federal government websites often end in .gov or .mil. Before sharing sensitive information, make sure you’re on a federal government site.

Https

The site is secure.
The https:// ensures that you are connecting to the official website and that any information you provide is encrypted and transmitted securely.

NIH NLM Logo
Log in
Access keys NCBI Homepage MyNCBI Homepage Main Content Main Navigation
. 2010 Jun 17;6(6):e1000953.
doi: 10.1371/journal.ppat.1000953.

Cryptococcal cell morphology affects host cell interactions and pathogenicity

Affiliations

Cryptococcal cell morphology affects host cell interactions and pathogenicity

Laura H Okagaki et al. PLoS Pathog. .

Erratum in

  • PLoS Pathog. 2010;6(6). doi: 10.1371/annotation/1b59fd9e-9ac9-4ea8-a083-14c413c80b03

Abstract

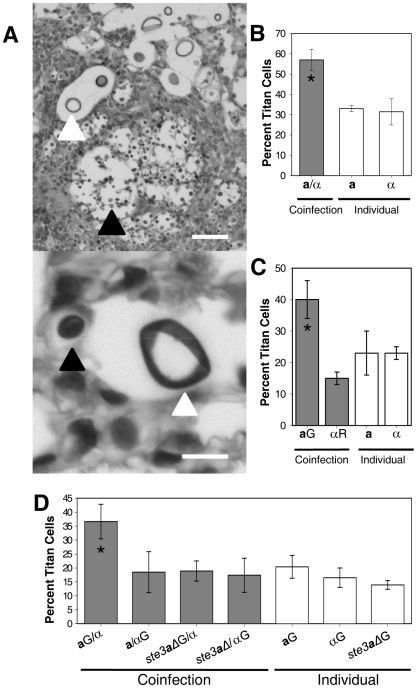
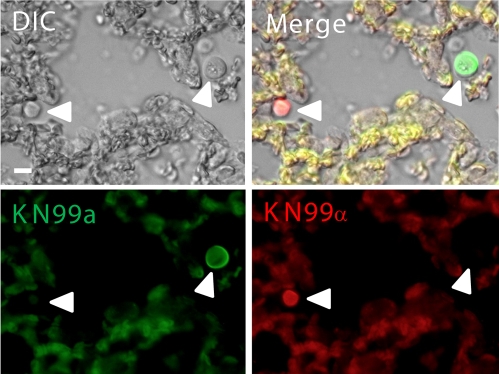
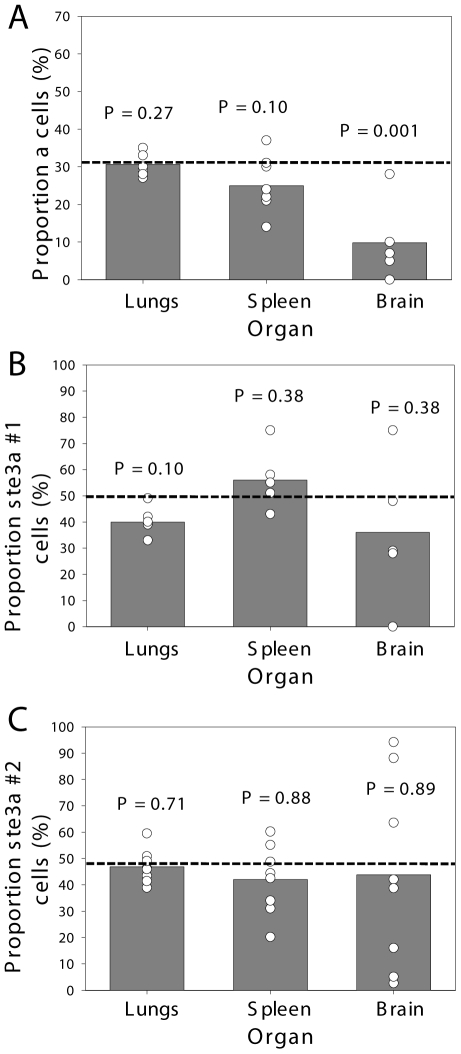
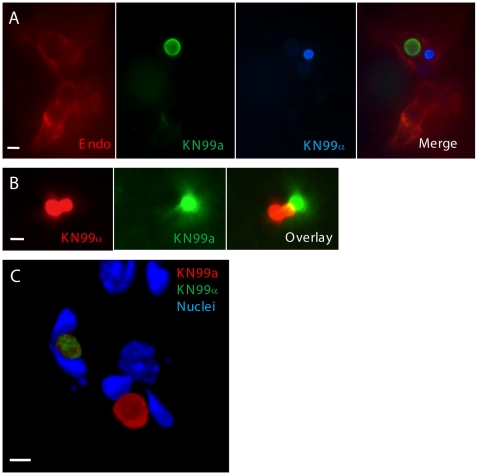
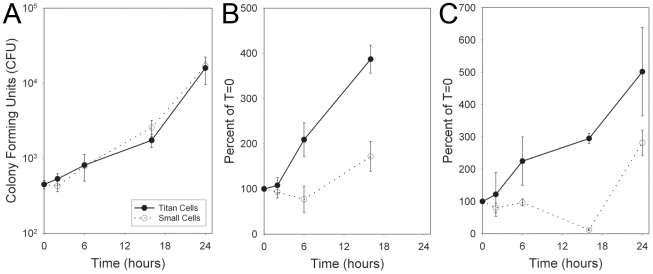
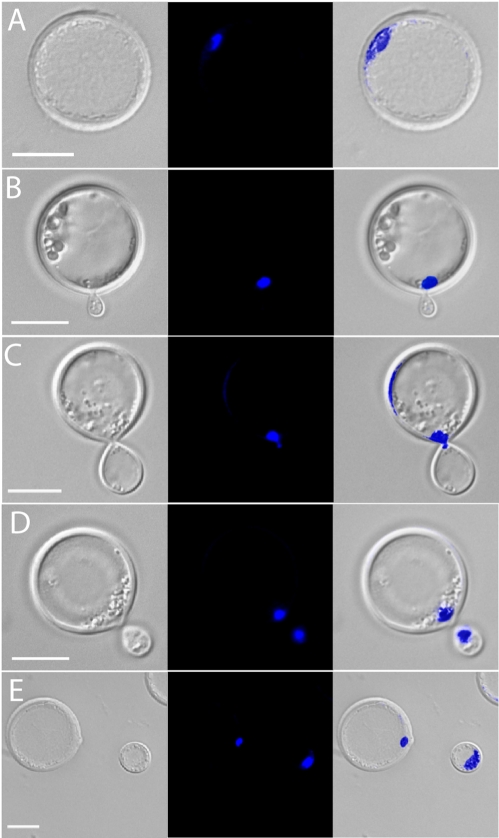
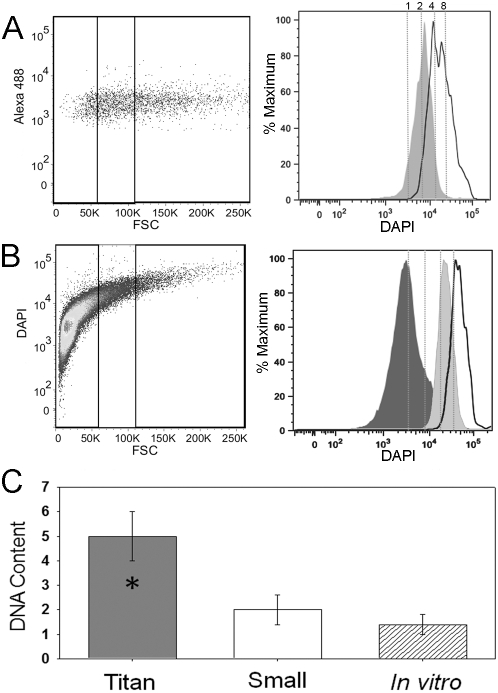
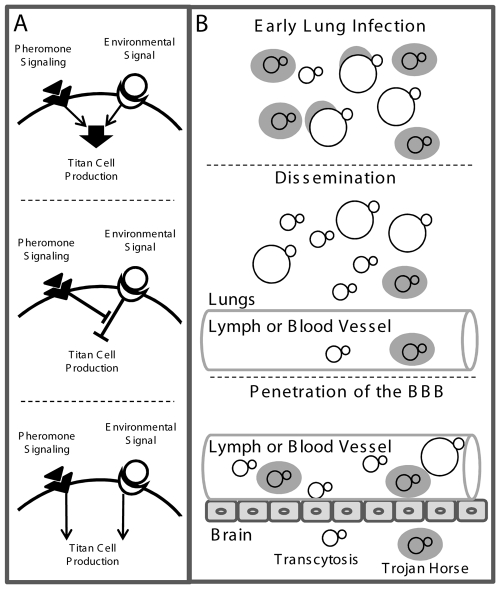
Cryptococcus neoformans is a common life-threatening human fungal pathogen. The size of cryptococcal cells is typically 5 to 10 microm. Cell enlargement was observed in vivo, producing cells up to 100 microm. These morphological changes in cell size affected pathogenicity via reducing phagocytosis by host mononuclear cells, increasing resistance to oxidative and nitrosative stress, and correlated with reduced penetration of the central nervous system. Cell enlargement was stimulated by coinfection with strains of opposite mating type, and ste3aDelta pheromone receptor mutant strains had reduced cell enlargement. Finally, analysis of DNA content in this novel cell type revealed that these enlarged cells were polyploid, uninucleate, and produced daughter cells in vivo. These results describe a novel mechanism by which C. neoformans evades host phagocytosis to allow survival of a subset of the population at early stages of infection. Thus, morphological changes play unique and specialized roles during infection.


Conflict of interest statement

The authors have declared that no competing interests exist.

Figures

Figure 1
Figure 1. Titan cells in the lungs of coinfected mice.
A) Mice were coinfected with an approximate 1∶1 ratio of a:α intranasally at a final concentration of ×ばつ104 cells. Lung sections were stained with periodic acid Schiff (PAS) 14 days (top) or 3 days (bottom) post-infection. White arrow denotes C. neoformans cells >10 μm in diameter. Black arrow denotes cells ≤10 μm in diameter. Top: bar = 100 μm, bottom: bar = 10 μm. B) The number of small cells (≤10 μm) and titan cells (>10 μm) were quantified in single and coinfections at 7 days post-infection. >500 cells were counted per treatment per mouse. Error bars indicate SD from 3 mice per treatment. Asterisk indicates p<0.01 in pair-wise comparisons to all other samples. C) Mice were infected by inhalation with ×ばつ104 of either a cells labeled with AlexaFluor 488 (green, aG), α cells labeled with AlexaFluor 594 (red, αR), or coinfected with an approximate 1∶1 ratio of each mating type. At 2–3 days post-infection, animals were sacrificed and unstained tissue sections were examined for fluorescence and cell size. >80 cells were analyzed per mouse per treatment. Data are representative of three independent experiments with three mice per treatment. Error bars indicate SD. Asterisk indicates p<0.01 in pair-wise comparisons to all other samples. D) Mice were infected with ×ばつ107 cells by inhalation of either a, α, or ste3 a Δ cells labeled with AlexaFluor 488 or coinfected with one labeled and one unlabeled strain. Cells obtained by bronchoalveolar lavage (BAL) were fixed and examined by microscopy for green fluorescence and cell size. >500 cells were examined per animal. Error bars indicate SD from four mice per treatment. Asterisk indicates p<0.01 in pair-wise comparisons to all other samples; p-values >0.2 were observed for other pair-wise comparisons.
Figure 2
Figure 2. Fluorescently labeled a (green) and α (red) cells in the lungs during coinfection.
C. neoformans a and α strains were combined with AlexaFluor 488 (green) or AlexaFluor 594 (red), respectively, and incubated for 20 minutes. Cells were washed with PBS to remove excess dye. Mice were inoculated with an approximate 1∶1 ratio of a:α cells at a final concentration of ×ばつ107 cells. At 2 days post-infection animals were sacrificed, lungs extracted, fixed in 10% buffered formalin, paraffin-embedded, and 5 μm sections generated. Host tissues are autofluorescent at both wavelengths resulting in a yellow color upon overlay. White arrows denote fluorescent C. neoformans cells. Bar = 20 μm.
Figure 3
Figure 3. C. neoformans pheromone receptor mutant strains penetrate the CNS during coinfection.
Mice were coinfected intranasally with an approximate 1∶1 ratio of A) a:αNAT, B) ste3 a Δ#1:α, or C) ste3 a Δ#2:α at a final concentration of ×ばつ104 cells. The actual proportion of a cells in the infecting inoculum was determined by growth on selective medium and is plotted as a horizontal dashed line. At 21 days post-infection animals were sacrificed, the lungs, brain, and spleen were homogenized and serial dilutions plated. >500 colonies per organ per mouse were isolated and assayed for drug resistance to determine mating type. The proportion of a cells is plotted with open circles denoting values from individual animals and bar height representing the geometric mean. To determine P-values, Wilcoxon rank sum analysis was performed on the measured number of a and α cells compared with the expected number, assuming that both strains remained at the initial inoculum proportions.
Figure 4
Figure 4. KN99a and KN99α cells interact with endothelial cells of the blood-brain barrier during coinfection.
a or α were combined with AlexaFluor 350 (blue), AlexaFluor 488 (green) or AlexaFluor 594 (red) and incubated for 20 minutes. Mice were inoculated by tail vein injection with an approximate 1∶1 ratio of a:α at a final concentration of ×ばつ107 cells. At 1 day post-infection, animals were sacrificed and 50 μm frozen brain sections were obtained. A) Sections from mice infected with a (green) and α (blue) were immunostained with anti-collagen IV primary antibody (endothelial cell membrane) with a TRITC (red) labeled secondary antibody. Bar = 20 μm B) Sections from mice infected with a (green) and α (red) were imaged by confocal microscopy and sections were compiled as a projection. Bar size = 20 μm C) Frozen sections from mice infected with a (red) and α (green) were treated with Hoechst (host cell nuclei), imaged by confocal microscopy, and sections were compiled as a 3D rendering. The U-shaped nuclei are indicative of endothelial cells containing cryptococcal cells. Bar = 10 μm.
Figure 5
Figure 5. Titan cell formation and phagocytosis in the lungs of infected mice.
Mice were intranasally infected with either a, α, or ste3 a Δ cells labeled with AlexaFluor 488 (green) or coinfected with one labeled and one unlabeled strain (four mice per treatment). Cells obtained by BAL were fixed, stained with DAPI, and examined by microscopy for green fluorescence (cell type) and cell size. >500 cells were examined per animal. Bar = 10 μm A) C. neoformans a cells (green) ≤10 μm in diameter were visible inside host phagocytes. Host cells were identified by large blue DAPI stained nuclei. B) Several small α (≤10 μm) cells (green) can be seen inside a single host cell. C) Mating type a titan cells (>10 μm) are seen in contact with host phagocytes but are too large to be phagocytosed. D) Cells obtained by bronchoalveolar lavage (BAL) were fixed and examined by microscopy for green fluorescence and percent phagocytosis. >500 cells were examined per animal. Error bars indicate SD from four mice per treatment. Asterisk indicates p<0.09 in pair-wise comparisons to all other samples; p-values >0.4 were observed for other pair-wise comparisons.
Figure 6
Figure 6. Titan cells are resistant to oxidative and nitrosative stress.
Mice were coinfected intranasally with ×ばつ107 cryptococcal cells. At 3 days post-infection, BALs were performed and cells were sorted by FACS based on size. ×ばつ104 titan cells or small cells were resuspended in 100 μL RMPI. Cryptococcal cells received A) no treatment, B) 10 mM NaNO3, C) 1 mM TBHP. At 0, 6, 16, or 24 hours, aliquots of each treatment were plated on YPD agar and colony forming units (CFU) were determined. Error bars indicate SD from three replicates.
Figure 7
Figure 7. Titan cells can undergo cell division.
Mice were infected with ×ばつ107 cells by inhalation of an approximate 1∶1 ratio of a:α cells. At 3 days post-infection, mice were sacrificed, BALs performed, and the resulting cells were fixed and DAPI stained for nuclear content. A) Titan cell containing a single nucleus. B) Titan cell early bud formation. C) Nuclear transfer from a mother (titan cell) to a daughter cell. D) Titan cell late bud formation. E) Cytokinesis of a daughter cell from a titan cell. Bar = 10 μm.
Figure 8
Figure 8. Titan cells have increased DNA content.
Mice were intranasally infected with ×ばつ107 cells with an approximate 1∶1 ratio of a:α cells labeled with AlexaFluor 488 (green). At 3 days post-infection, mice were sacrificed, BALs performed, and the resulting cells were fixed. A) Cells were stained with DAPI to measure nuclear content by flow cytometry. Left panel indicates small (≤10 μm) and titan (>20 μm) cell population gates. Right panel indicates DNA content based on DAPI fluorescence for small (dark gray) and titan (white) populations normalized to cell number (% maximum). Dashed lines indicate predicted 1C, 2C, 4C, and 8C DNA content based on DAPI intensity of the 1C and 2C control cells stained and analyzed in the same experiment. B) Cells were grown in vitro in spent DMEM liquid medium for 7 days at 30°C. Cells were fixed and stained with DAPI. Left panel indicates small (≤10 μm), intermediate (>10, ≤20 μm), and titan (>20 μm) cell population gates. Right panel indicates DNA content based on DAPI fluorescence for small (dark gray), intermediate (light gray), and titan (white) populations normalized to cell number. Dashed lines indicate predicted 1C, 2C, 4C, and 8C DNA content based on DAPI intensity of the 1C and 2C control cells strained and analyzed in the same experiment. C) Fixed BAL samples were sorted into small and titan cell populations by fluorescence activated cell sorting. DNA was purified from the sorted populations, normalized to cell number, and chitin synthase 1 (CHS1) gene copy number was determined by comparison to a log phase control sample with a known ratio of 1C:2C cells with a total gene copy number equivalent to 1.4.
Figure 9
Figure 9. Model of titan cell signal transduction and pathogenesis.
A) Putative pathways involved in titan cell production. Top: Pheromone signaling may enhance an environmental sensing signal leading to titan cell production. Middle: Pheromone signaling may inhibit a negative regulator of titan cell formation. Bottom: Pheromone signaling may act independently of the environmental sensing and/or other pathways leading to titan cells formation. B) The effect of titan cell formation on pathogenesis. Top: Upon initial infection, titan cell production protects a subset of cells from phagocytosis and killing, to establish the infection. Middle: C. neoformans cells disseminate from the lungs either as free cells or inside host phagocytes. Bottom: Phagocytosis is required for efficient penetration of the blood-brain barrier. Cryptococcal cells may enter the brain by transcytosis, or as a "Trojan horse" inside of host phagocytes. Over-production of titan cells reduces blood-brain barrier penetration as a result of decreased phagocytosis.

References

    1. Klein BS, Tebbets B. Dimorphism and virulence in fungi. Curr Opin Microbiol. 2007;10:314–319. - PMC - PubMed
    1. San-Blas G, Travassos LR, Fries BC, Goldman DL, Casadevall A, et al. Fungal morphogenesis and virulence. Med Mycol. 2000;38(Suppl 1):79–86. - PubMed
    1. Morrow CA, Fraser JA. Sexual reproduction and dimorphism in the pathogenic basidiomycetes. FEMS Yeast Res. 2009;9:161–177. - PubMed
    1. Hung CY, Xue J, Cole GT. Virulence mechanisms of Coccidioides. Ann N Y Acad Sci. 2007;1111:225–235. - PubMed
    1. Mavor AL, Thewes S, Hube B. Systemic fungal infections caused by Candida species: epidemiology, infection process and virulence attributes. Curr Drug Targets. 2005;6:863–874. - PubMed

Publication types

MeSH terms

Cite

AltStyle によって変換されたページ (->オリジナル) /