This site needs JavaScript to work properly. Please enable it to take advantage of the complete set of features!
Skip to main page content
U.S. flag

An official website of the United States government

Dot gov

The .gov means it’s official.
Federal government websites often end in .gov or .mil. Before sharing sensitive information, make sure you’re on a federal government site.

Https

The site is secure.
The https:// ensures that you are connecting to the official website and that any information you provide is encrypted and transmitted securely.

NIH NLM Logo
Log in
Access keys NCBI Homepage MyNCBI Homepage Main Content Main Navigation
. 2010 Feb 22;188(4):547-63.
doi: 10.1083/jcb.200908086. Epub 2010 Feb 15.

Amiloride inhibits macropinocytosis by lowering submembranous pH and preventing Rac1 and Cdc42 signaling

Affiliations

Amiloride inhibits macropinocytosis by lowering submembranous pH and preventing Rac1 and Cdc42 signaling

Mirkka Koivusalo et al. J Cell Biol. .

Erratum in

  • J Cell Biol. 2010 Apr 19;189(2):385

Abstract

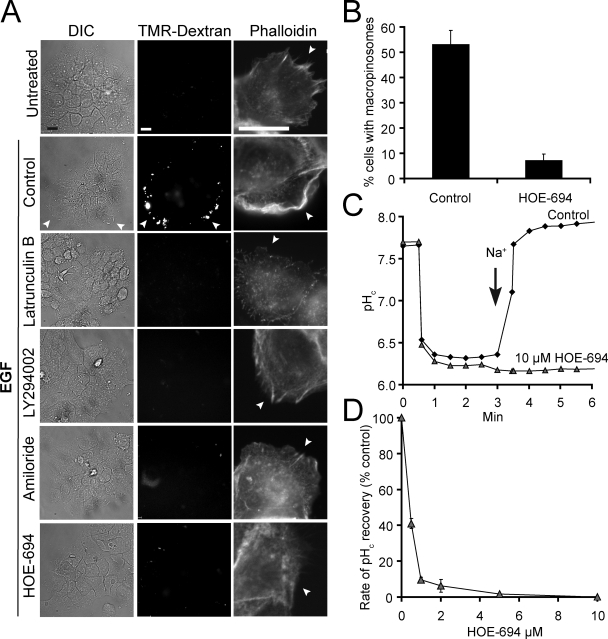
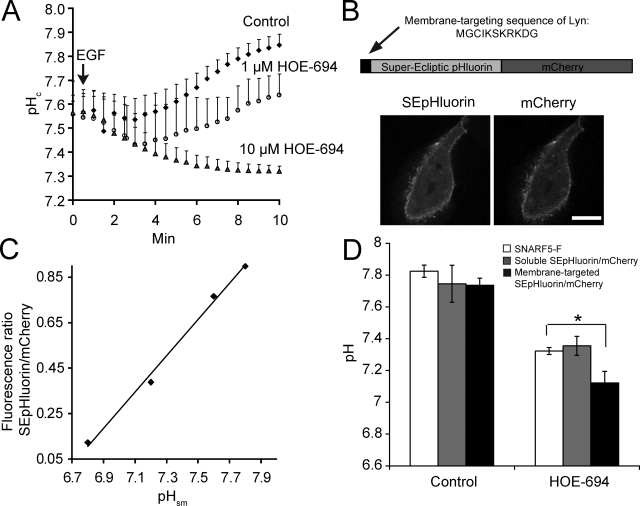
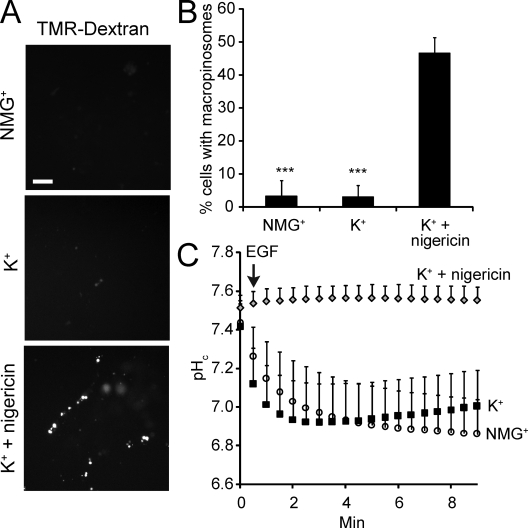
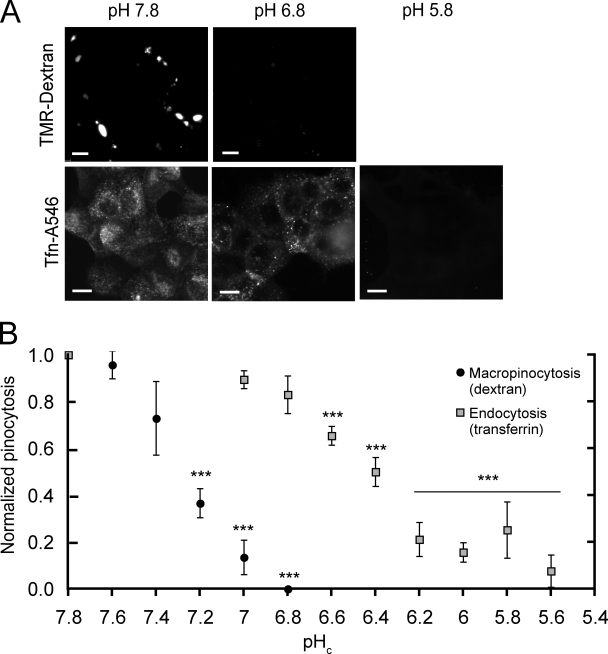
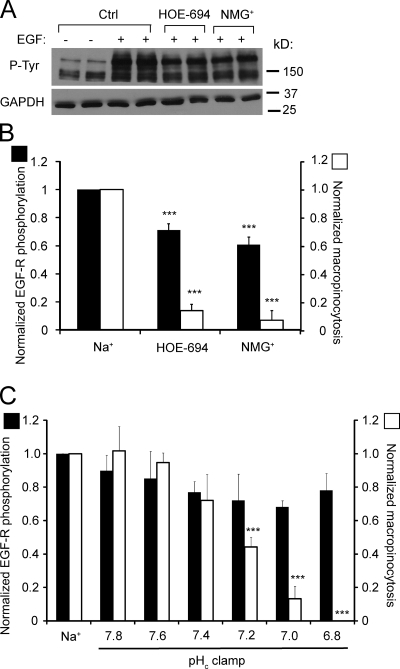
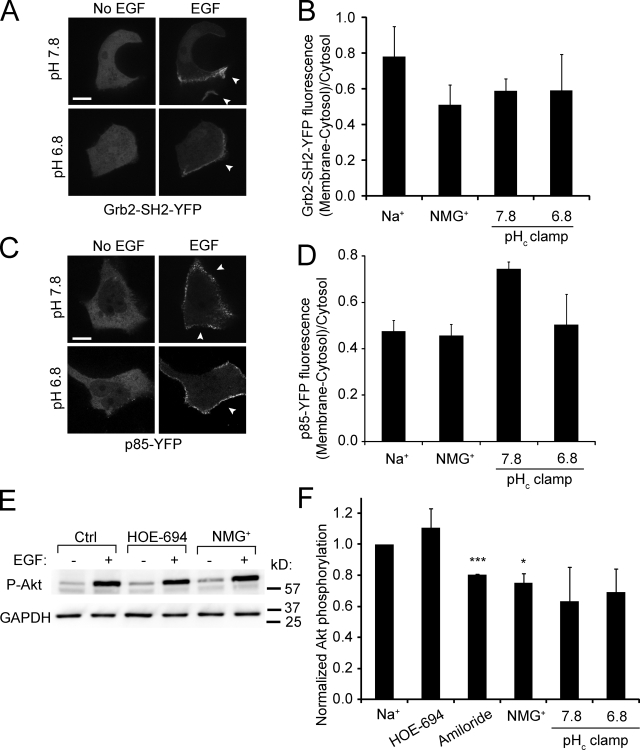
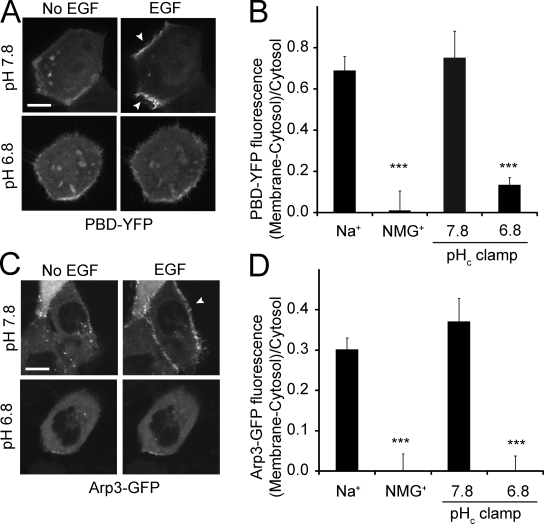
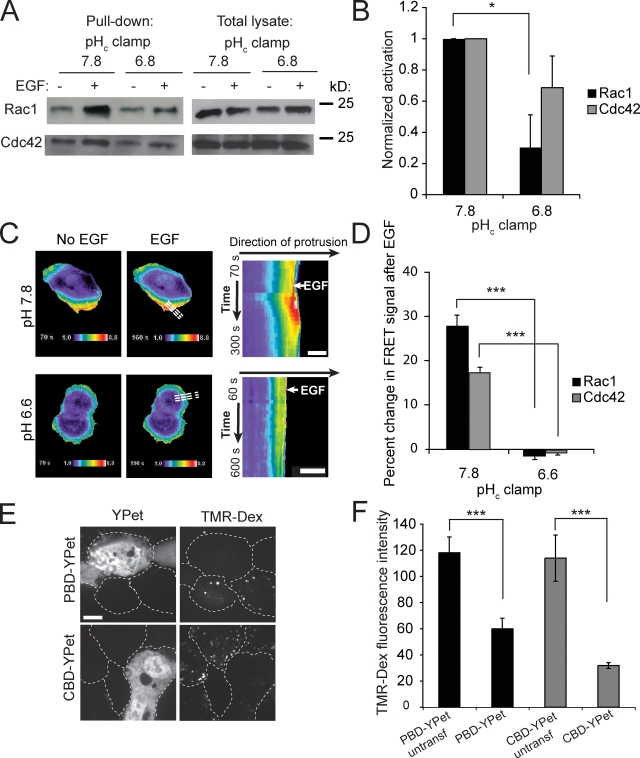
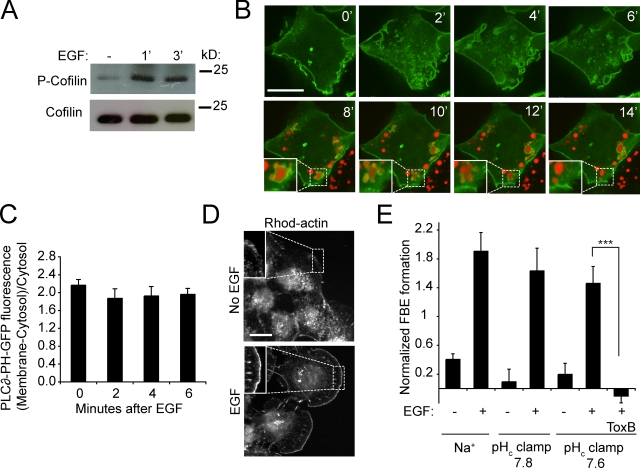
Macropinocytosis is differentiated from other types of endocytosis by its unique susceptibility to inhibitors of Na(+)/H(+) exchange. Yet, the functional relationship between Na(+)/H(+) exchange and macropinosome formation remains obscure. In A431 cells, stimulation by EGF simultaneously activated macropinocytosis and Na(+)/H(+) exchange, elevating cytosolic pH and stimulating Na(+) influx. Remarkably, although inhibition of Na(+)/H(+) exchange by amiloride or HOE-694 obliterated macropinocytosis, neither cytosolic alkalinization nor Na(+) influx were required. Instead, using novel probes of submembranous pH, we detected the accumulation of metabolically generated acid at sites of macropinocytosis, an effect counteracted by Na(+)/H(+) exchange and greatly magnified when amiloride or HOE-694 were present. The acidification observed in the presence of the inhibitors did not alter receptor engagement or phosphorylation, nor did it significantly depress phosphatidylinositol-3-kinase stimulation. However, activation of the GTPases that promote actin remodelling was found to be exquisitely sensitive to the submembranous pH. This sensitivity confers to macropinocytosis its unique susceptibility to inhibitors of Na(+)/H(+) exchange.


Figures

Figure 1.
Figure 1.
Effect of inhibitors on macropinocytosis and NHE activity. (A) DIC (left) and TMR-dextran epifluorescence images (middle) of islands of A431 cells incubated in the absence (Untreated) or presence of EGF as detailed in Materials and methods. Arrowheads point to dextran-filled macropinosomes. After determination of macropinocytosis, cells were fixed and stained with rhodamine-phalloidin to visualize actin (left). Arrowheads point to the aspect of the cell not in contact with neighboring cells. Bar, 10 μm. (B) Quantification of macropinocytosis in control and HOE-694-treated cells. Data are means ± SE of ≥5 separate experiments. (C) Effect of 10 μM HOE-694 on Na+-induced recovery of pHc after an acid load. NHE activity initiated where indicated by reintroduction of Na+. Results are representative of 3–4 similar experiments. (D) Concentration dependence of the effect of HOE-694. NHE activity was measured as in C and rates were calculated from the slopes from Na+-induced pHc recovery curves. Data are means ± SE of three experiments. Where missing, error bars are smaller than symbol.
Figure 2.
Figure 2.
Effect of HOE-694 on EGF-induced changes in pH. (A) SNARF-5F fluorescence ratio measurement of pHc. Where indicated by arrow A431 cells were stimulated with EGF in the absence (Control) or presence of HOE-694. Data are means ± SE of 3–6 experiments. (B) Top: schematic of the structure of membrane-targeted SEpHluorin/mCherry chimaera used to measure pHsm. Bottom: confocal images of SEpHluorin (left) and mCherry fluorescence (right) in A431 cells. Bar, 10 μm. (C) Representative pHsm calibration curve. Cells transfected with membrane-targeted SEpHluorin/mCherry were incubated in the presence of K+/nigericin buffers of predetermined pH. Fluorescence intensities were measured and the ratio of SEpHluorin/mCherry fluorescence is plotted as a function of pH. (D) Comparison of pHc (SNARF5-F and soluble SEpHluorin/mCherry) vs. pHsm (membrane-targeted SEpHluorin/mCherry) in cells treated with EGF for 10 min in Na+ medium in the presence and absence of HOE-694 (10 μM). Data are means ± SE of 3–5 experiments. *, P < 0.05.
Figure 3.
Figure 3.
Effect of Na+ omission on macropinocytosis and pHc. (A) Epifluorescence images of islands of A431 cells after 10 min incubation with TMR-dextran and EGF in the indicated Na+-free media. To clamp pHc (bottom panel), cells were preincubated in K+/nigericin. Bar = 10 μm. (B) Quantification of macropinocytosis in Na+-free solutions. Data are means ± SE of 3–4 experiments. Data were compared with controls in Na+-rich medium (as in Fig. 1 B) and significance calculated using Student’s t test; ***, P < 0.001. (C) Measurement of pHc using SNARF-5F in cells treated with EGF in the indicated buffers. Data are means ± SE of three experiments, each measuring 10 cells.
Figure 4.
Figure 4.
Measurement of macropinocytosis and endocytosis in pHc-clamped cells. (A) The cytosolic pH of A431 cells was clamped at 7.8 or 6.8 with K+/nigericin and TMR-dextran and EGF were added to measure macropinocytosis. After washing, red fluorescence images were acquired. To measure endocytosis, cells were pHc-clamped, incubated with Tfn-A546 for 15 min, acid-washed, fixed, and imaged. Bar, 10 μm. (B) Effect of pH on macropinocytosis and on clathrin-mediated endocytosis. Cells were subjected to pHc clamping and macropinocytosis quantified as in Fig. 1; clathrin-mediated endocytosis was assessed as Tfn-A546 uptake. Data are means ± SE of 3–4 experiments. Data were normalized to pHc 7.8 and the significance of the differences calculated using Student’s t test comparing values within a dataset to pHc 7.8; ***, P < 0.001.
Figure 5.
Figure 5.
Effect of NHE inhibition and of cytosolic pH on EGF receptor autophosphorylation. (A) Immunoblot analysis of tyrosine phosphorylation (P-Tyr) of EGF-R (Mw 170 kD) in A431 cells incubated for 5 min with or without EGF in Na+-rich buffer, with HOE-694 in Na+-rich buffer or in NMG+-rich buffer. Blot is representative of four experiments. (B) Quantitation of the effect of HOE-694 or NMG+ on EGF-R autophosphorylation, obtained by scanning immunoblots like the one in A (black bars). Data are means ± SE of 4–7 experiments. The effect of the same agents/conditions on macropinocytosis is shown for comparison (open bars). (C) Quantification of EGF-R phosphorylation in cells stimulated in Na+-rich medium or clamped with nigericin/K+ at the indicated pH (black bars). Data are means ± SE of 3–4 experiments. Data were normalized to controls in Na+-rich medium; normalized macropinocytosis is shown for comparison (open bars). ***, P < 0.001.
Figure 6.
Figure 6.
EGF-induced recruitment of Grb2 and p85β to the membrane and Akt phosphorylation: effect of Na+ omission and pH. (A) Confocal images of A431 cells transfected with Grb2-SH2-YFP acquired before and after treatment for 5 min with EGF, while clamping pHc at the indicated values with nigericin/K+. (B) Quantification of Grb2-SH2-YFP recruitment to the membrane in response to EGF. Data are means ± SE of 3–4 experiments. (C) Confocal images of cells transfected with p85β-YFP acquired before and after treatment for 5 min with EGF, while clamping pHc at the indicated values using nigericin/K+. Arrowheads in A and C point to membrane surface not in contact with neighboring cells. Bar, 10 μm. (D) Quantification of the extent of p85β-YFP recruitment to the membrane in response to EGF. Data are means ± SE of three separate experiments. (E) Immunoblot of Akt Ser473 phosphorylation (P-Akt) in cells incubated for 5 min with EGF in Na+-rich buffer with or without HOE-694 or in NMG+-rich buffer. GAPDH was probed in the same blots to ensure comparable loading. Blot is representative of 3–4 similar experiments. (F) Quantification of the effect of NHE inhibitors, Na+ omission, and pHc clamping on EGF-induced Akt phosphorylation. Data are means ± SE of ≥3 experiments of each type. *, P < 0.05; ***, P < 0.001.
Figure 7.
Figure 7.
EGF-induced recruitment of PBD-YFP and Arp3-GFP to the membrane: effect of Na+ omission and pH. (A) Confocal images of A431 cells transfected with PBD-YFP acquired before and after treatment for 5 min with EGF, while clamping pHc at indicated values using nigericin/K+. Cells with low levels of expression were selected for this experiment. Arrowheads point to membrane surface not in contact with neighboring cells. Bar, 10 μm. (B) Quantification of PBD-YFP recruitment to the membrane in response to EGF. Data are means ± SE of 3–4 separate experiments. (C) Confocal images of cells transfected with Arp3-GFP acquired before and after treatment for 5 min with EGF, while clamping pHc. (D) Quantification of the extent of Arp3-GFP recruitment to the plasma membrane in response to EGF. Data are means ± SE of 3–4 separate experiments. ***, P < 0.001.
Figure 8.
Figure 8.
Effect of pH on activation of Rac1 and Cdc42. (A) Analysis of activated Rac1 and Cdc42 before and after treatment for 5 min with EGF, while clamping pHc at the indicated values. Active Rac1 and Cdc42 were pulled down using GST-PBD–coated beads. (B) Quantification of the effect of pHc-clamping on EGF-induced Rac1 and Cdc42 activation analyzed by GST-PBD pull-down. Data are means ± SE of three experiments. Data were compared between pHc 7.8 and pHc 6.8; *, P < 0.05. (C) Assessment of Rac1 activation by FRET imaging of genetically encoded biosensors. Activation of Rac1 was measured by FRET as detailed in Materials and methods before and after treatment with EGF, while clamping pH at pHc 6.6 or pHc 7.8. Dashed lines in whole-cell images (middle) align with the direction of protrusion and indicate the area selected for kymography and line-scan analysis (right). Bar, 10 μm. (D) Quantification of Rac1 and Cdc42 activation analyzed by FRET using line-scan analysis of the regions studied by kymography as in A. Data are means ± SE of three experiments analyzing 6–8 cells in each; ***, P < 0.001. (E) Effect of overexpression or PBD-YPet or CBD-YPet on macropinocytosis. Confocal images of cells transfected with PBD-YPet or CBD-YPet (left) incubated with EGF and TMR-Dextran (right) for 10 min in Na+-rich medium to assess macropinocytosis. Dashed lines indicate outlines of cells. Bar, 10 μm. (F) Quantification of macropinocytosis in untransfected or in highly transfected cells by measuring TMR-Dextran fluorescence intensity (right). Data are means ± SE of three experiments. Data were compared between untransfected and transfected cells; ***, P < 0.001.
Figure 9.
Figure 9.
Cofilin phosphorylation, PI(4,5)P2 hydrolysis, and actin FBE formation. (A) Analysis of cofilin phosphorylation from lysates of A431 cells before and after treatment for 1 or 3 min with EGF in Na+-rich buffer. Blot is representative of three experiments. (B) Assessment of PI(4,5)P2 hydrolysis during EGF stimulation. PI(4,5)P2 was monitored using PLC∂-PH-GFP and confocal imaging. Recording was initiated upon addition of EGF and TMR-dextran in Na+-rich buffer. During the initial 6 min, only green fluorescence was monitored. After 6 min excess TMR-dextran was washed and formed macropinosomes were visualized in red channel. Insets show magnifications of indicated areas. (C) Quantification of PLC∂-PH-GFP localization to the plasma membrane during EGF stimulation. Data are means ± SE of three separate experiments. (D) Detection of actin FBEs by imaging rhodamine-actin in cells before and after treatment for 1 min with EGF in Na+-rich buffer. Images are representative of three experiments. Insets show regions at the edge of cells typically selected for quantification. (E) Quantification of FBE cells before and after treatment with EGF in Na+-rich buffer or in pHc clamping medium. Data are means ± SE of three separate experiments. The significance of the difference ± C. difficile toxin B (Tox B) was calculated using Student’s t test; ***, P < 0.001.

References

    1. Alvarez de la Rosa D., Canessa C.M., Fyfe G.K., Zhang P. 2000. Structure and regulation of amiloride-sensitive sodium channels. Annu. Rev. Physiol. 62:573–594 10.1146/annurev.physiol.62.1.573 - DOI - PubMed
    1. Amyere M., Payrastre B., Krause U., Van Der Smissen P., Veithen A., Courtoy P.J. 2000. Constitutive macropinocytosis in oncogene-transformed fibroblasts depends on sequential permanent activation of phosphoinositide 3-kinase and phospholipase C. Mol. Biol. Cell. 11:3453–3467 - PMC - PubMed
    1. Amyere M., Mettlen M., Van Der Smissen P., Platek A., Payrastre B., Veithen A., Courtoy P.J. 2002. Origin, originality, functions, subversions and molecular signalling of macropinocytosis. Int. J. Med. Microbiol. 291:487–494 10.1078/1438-4221-00157 - DOI - PubMed
    1. Araki N., Johnson M.T., Swanson J.A. 1996. A role for phosphoinositide 3-kinase in the completion of macropinocytosis and phagocytosis by macrophages. J. Cell Biol. 135:1249–1260 10.1083/jcb.135.5.1249 - DOI - PMC - PubMed
    1. Araki N., Egami Y., Watanabe Y., Hatae T. 2007. Phosphoinositide metabolism during membrane ruffling and macropinosome formation in EGF-stimulated A431 cells. Exp. Cell Res. 313:1496–1507 10.1016/j.yexcr.2007年02月01日2 - DOI - PubMed

Publication types

MeSH terms

Cite

AltStyle によって変換されたページ (->オリジナル) /