Remote sensing, geographical information system and spatial analysis for schistosomiasis epidemiology and ecology in Africa
- PMID: 19627627
- PMCID: PMC2789293
- DOI: 10.1017/S0031182009006222
Remote sensing, geographical information system and spatial analysis for schistosomiasis epidemiology and ecology in Africa
Abstract
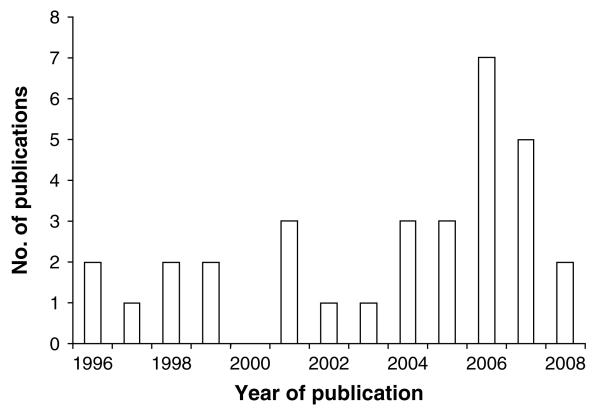
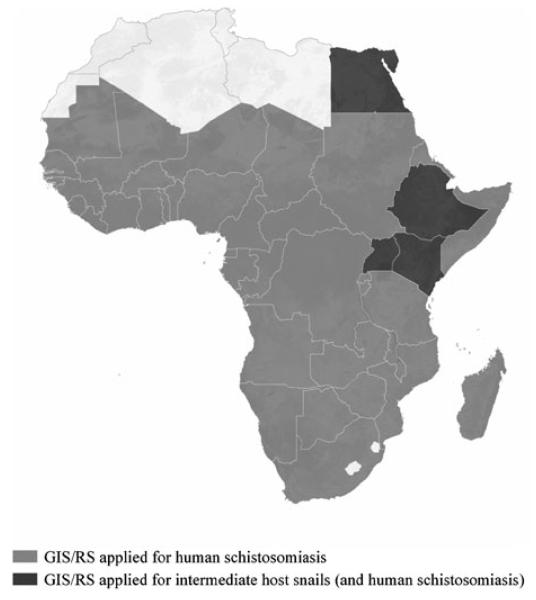
Beginning in 1970, the potential of remote sensing (RS) techniques, coupled with geographical information systems (GIS), to improve our understanding of the epidemiology and control of schistosomiasis in Africa, has steadily grown. In our current review, working definitions of RS, GIS and spatial analysis are given, and applications made to date with RS and GIS for the epidemiology and ecology of schistosomiasis in Africa are summarised. Progress has been made in mapping the prevalence of infection in humans and the distribution of intermediate host snails. More recently, Bayesian geostatistical modelling approaches have been utilized for predicting the prevalence and intensity of infection at different scales. However, a number of challenges remain; hence new research is needed to overcome these limitations. First, greater spatial and temporal resolution seems important to improve risk mapping and understanding of transmission dynamics at the local scale. Second, more realistic risk profiling can be achieved by taking into account information on people's socio-economic status; furthermore, future efforts should incorporate data on domestic access to clean water and adequate sanitation, as well as behavioural and educational issues. Third, high-quality data on intermediate host snail distribution should facilitate validation of infection risk maps and modelling transmission dynamics. Finally, more emphasis should be placed on risk mapping and prediction of multiple species parasitic infections in an effort to integrate disease risk mapping and to enhance the cost-effectiveness of their control.
Figures
References
-
- Abdel-Rahman MS, El-Bahy MM, Malone JB, Thompson NM, El-Bahy NM. Geographical information systems as a tool for control program management for schistosomiasis in Egypt. Acta Tropica. 2001;79:49–57. - PubMed
-
- Appleton CC. Review of literature on abiotic factors influencing the distribution and life-cycles of bilharziasis intermediate host snails. Malacological Review. 1978;11:1–25.
-
- Arinola O, Arinola A, Ojewale S. Control of urinary schistosomiasis in Nigeria. World Health Forum. 1996;17:291–292. - PubMed
-
- Bailey TC, Gatrell AC. Interactive Spatial Data Analysis. Addison-Wesley; Reading, MA, USA: 1995. - PubMed
-
- Beck-Wörner C, Raso G, Vounatsou P, N'Goran EK, Rigo G, Parlow E, Utzinger J. Bayesian spatial risk prediction of Schistosoma mansoni infection in western Côte d'Ivoire using a remotely-sensed digital elevation model. American Journal of Tropical Medicine and Hygiene. 2007;76:956–963. - PubMed
Publication types
MeSH terms
Grants and funding
LinkOut - more resources
Full Text Sources
Research Materials