This site needs JavaScript to work properly. Please enable it to take advantage of the complete set of features!
Skip to main page content
U.S. flag

An official website of the United States government

Dot gov

The .gov means it’s official.
Federal government websites often end in .gov or .mil. Before sharing sensitive information, make sure you’re on a federal government site.

Https

The site is secure.
The https:// ensures that you are connecting to the official website and that any information you provide is encrypted and transmitted securely.

NIH NLM Logo
Log in
Access keys NCBI Homepage MyNCBI Homepage Main Content Main Navigation
doi: 10.1186/1475-2875-7-77.

Temporal correlation between malaria and rainfall in Sri Lanka

Affiliations

Temporal correlation between malaria and rainfall in Sri Lanka

Olivier J T Briët et al. Malar J. .

Abstract

Background: Rainfall data have potential use for malaria prediction. However, the relationship between rainfall and the number of malaria cases is indirect and complex.

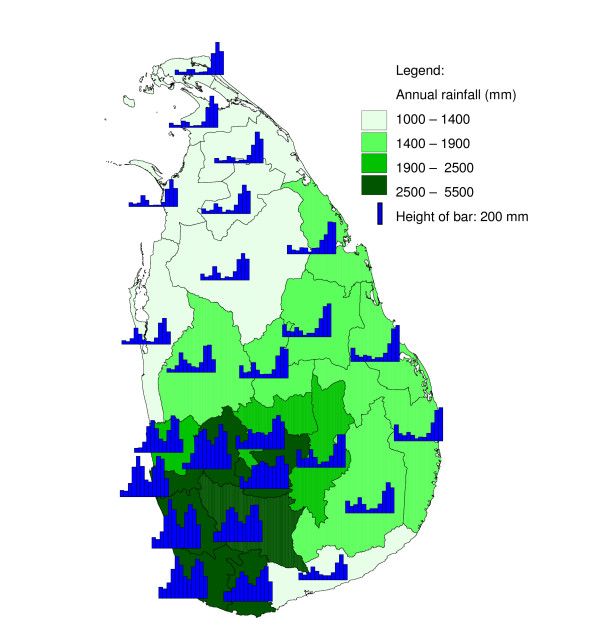
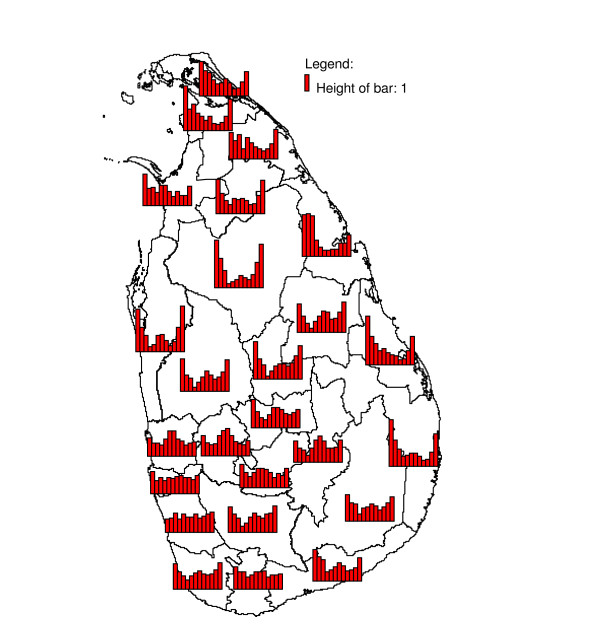
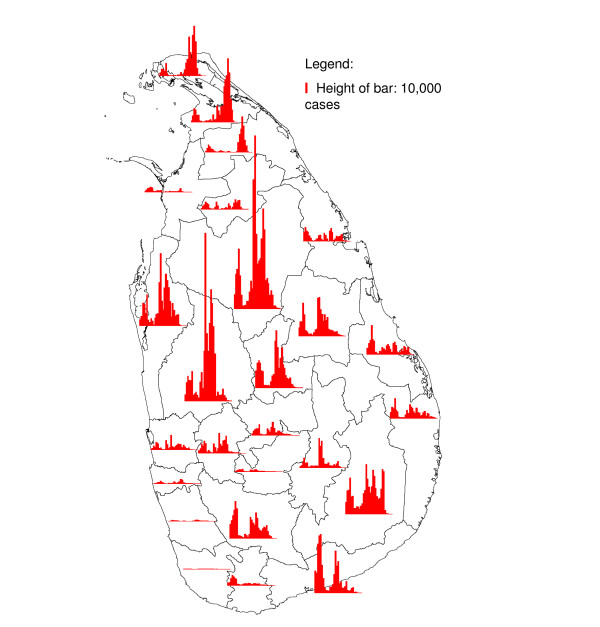
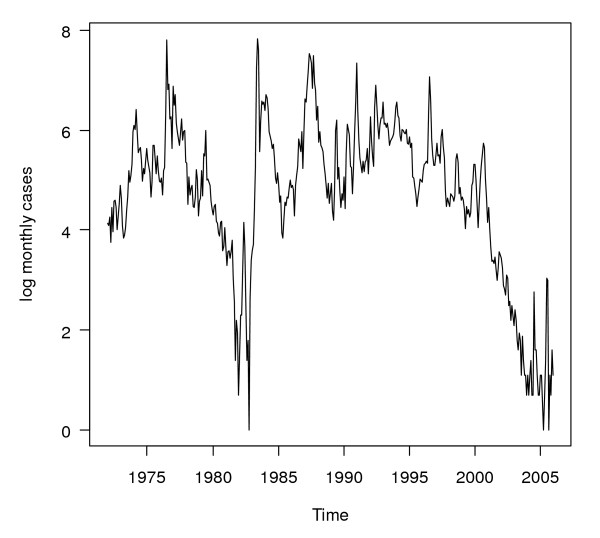
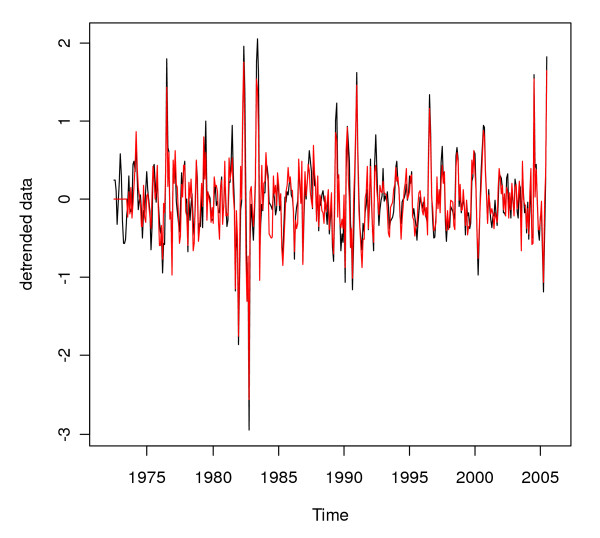
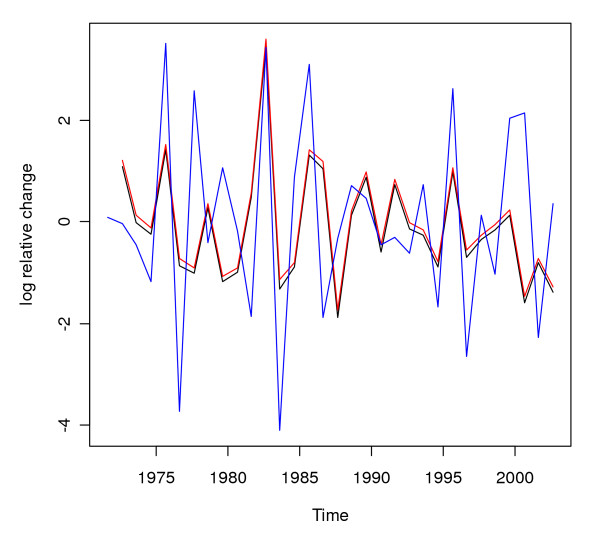
Methods: The statistical relationships between monthly malaria case count data series and monthly mean rainfall series (extracted from interpolated station data) over the period 1972 - 2005 in districts in Sri Lanka was explored in four analyses: cross-correlation; cross-correlation with pre-whitening; inter-annual; and seasonal inter-annual regression.

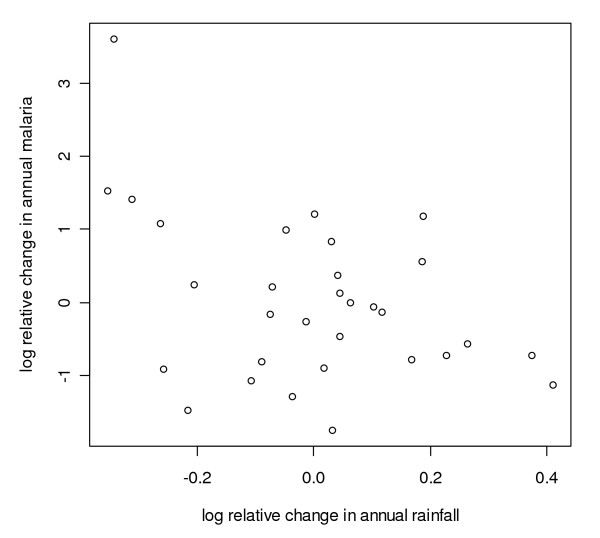
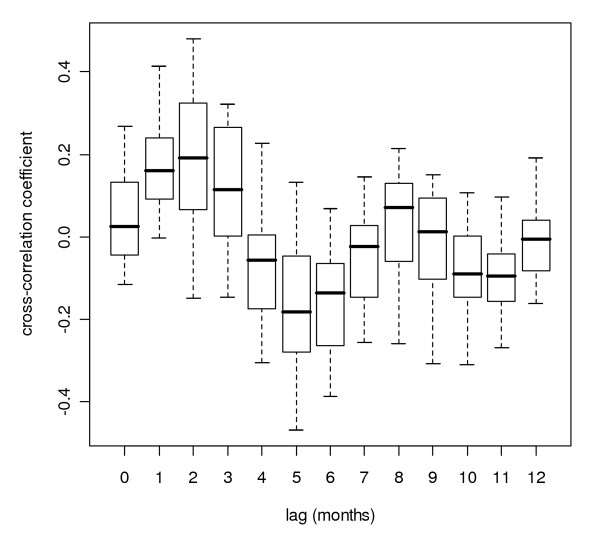
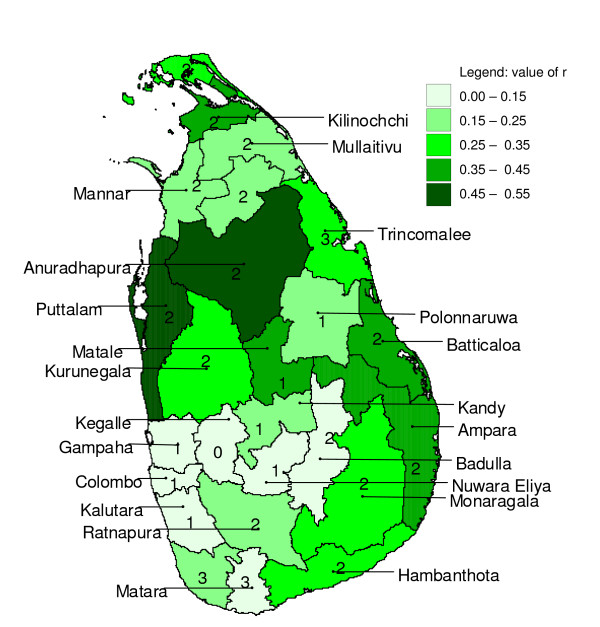
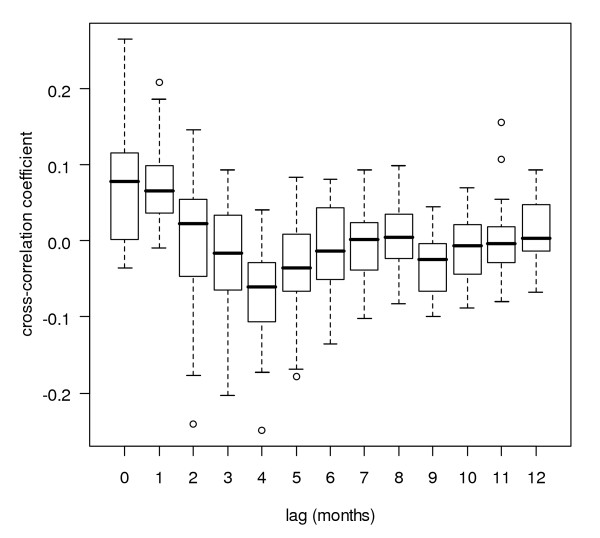
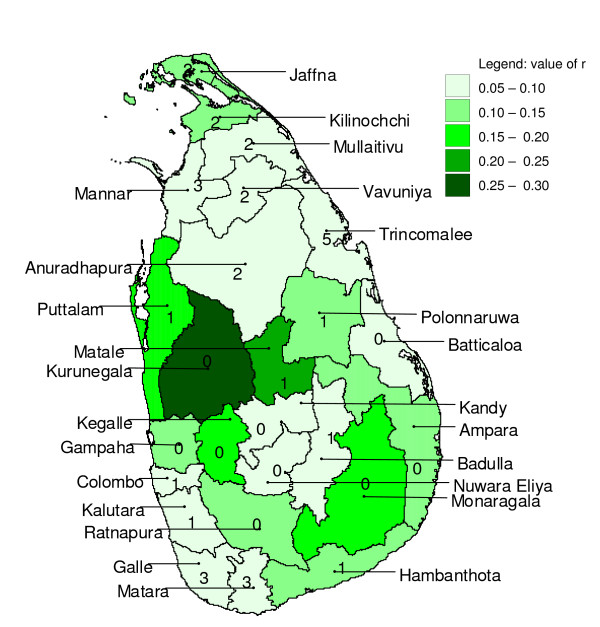
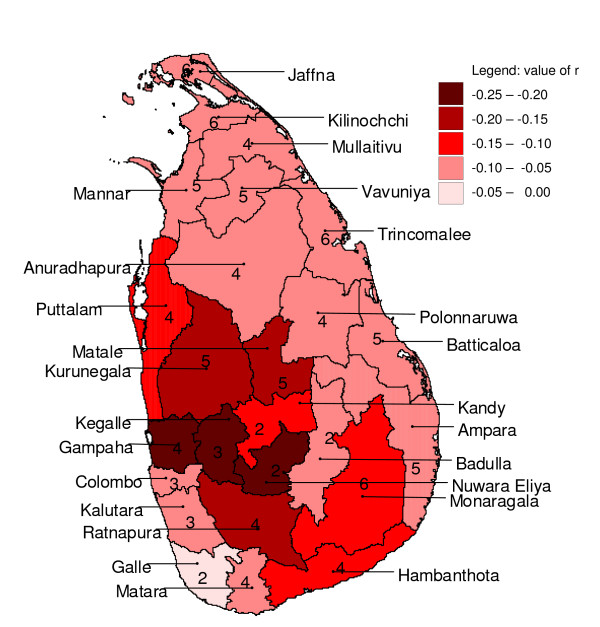
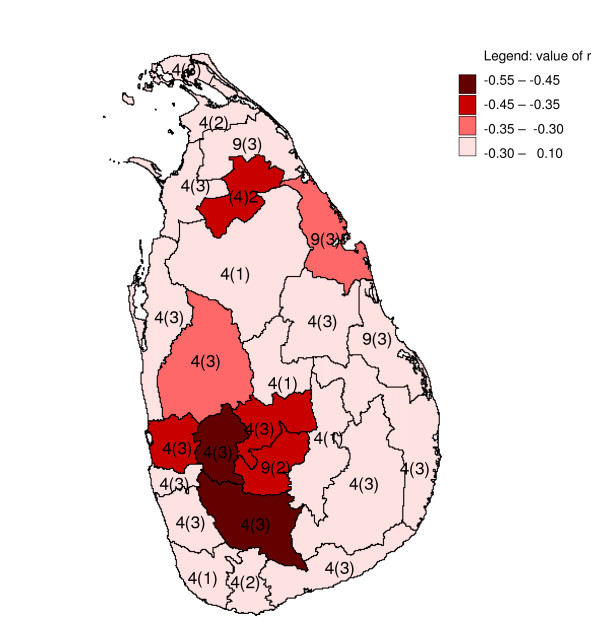
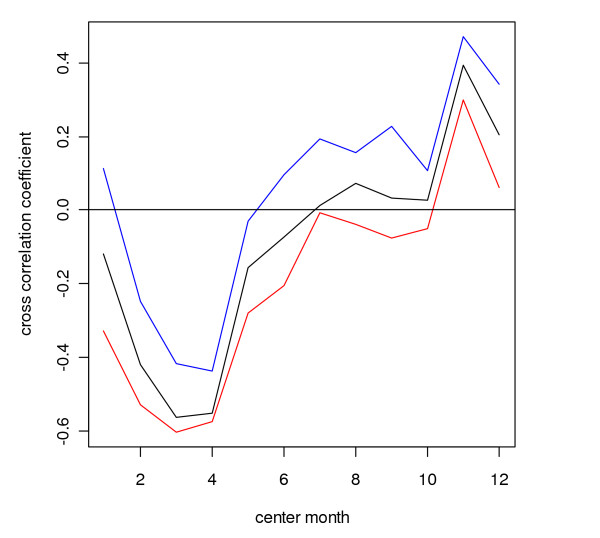
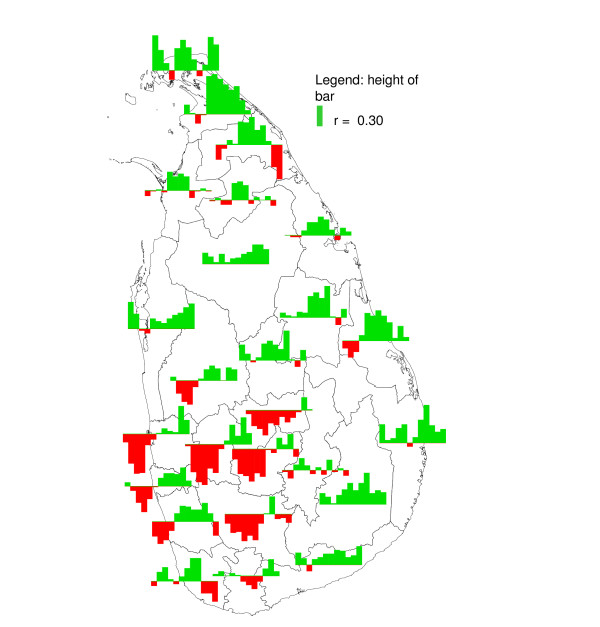
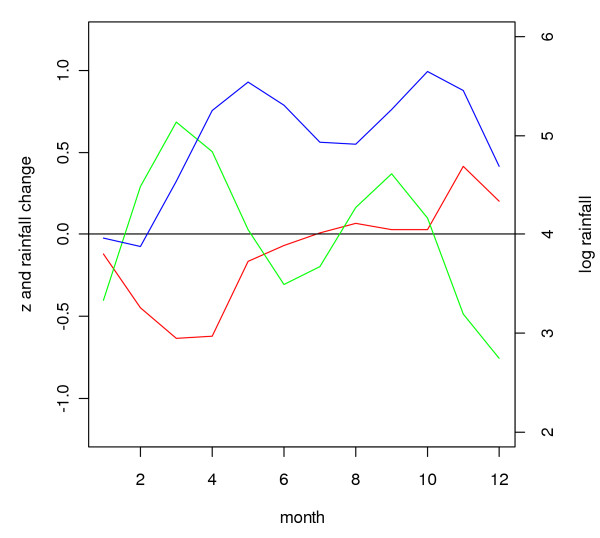
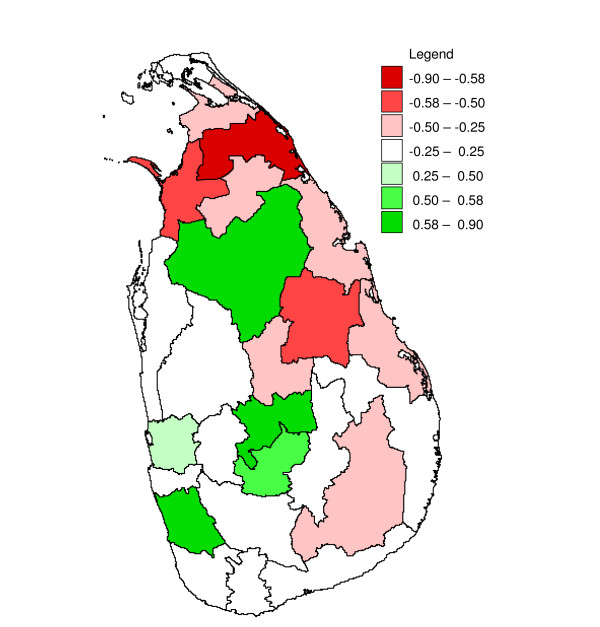
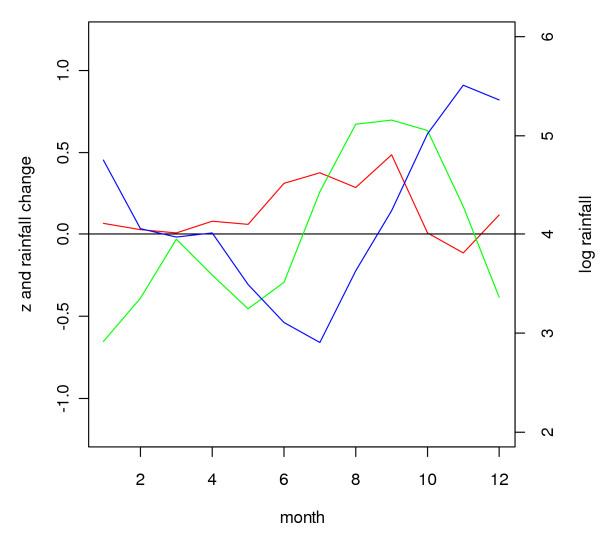
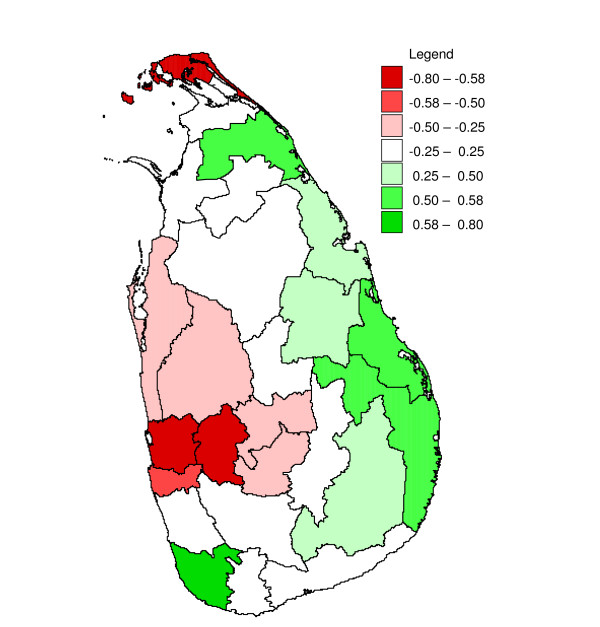
Results: For most districts, strong positive correlations were found for malaria time series lagging zero to three months behind rainfall, and negative correlations were found for malaria time series lagging four to nine months behind rainfall. However, analysis with pre-whitening showed that most of these correlations were spurious. Only for a few districts, weak positive (at lags zero and one) or weak negative (at lags two to six) correlations were found in pre-whitened series. Inter-annual analysis showed strong negative correlations between malaria and rainfall for a group of districts in the centre-west of the country. Seasonal inter-annual analysis showed that the effect of rainfall on malaria varied according to the season and geography.

Conclusion: Seasonally varying effects of rainfall on malaria case counts may explain weak overall cross-correlations found in pre-whitened series, and should be taken into account in malaria predictive models making use of rainfall as a covariate.


Figures

Figure 1
Figure 1
Geometric mean seasonality and annual geometric mean total of rainfall. Geometric mean monthly rainfall from January (bar on far left) to December (bar on far right), calculated over the period January 1971 to December 2005, and the total geometric mean annual rainfall in districts of Sri Lanka. The height of the bar in the legend represents 200 mm. The classification of the annual rainfall follows the common delineation into a wet zone (>2500 mm per annum), intermediate zone, and a dry (<1900 mm per annum) zone, with a "very dry" category for rainfall <1400 mm per annum.
Figure 2
Figure 2
Geometric mean seasonality of detrended malaria cases. Geometric mean monthly number of malaria cases from January (bar on far left) to December (bar on far right), calculated over the period January 1972 to December 2005, after detrending, in districts of Sri Lanka. The height of the bar in the legend represents 1, (because of detrending, no unit is given).
Figure 3
Figure 3
Annual malaria cases. Annual number of malaria positive cases from 1972 (bar on far right) to 2006 (bar on for left) in districts in Sri Lanka. The height of the bar in the legend represents 10,000 cases.
Figure 4
Figure 4
Logarithmically transformed monthly malaria case counts for Gampaha District. Logarithmically transformed monthly malaria case counts (after adding the value 1 to all data) for Gampaha District.
Figure 5
Figure 5
Detrended (pre-whitened) logarithmically transformed monthly malaria case counts for Gampaha District. Detrended logarithmically transformed monthly malaria case counts (black line) and pre-whitened detrended logarithmically transformed monthly malaria case counts (red line) for Gampaha District.
Figure 6
Figure 6
Differenced logarithmically transformed annual malaria case counts and rainfall for Gampaha District. Differenced logarithmically transformed annual (the twelve month period starting in April) malaria case counts (black line), malaria case counts with first order auto correlation removed (red line), and the differenced logarithmically transformed annual rainfall with a three month lag shift (the twelve month period starting in January), corrected for autocorrelation in malaria and multiplied by -10 (blue line) for Gampaha District.
Figure 7
Figure 7
Scatter plot of differenced logarithmically transformed annual malaria case counts and rainfall for Gampaha District. Scatter plot of differenced logarithmically transformed annual (the twelve month period starting in April) malaria case counts with first order auto correlation removed against differenced logarithmically transformed annual (the twelve month period starting in January) rainfall corrected for first order auto correlation in malaria for Gampaha District.
Figure 8
Figure 8
Cross-correlation box plot. Box plot of Pearson product-moment correlation coefficients of time series of logarithmically transformed monthly rainfall and (detrended) monthly logarithmically transformed malaria case time series at several lags for districts in Sri Lanka, grouped by lag distance.
Figure 9
Figure 9
Mapped maximum cross-correlation coefficients. Mapped maximum cross-correlation coefficients for logarithmically transformed monthly rainfall preceding (detrended) logarithmically transformed monthly malaria case time series with zero to twelve months for districts in Sri Lanka. Numbers indicate the lag (in months) for which the maximum occurred.
Figure 10
Figure 10
Cross-correlation box plot after pre-whitening (rainfall log-transformed). Box plot of Pearson product-moment correlation coefficients of pre-whitened series of logarithmically transformed monthly rainfall and (detrended) monthly malaria case time series at several lags for districts in Sri Lanka, grouped by lag distance.
Figure 11
Figure 11
Mapped maximum cross-correlation coefficients after pre-whitening. Mapped maximum cross-correlation coefficients for logarithmically transformed rainfall preceding (detrended) logarithmically transformed malaria case time series with zero to twelve months for districts in Sri Lanka, after pre-whitening. Numbers indicate the lag (in months) for which the maximum occurred.
Figure 12
Figure 12
Mapped minimum cross-correlation coefficients after pre-whitening. Mapped minimum cross-correlation coefficients for logarithmically transformed monthly rainfall preceding (detrended) logarithmically transformed monthly malaria case time series with zero to twelve months for districts in Sri Lanka, after pre-whitening. Numbers indicate the lag (in months) for which the maximum occurred.
Figure 13
Figure 13
Mapped minimum inter-annual cross-correlation coefficients. Mapped minimum cross-correlation coefficients for logarithmically transformed annual rainfall preceding differenced logarithmically transformed annual malaria case time series (with first order auto correlation removed (see methods)), with one to three months for districts in Sri Lanka. Numbers indicate the starting month of the year (4 = April, 9 = November) and between brackets the lag (in months) for which the minimum occurred.
Figure 14
Figure 14
Cross-correlation coefficients for each rainfall month with malaria lagging one to three months behind for the district of Gampaha. Cross-correlation coefficients for logarithmically transformed three-monthly rainfall (differenced with the logarithmically transformed rainfall in the preceding twelve months) with logarithmically transformed three-monthly number of malaria cases (differenced with the logarithmically transformed number of malaria in the preceding twelve months), after removing first order auto correlation (see methods)), with the malaria series lagging one (blue line), two (black line) and three (red line) months behind the rainfall series, for the districts of Gampaha in Sri Lanka. The time scale on the horizontal axis reflects the centre month for three rainfall months.
Figure 15
Figure 15
Mapped seasonal cross-correlation coefficients for malaria lagging two months behind rainfall. Mapped cross-correlation coefficients for logarithmically transformed three-monthly rainfall (differenced with the logarithmically transformed rainfall in the preceding twelve months) with logarithmically transformed three-monthly number of malaria cases (differenced with the logarithmically transformed number of malaria in the preceding twelve months), after removing first order auto correlation (see methods)), with the malaria series lagging two months behind the rainfall series, for districts in Sri Lanka. The bar on the far left represents January as the centre month of a three months rainfall period; the bar on the far right represents December. Red bars represent negative correlation, blue bars represent positive correlation.
Figure 16
Figure 16
Correlation coefficients and rainfall for Gampaha District. Three month centred moving average of logarithmically transformed geometric mean monthly rainfall (in mm per month, calculated over the period January 1971 to December 2005) (blue line on right vertical axis), its derivative representing logarithmically transformed rainfall change per month (green line on left vertical axis) and the Fisher transformed correlation coefficient (red line on left vertical axis) between malaria and rainfall at a lag of two months, found in seasonal inter-annual analysis (see methods) for Gampaha District.
Figure 17
Figure 17
Correlation between correlation coefficients and rainfall for districts in Sri Lanka. Mapped correlation coefficient between the Fisher transformed correlation coefficient between malaria and rainfall found in seasonal inter-annual analysis at a lag of two months, (see methods) and a three month centred moving average of logarithmically transformed geometric mean monthly rainfall (in mm per month, calculated over the period January 1971 to December 2005) for districts in Sri Lanka
Figure 18
Figure 18
Correlation coefficients and rainfall for Polonnaruwa District. Three month centred moving average of logarithmically transformed geometric mean monthly rainfall (originally in mm per month, calculated over the period January 1971 to December 2005) (blue line on right vertical axis), its derivative representing change in logarithmically transformed rainfall per month (green line on left vertical axis) and the Fisher transformed correlation coefficient (red line on left vertical axis) between malaria and rainfall at a lag of two months, found in seasonal inter-annual analysis (see methods) for Polonnaruwa District.
Figure 19
Figure 19
Correlation between correlation coefficients and change in rainfall for districts in Sri Lanka. Mapped correlation coefficient between the Fisher transformed correlation coefficient between malaria and rainfall found in seasonal inter-annual analysis at a lag of two months, (see methods) and monthly change in a three month centred moving average of logarithmically transformed geometric mean monthly rainfall (originally in mm per month, calculated over the period January 1971 to December 2005) for districts in Sri Lanka

References

    1. Teklehaimanot HD, Lipsitch M, Teklehaimanot A, Schwartz J. Weather-based prediction of Plasmodium falciparum malaria in epidemic-prone regions of Ethiopia I. Patterns of lagged weather effects reflect biological mechanisms. Malar J. 2004;3:41. doi: 10.1186/1475-2875-3-41. - DOI - PMC - PubMed
    1. Worrall E, Connor SJ, Thomson MC. A model to simulate the impact of timing, coverage and transmission intensity on the effectiveness of indoor residual spraying (IRS) for malaria control. Trop Med Int Health. 2007;12:75–88. - PubMed
    1. Craig MH, Kleinschmidt I, Nawn JB, Le Sueur D, Sharp BL. Exploring 30 years of malaria case data in KwaZulu-Natal, South Africa: part I. The impact of climatic factors. Trop Med Int Health. 2004;9:1247–1257. doi: 10.1111/j.1365-3156.2004.01340.x. - DOI - PubMed
    1. Clemesha WW. Brief account of the natural history of malaria in Ceylon. Ceylon J Sci. 1934;3:157–172.
    1. Gill CA. Some points in the epidemiology of malaria arising out of the study of the malaria epidemic in Ceylon in 1934-35. Trans R Soc Trop Med Hyg. 1936;29:427–466. doi: 10.1016/S0035-9203(36)90001-9. - DOI

Publication types

Cite

AltStyle によって変換されたページ (->オリジナル) /