This site needs JavaScript to work properly. Please enable it to take advantage of the complete set of features!
Skip to main page content
U.S. flag

An official website of the United States government

Dot gov

The .gov means it’s official.
Federal government websites often end in .gov or .mil. Before sharing sensitive information, make sure you’re on a federal government site.

Https

The site is secure.
The https:// ensures that you are connecting to the official website and that any information you provide is encrypted and transmitted securely.

NIH NLM Logo
Log in
Access keys NCBI Homepage MyNCBI Homepage Main Content Main Navigation
. 2006 Jun;60(5):1136-51.
doi: 10.1111/j.1365-2958.2006.05172.x.

Sex and virulence in Escherichia coli: an evolutionary perspective

Affiliations

Sex and virulence in Escherichia coli: an evolutionary perspective

Thierry Wirth et al. Mol Microbiol. 2006 Jun.

Abstract

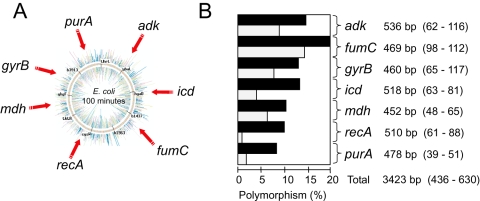
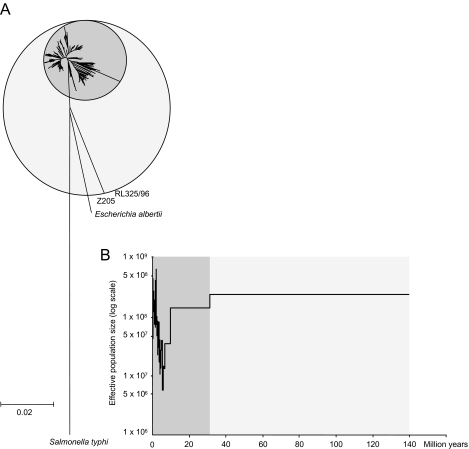
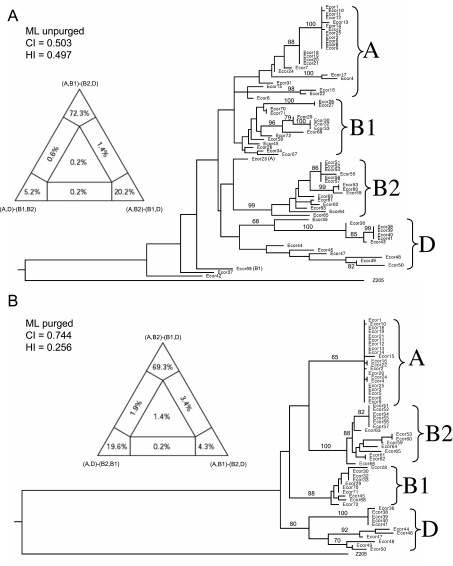
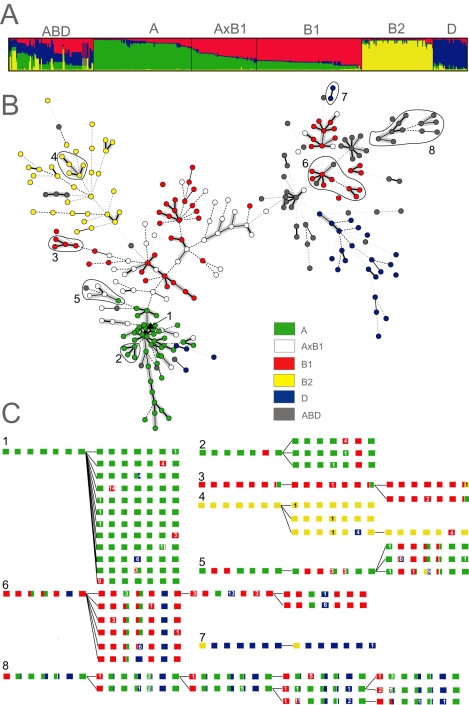
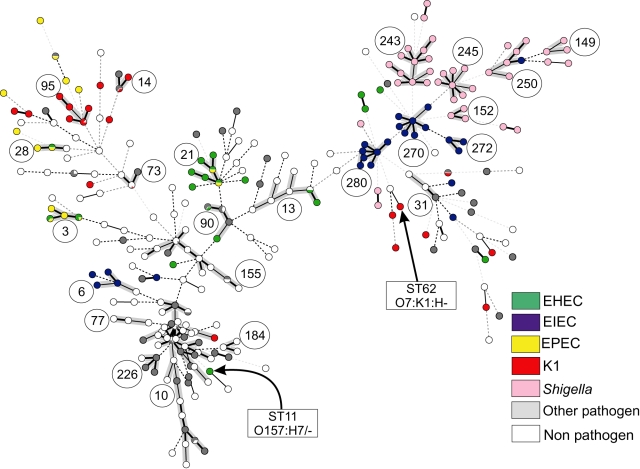
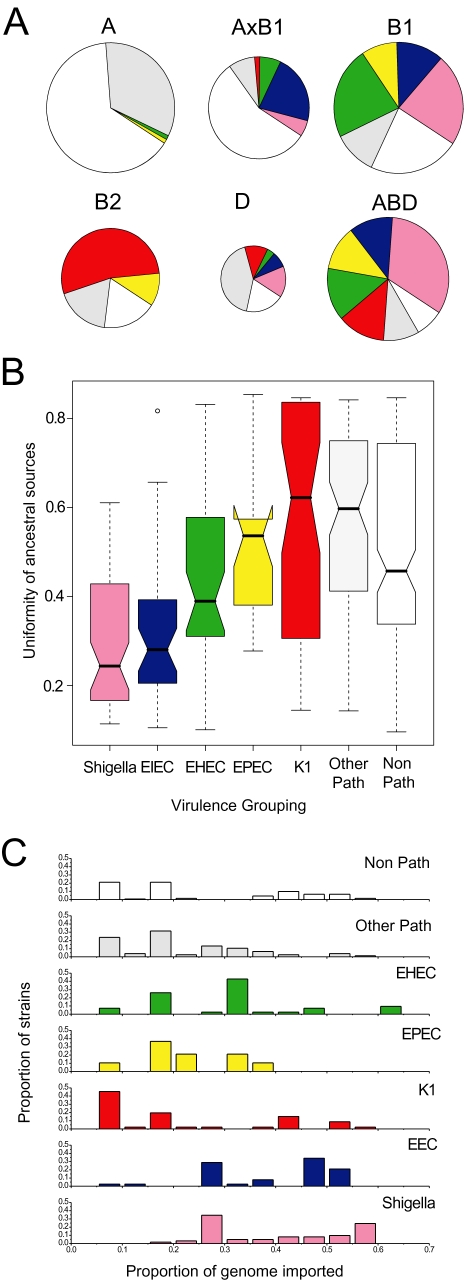
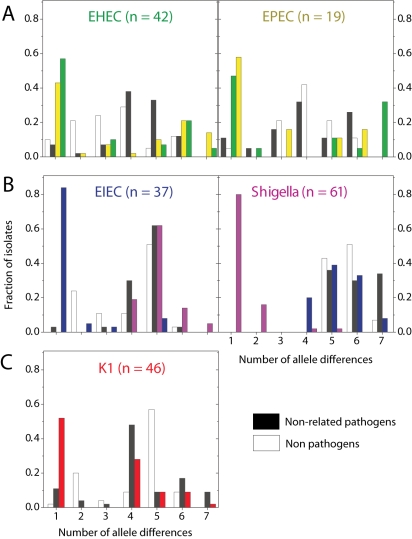
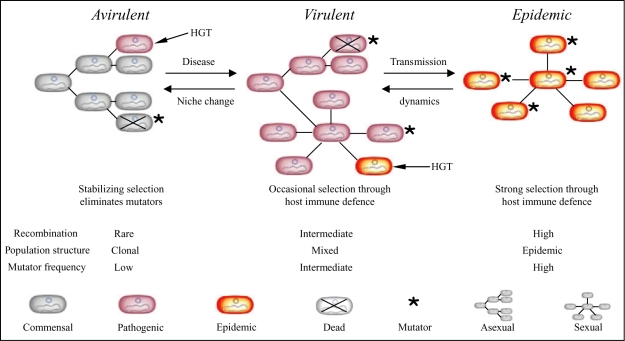
Pathogenic Escherichia coli cause over 160 million cases of dysentery and one million deaths per year, whereas non-pathogenic E. coli constitute part of the normal intestinal flora of healthy mammals and birds. The evolutionary pathways underlying this dichotomy in bacterial lifestyle were investigated by multilocus sequence typing of a global collection of isolates. Specific pathogen types [enterohaemorrhagic E. coli, enteropathogenic E. coli, enteroinvasive E. coli, K1 and Shigella] have arisen independently and repeatedly in several lineages, whereas other lineages contain only few pathogens. Rates of evolution have accelerated in pathogenic lineages, culminating in highly virulent organisms whose genomic contents are altered frequently by increased rates of homologous recombination; thus, the evolution of virulence is linked to bacterial sex. This long-term pattern of evolution was observed in genes distributed throughout the genome, and thereby is the likely result of episodic selection for strains that can escape the host immune response.


Figures

Fig. 1
Fig. 1
(A) Genomic locations and (B) genetic diversity of seven housekeeping genes. (B) Polymorphism levels for each gene are indicated in the histogram in which black bars reflect nucleotide polymorphisms and grey bars indicate amino-acid polymorphisms. Each gene symbol is followed by the length of the sequenced gene fragment (informative sites – polymorphic sites).
Fig. 2
Fig. 2. Diversity and population size within E. coli.
A. Neighbour-joining (NJ) tree of 462 E. coli, three E. albertii and one Salmonella typhi (outgroup) based on concatenated sequences from the seven loci using pairwise genetic distances based on the GTR+G+I evolutionary model. The dark grey circle represents the main group of 460 isolates within E. coli whereas the light grey circle also encompasses the two divergent isolates. B. Generalized skyline plot showing changes in effective E. coli population size over the last 140 million years. The ultrametric tree used was a UPGMA tree calculated from the genetic distances in part A and calibrated to a molecular clock rate of 7.6 ×ばつ 10−10 per year.
Fig. 3
Fig. 3
Phylogenies of concatenated sequences from the ECOR collection. Left: Four-cluster likelihood mapping analysis (TREE-PUZZLE) represented as triangles showing likelihood supports for each of three alternative topologies (at tips of diagram), as well as support for unresolved quartets (centre) and for partly resolved quartets (edges). Right: Heuristic maximum likelihood trees based on neighbour-joining (NJ) starting trees with NNI branch swapping. The group labels reflect the original groupings based on MLEE and the numbers at the nodes are bootstrap confidence values above 70%. A. Original sequences. ML settings = GTR+G+I; G = 0.4846; I = 0.8042. B. Sequences purged of recombinant sites. ML settings = GTR+G+I; G = 0.7066; I = 0.7245. CI, Consistency index; HI, Homoplasy index.
Fig. 4
Fig. 4. Ancestry of 460 E. coli isolates.
A. Proportions of ancestry from groups A, B1, B2 and D as inferred by STRUCTURE and their assignment to six groups as displayed with DISTRUCT (Rosenberg, 2004). The plot shows one vertical line for each isolate indicating the proportions of ancestry from the four groups, colour-coded as in part B. B. Distribution of A, B1, B2, D, AxB1 and ABD within a minimal spanning tree (MSTREE) of 275 E. coli STs based on the degree of allele sharing. Dots are coloured according to group and lines connecting ST complexes (see Fig. 6) are shaded in grey. Clades that are illustrated in greater detail in part c are indicated by numbers and encircled by lines. C. Details of microevolution within eight selected clades. The branch order within each clade and the ancestral ST were taken from the MSTREE. Boxes are colour-coded as in panel B and indicate stretches of nucleotides that are derived from the four ancestral groups A, B1, B2 and D within each of the seven loci, shown in the order: adk, fumC, gyrB, icd, mdh, purA and recA. Numbers in contrasting colours indicate the numbers of nucleotides that differ from the allele that was previously present.
Fig. 6
Fig. 6
Pathogenic types within an MSTREE. Each ST is represented by a dot. Dots with uniform colours indicate that all isolates were of the same pathogen type (see legend) while the small pie charts indicate the fraction of isolates belonging to each pathogen type. Circled numbers indicate ST complexes, whereas arrows indicate STs 11 and 62. Black lines connecting pairs of STs indicate that they share six (thick lines), five (thin) or four alleles (dotted). Grey, dotted lines connecting pairs of STs of increasing line length indicate that they share three to one alleles respectively. In addition, the lines connecting the STs within an ST complex are shaded in grey.
Fig. 5
Fig. 5. Sources of ancestry versus pathogenicity.
A. Proportion of pathogens per group. The six groups are represented by circles whose areas are proportional to the numbers of isolates. Arcs are colour-coded as in panel B and indicate the frequencies of pathogen types. B. Notched box and whisker plots of the uniformity of ancestral sources by pathogen group. Within each plot, the central box indicates the two central quartiles, separated by a horizontal line indicating the median value. The 95% confidence limits of the median are indicated by a notch; pairs of boxes whose notches do not overlap possess significantly different median values (P < 0.05). Lines above and below each box indicate the upper and lower quartiles, and outliers are indicated by small circles. Uniformity was calculated for each strain as the sum of its squared ancestries from the A, B1, B2 and D groups according to STRUCTURE, which ranges from 0.25 to 1.0, followed by normalization to a range from 0 to 1. C. Frequency of isolates versus proportion of genome that has been imported from other groups by pathogen type. For each strain, the proportion of imported DNA was estimated conservatively by subtracting its maximal ancestry from any single group (A, B1, B2 or D) from 1.0. Other Path: other pathogens; Non-Path: non-pathogens.
Fig. 7
Fig. 7
Allele sharing between pathogen types. Histograms show the distributions of the number of allele differences between strains from a given pathogen group to other strains from different STs, colour-coded by class: same pathogen group (colour of label), related pathogen group (colour of label in neighbouring plot), different pathogen group (black) and non-pathogens (white).
Fig. 8
Fig. 8
Model of evolutionary mechanisms that link sex and virulence. Virulence determinants are assumed to be introduced initially to a species by HGT, indicated by short arrows. We deduce that (at least) two events are needed to convert an ancestral avirulent and commensal group of bacteria to virulent, pathogenic organisms and then to highly virulent organisms that cause epidemic disease. Within each population, mutators arise at low frequencies by random mutations. Mutator strains are eliminated due to their lower fitness (crosses), and are only transient within each population. But because virulent and epidemic organisms face selection pressures for more rapid diversification in response to host immune defences, there will be higher frequencies of those mutators that have not yet been eliminated among virulent bacteria and still higher frequencies among epidemic bacteria. The frequency of transient mutators determines the population structure. At low frequencies, populations are largely asexual (clonal), whereas sex becomes more frequent with the frequency of transient mutators. As a result, virulent bacteria are expected to possess patchy sexual population structures within a generally asexual framework while epidemic bacteria are largely sexual.

References

    1. Achtman M, Pluschke G. Clonal analysis of descent and virulence among selected Escherichia coli. Annu Rev Microbiol. 1986;40:185–210. - PubMed
    1. Achtman M, Mercer A, Kusecek B, Pohl A, Heuzenroeder M, Aaronson W, et al. Six widespread bacterial clones among Escherichia coli K1 isolates. Infect Immun. 1983;39:315–335. - PMC - PubMed
    1. Arnold C, Metherell L, Willshaw G, Maggs A, Stanley J. Predictive fluorescent amplified-fragment length polymorphism analysis of Escherichia coli: high-resolution typing method with phylogenetic significance. J Clin Microbiol. 1999;37:1274–1279. - PMC - PubMed
    1. Bergthorsson U, Ochman H. Distribution of chromosome length variation in natural isolates of Escherichia coli. Mol Biol Evol. 1998;15:6–16. - PubMed
    1. Boyd EF, Nelson K, Wang FS, Whittam TS, Selander RK. Molecular genetic basis of allelic polymorphism in malate dehydrogenase (mdh) in natural populations of Escherichia coli and Salmonella enterica. Proc Natl Acad Sci USA. 1994;91:1280–1284. - PMC - PubMed

Publication types

Cite

AltStyle によって変換されたページ (->オリジナル) /