Nonlinear data alignment for UPLC-MS and HPLC-MS based metabolomics: quantitative analysis of endogenous and exogenous metabolites in human serum
- PMID: 16689529
- PMCID: PMC3705959
- DOI: 10.1021/ac060245f
Nonlinear data alignment for UPLC-MS and HPLC-MS based metabolomics: quantitative analysis of endogenous and exogenous metabolites in human serum
Abstract
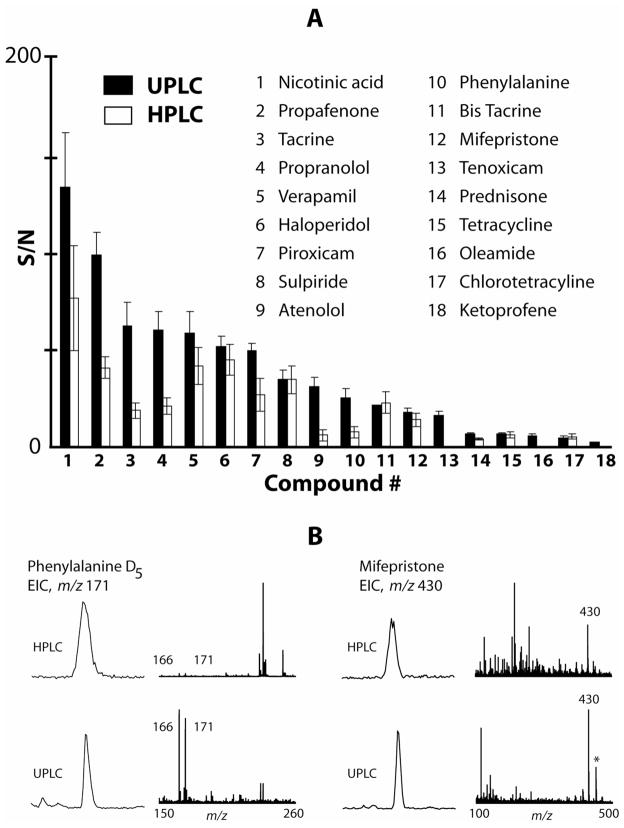
A nonlinear alignment strategy was examined for the quantitative analysis of serum metabolites. Two small-molecule mixtures with a difference in relative concentration of 20-100% for 10 of the compounds were added to human serum. The metabolomics protocol using UPLC and XCMS for LC-MS data alignment could readily identify 8 of 10 spiked differences among more than 2700 features detected. Normalization of data against a single factor obtained through averaging the XCMS integrated response areas of spiked standards increased the number of identified differences. The original data structure was well preserved using XCMS, but reintegration of identified differences in the original data reduced the number of false positives. Using UPLC for separation resulted in 20% more detected components compared to HPLC. The length of the chromatographic separation also proved to be a crucial parameter for a number of detected features. Moreover, UPLC displayed better retention time reproducibility and signal-to-noise ratios for spiked compounds over HPLC, making this technology more suitable for nontargeted metabolomics applications.
Figures
References
-
- Andreev VP, Rejtar T, Chen HS, Moskovets EV, Ivanov AR, Karger BL. A universal denoising and peak picking algorithm for LC-MS based on matched filtration in the chromatographic time domain. Anal Chem. 2003;75:6314–6326. - PubMed
-
- Boernsen KO, Gatzek S, Imbert G. Controlled protein precipitation in combination with chip-based nanospray infusion mass spectrometry. An approach for metabolomics profiling of plasma. Anal Chem. 2005;77:7255–7264. - PubMed
-
- Bylund D, Danielsson R, Malmquist G, Markides KE. Chromatographic alignment by warping and dynamic programming as a pre-processing tool for PARAFAC modelling of liquid chromatography-mass spectrometry data. J Chromatogr A. 2002;961:237–244. - PubMed
-
- Davies T. The new automated mass spectrometry Deconvolution and Identification System (AMDIS) Spectroscopy Europe. 1998:22–26.
-
- Duran AL, Yang J, Wang LJ, Sumner LW. Metabolomics spectral formatting, alignment and conversion tools (MSFACTs) Bioinformatics. 2003;19:2283–2293. - PubMed
Publication types
MeSH terms
Grants and funding
LinkOut - more resources
Full Text Sources
Other Literature Sources