This site needs JavaScript to work properly. Please enable it to take advantage of the complete set of features!
Skip to main page content
U.S. flag

An official website of the United States government

Dot gov

The .gov means it’s official.
Federal government websites often end in .gov or .mil. Before sharing sensitive information, make sure you’re on a federal government site.

Https

The site is secure.
The https:// ensures that you are connecting to the official website and that any information you provide is encrypted and transmitted securely.

NIH NLM Logo
Log in
Access keys NCBI Homepage MyNCBI Homepage Main Content Main Navigation
. 2002 Jul 1;196(1):39-49.
doi: 10.1084/jem.20020026.

Induction of NFATc2 expression by interleukin 6 promotes T helper type 2 differentiation

Affiliations

Induction of NFATc2 expression by interleukin 6 promotes T helper type 2 differentiation

Sean Diehl et al. J Exp Med. .

Abstract

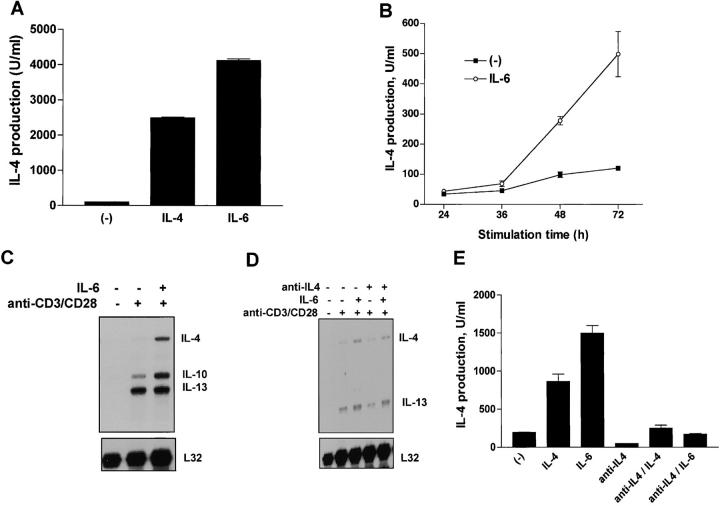
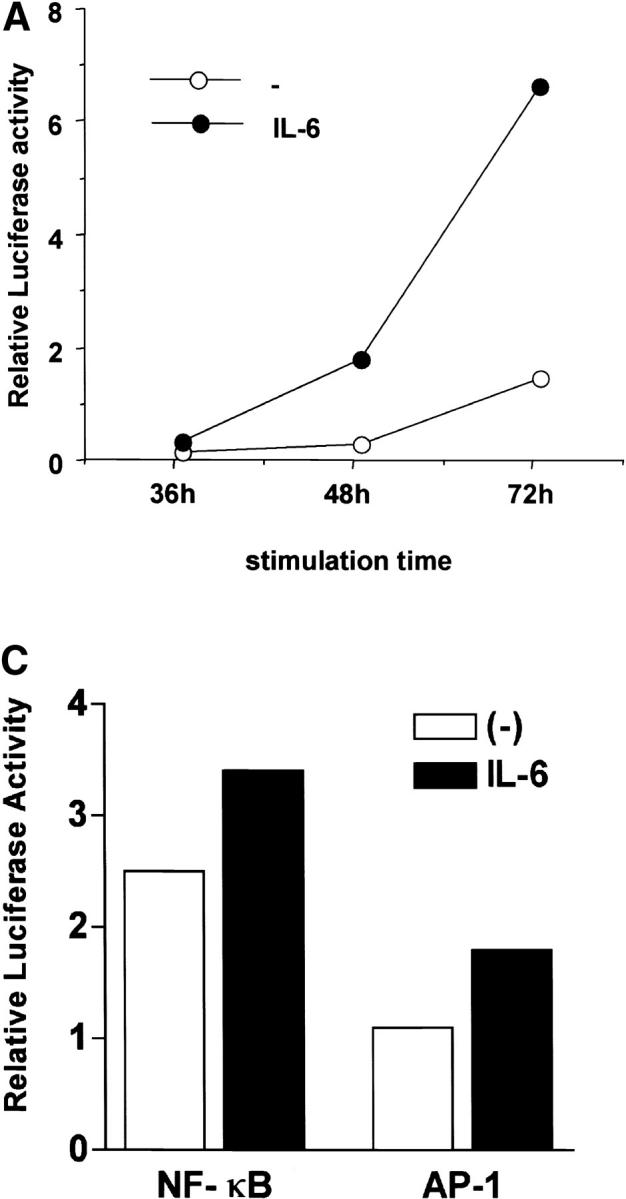
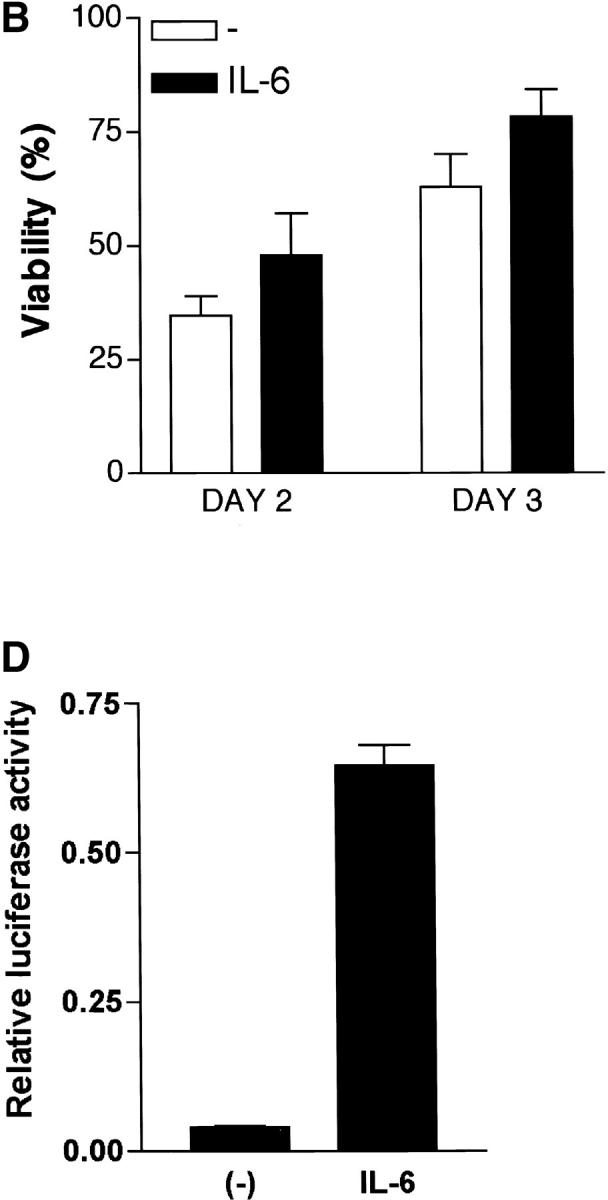
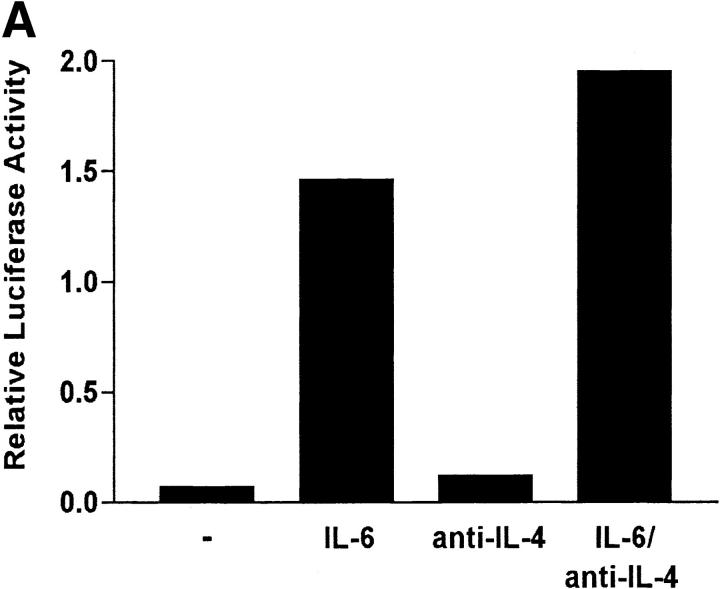
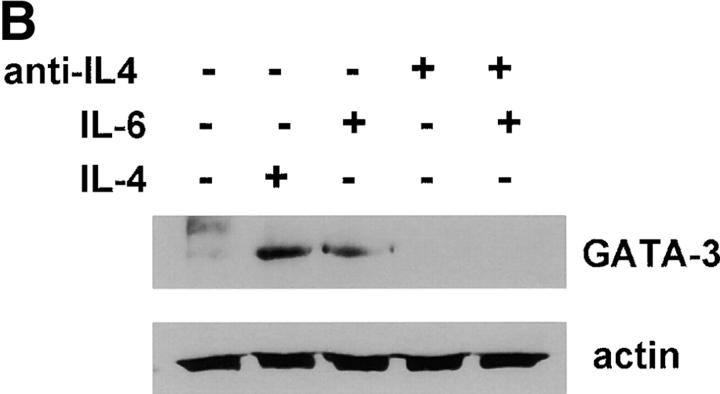
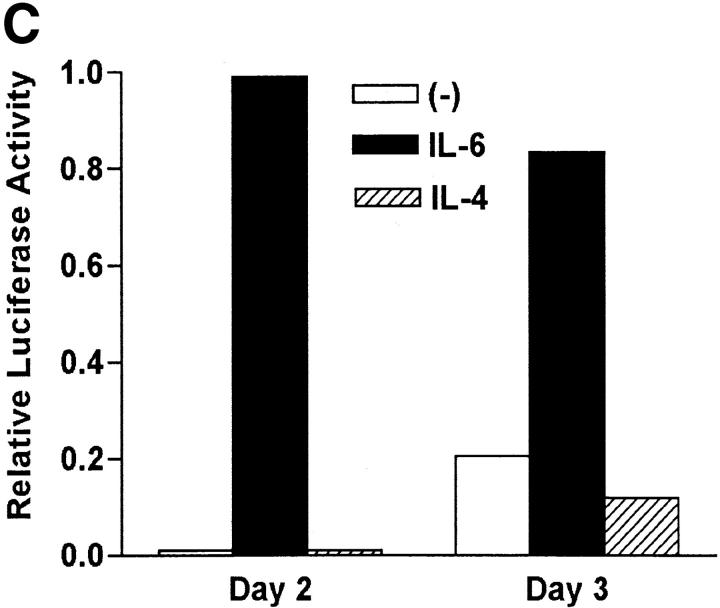
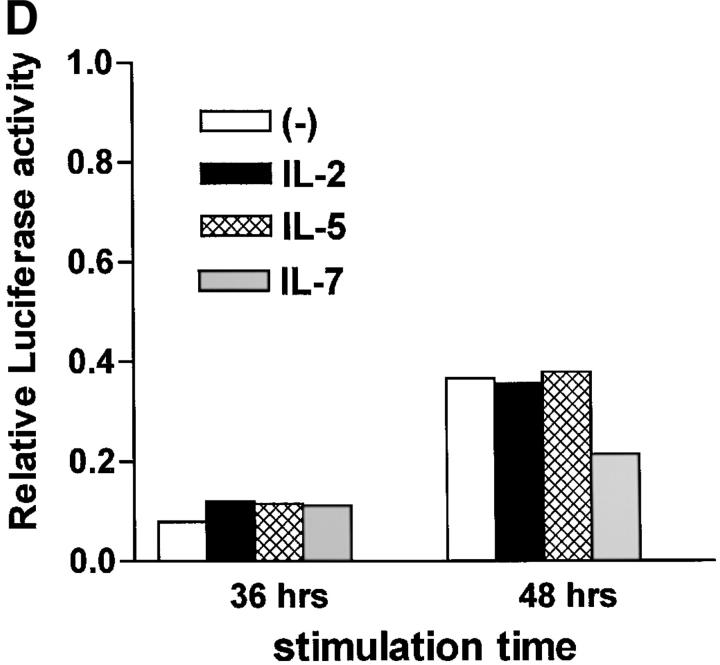
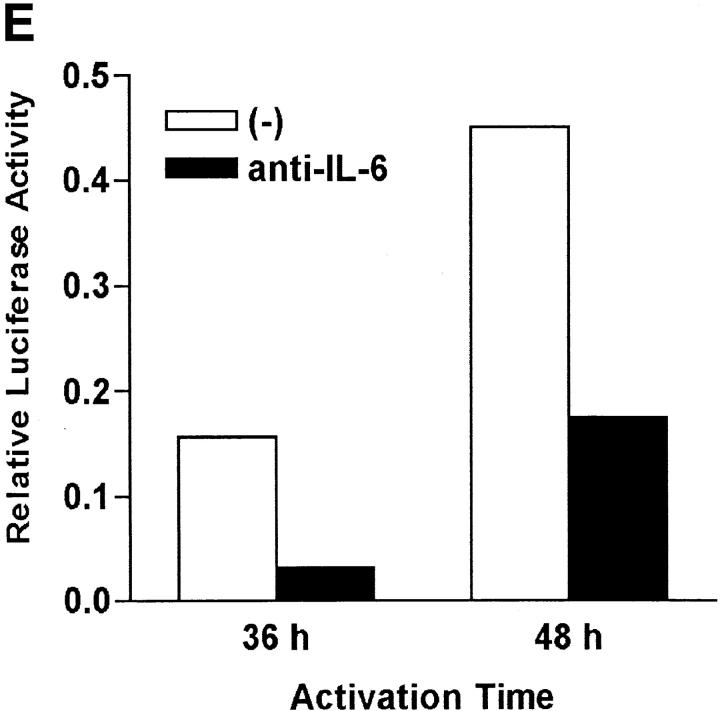
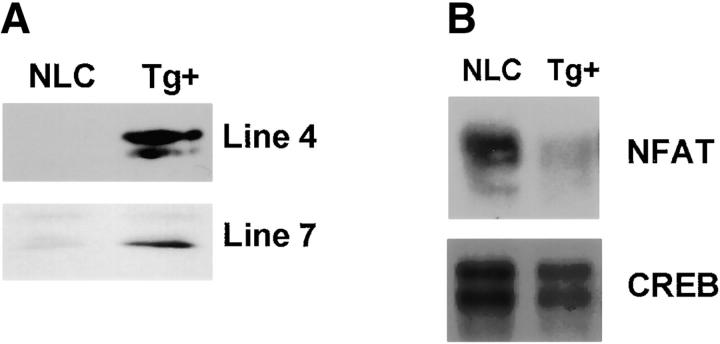
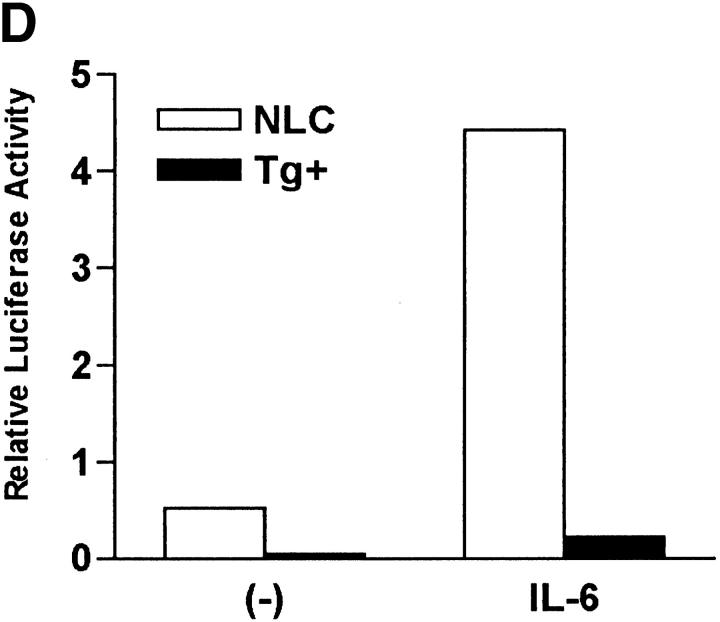
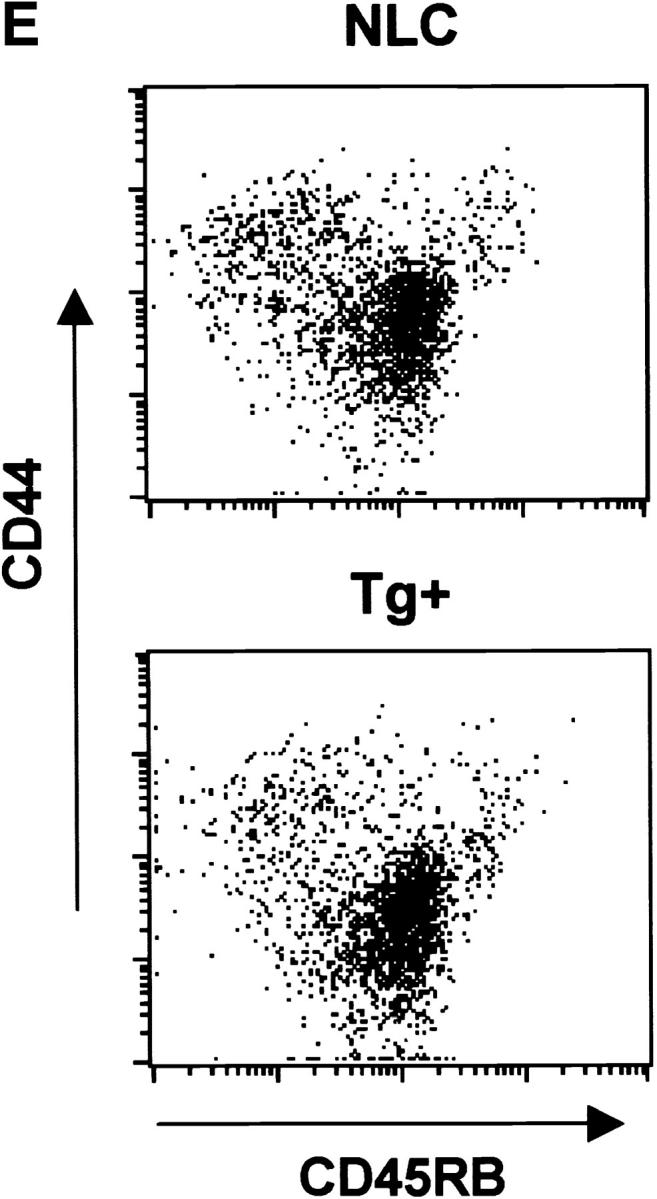
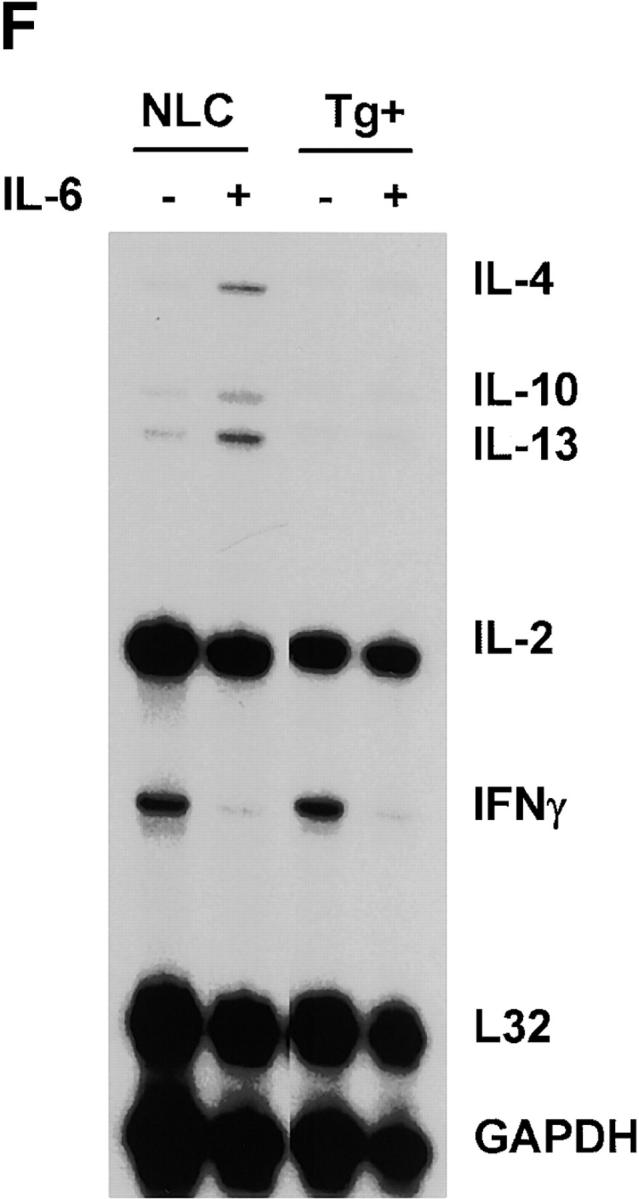
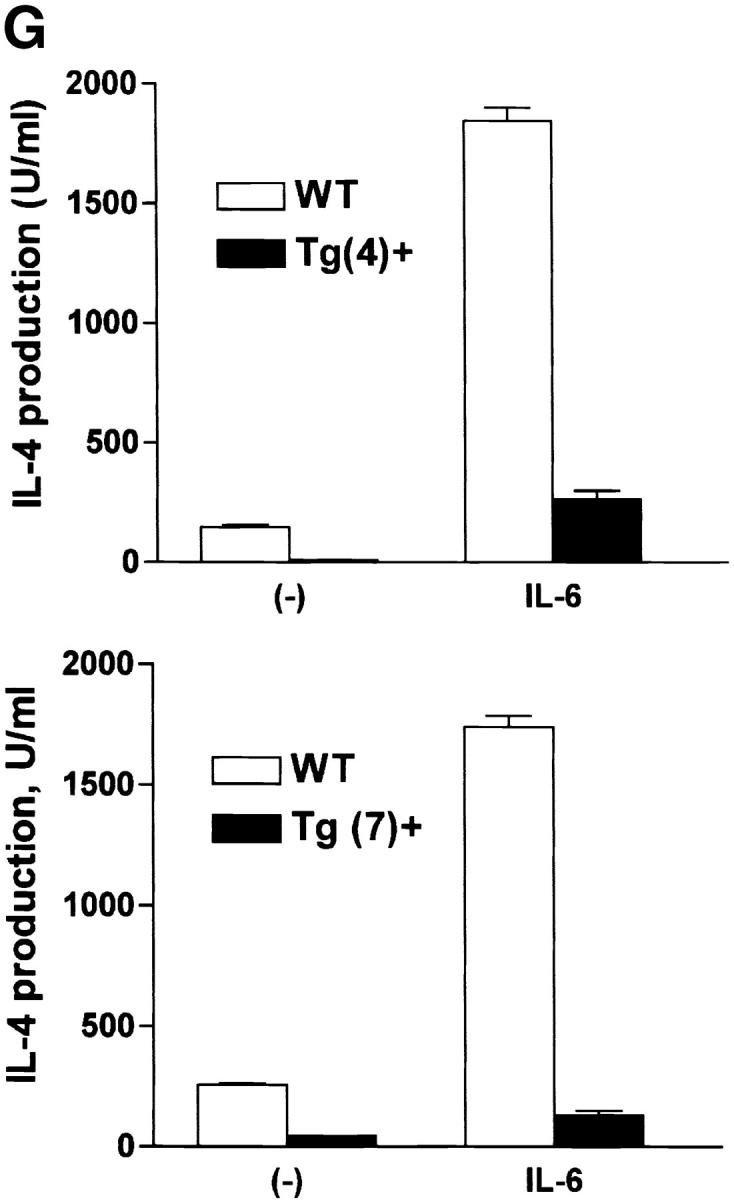
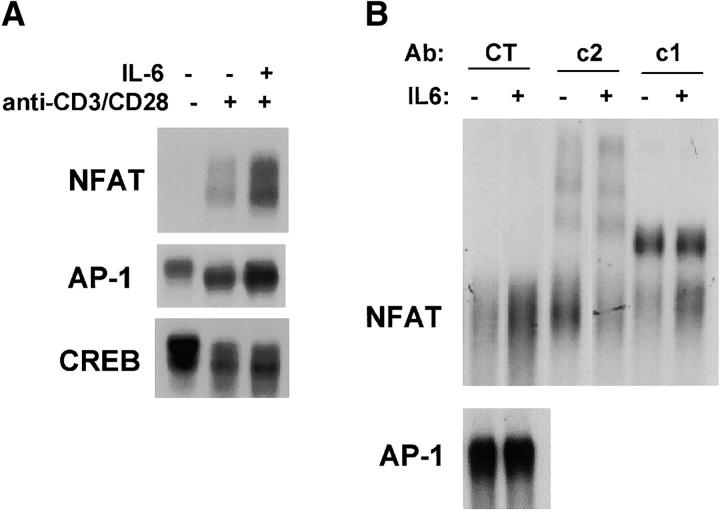
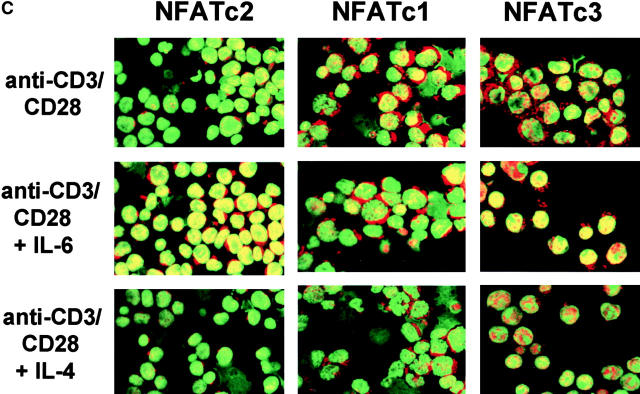
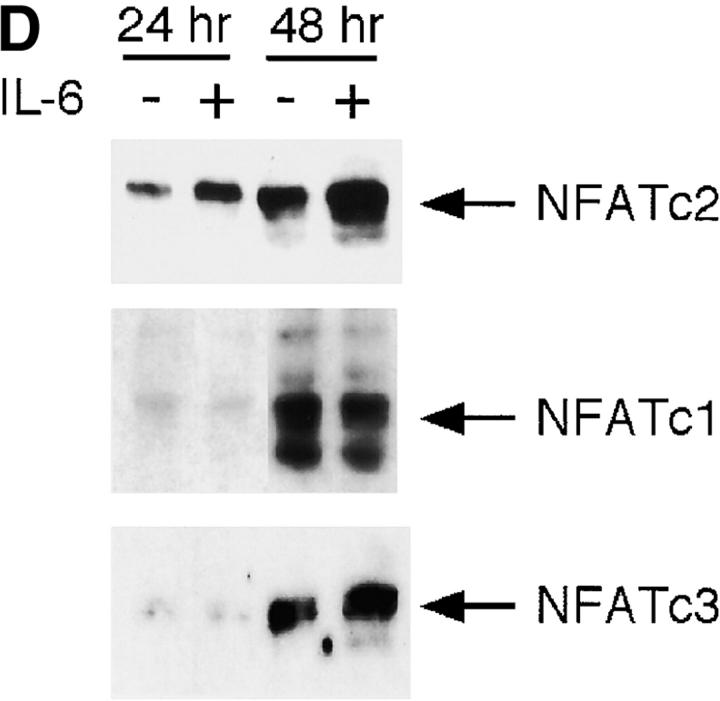
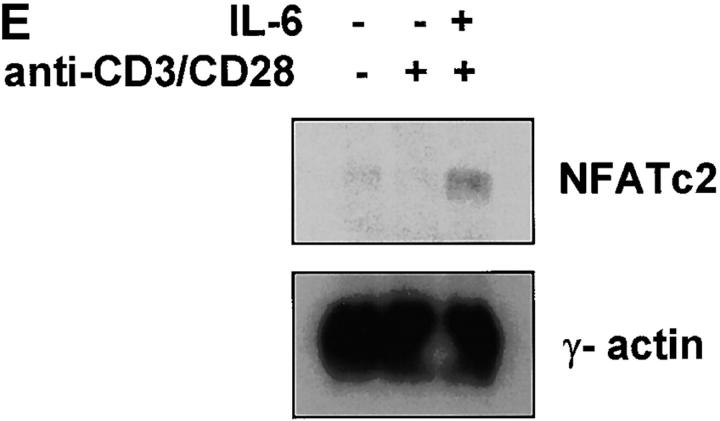
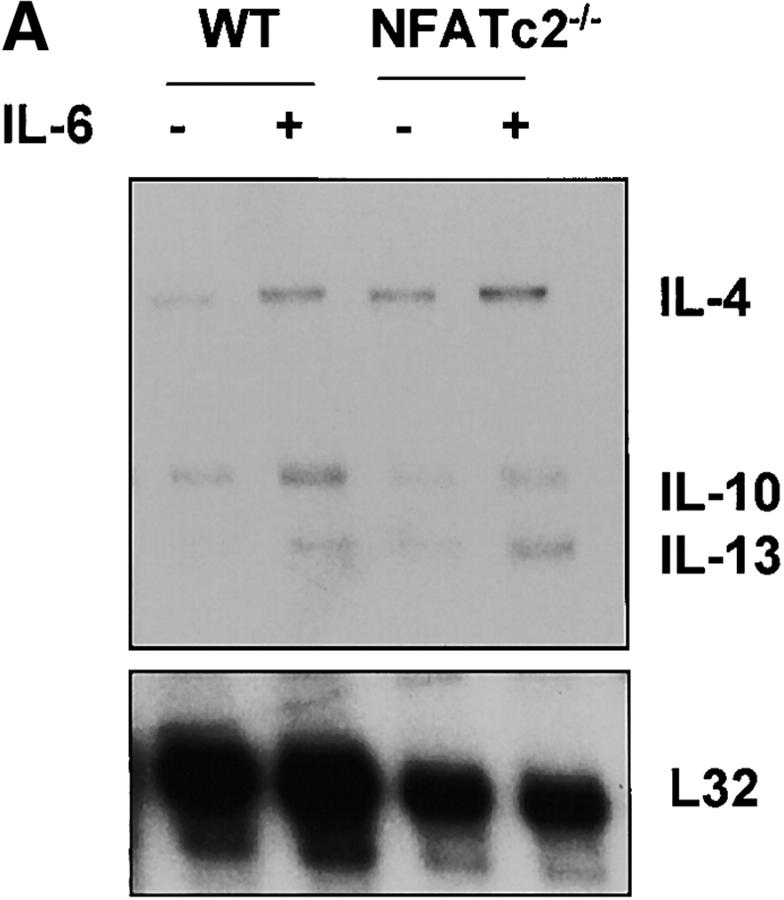
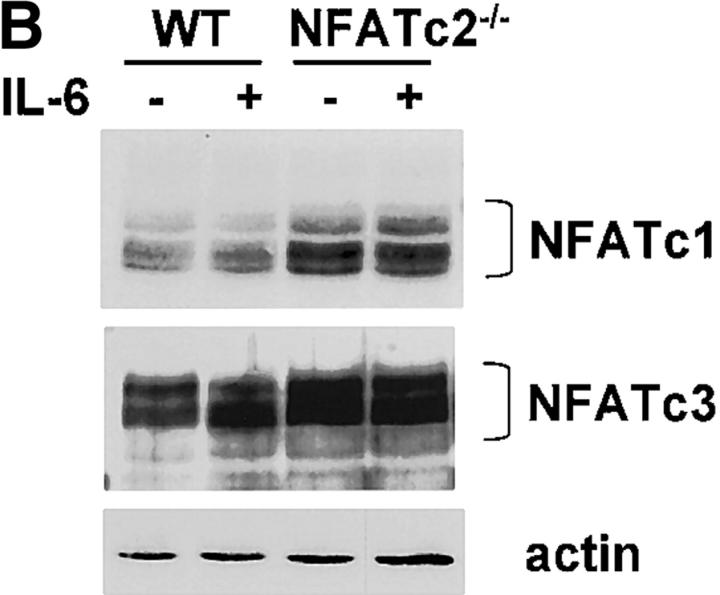
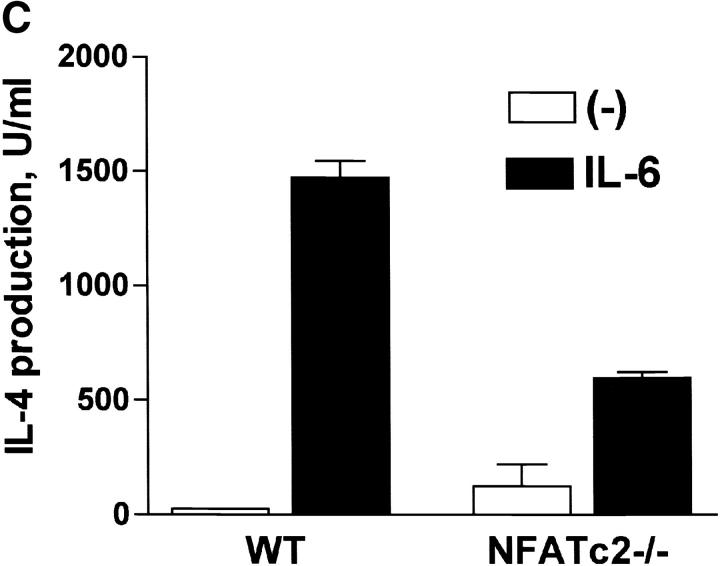
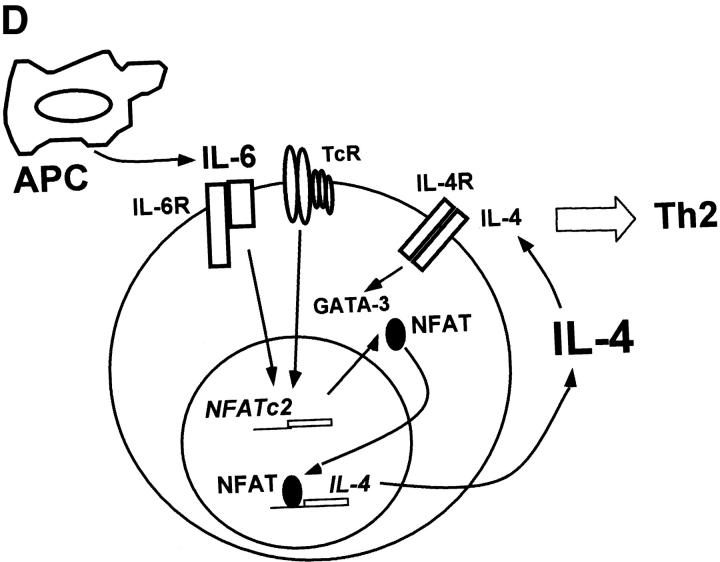
Interleukin (IL)-6 is produced by professional antigen-presenting cells (APCs) such as B cells, macrophages, and dendritic cells. It has been previously shown that APC-derived IL-6 promotes the differentiation of naive CD4+ T cells into effector T helper type 2 (Th2) cells. Here, we have studied the molecular mechanism for IL-6-mediated Th2 differentiation. During the activation of CD4+ T cells, IL-6 induces the production of IL-4, which promotes the differentiation of these cells into effector Th2 cells. Regulation of IL-4 gene expression by IL-6 is mediated by nuclear factor of activated T cells (NFAT), as inhibition of NFAT prevents IL-6-driven IL-4 production and Th2 differentiation. IL-6 upregulates NFAT transcriptional activity by increasing the levels of NFATc2. The ability of IL-6 to promote Th2 differentiation is impaired in CD4+ T cells that lack NFATc2, demonstrating that NFATc2 is required for regulation of IL-4 gene expression by IL-6. Regulation of NFATc2 expression and NFAT transcriptional activity represents a novel pathway by which IL-6 can modulate gene expression.


Figures

Figure 1.
Figure 1.
IL-6 induces IL-4 gene expression and cytokine production in CD4+ T cells. (A) CD4+ T cells (106 cells/ml) were stimulated with immobilized anti-CD3 mAb (5 μg/ml), soluble anti-CD28 mAb (1 μg/ml) and medium alone (−), IL-4 (103 U/ml), or IL-6 (100 ng/ml). After 4 d, cells were extensively washed and restimulated for 24 h with immobilized anti-CD3 mAb (5 μg/ml). Supernatants were analyzed for IL-4 production by ELISA. (B) CD4+ T cells were stimulated with anti-CD3 and anti-CD28 mAbs in the presence or absence of IL-6. Supernatants were harvested and IL-4 production was determined by ELISA at different time points after activation. (C) Total RNA extracted from unstimulated CD4+ T cells and from CD4+ T cells stimulated for 3 d with anti-CD3 and anti-CD28 mAbs (anti-CD3/CD28) in the presence or absence of IL-6 was examined by RPA. mRNA levels for IL-4, IL-10, IL-13, and L32 are shown. (D) RPA analysis of total RNA from unstimulated CD4+ T cells or from CD4+ T cells stimulated for 48 h in the absence or presence of IL-6 and/or anti–IL-4 mAb (10 μg/ml). (E) CD4+ T cells were differentiated in the absence (−), or presence of IL-4, IL-6, anti–IL-4, anti–IL-4 and IL-4 (anti–IL4/IL-4), or anti–IL-4 and IL-6 (anti–IL4/IL-6). After 4 d, the cells were washed and restimulated with anti-CD3 mAb alone. IL-4 production was determined by ELISA 24 h after restimulation.
Figure 2.
Figure 2.
Regulation of NFAT transcriptional activity by IL-6. (A) 5 ×ばつ 105 CD4+ T cells from NFAT-luciferase reporter transgenic mice were stimulated with anti-CD3 and anti-CD28 mAbs in the presence or absence of IL-6. Relative luciferase activity was measured at different periods of stimulation. (B) Viability of CD4+ T cells stimulated as in panel A was determined by Trypan Blue exclusion. (C) CD4+ T cells from AP-1- or NF-κB-luciferase reporter transgenic mice were stimulated as in panel A and luciferase activity was determined after 48 h. (D) Naive CD4+CD44low T cells were isolated from NFAT-luciferase mice by cell sorting. 4 ×ばつ 105 cells were stimulated with anti-CD3 and anti-CD28 mAbs for 48 h in the absence (−) or presence of IL-6 or IL-4 and relative luciferase activity was determined.
Figure 2.
Figure 2.
Regulation of NFAT transcriptional activity by IL-6. (A) 5 ×ばつ 105 CD4+ T cells from NFAT-luciferase reporter transgenic mice were stimulated with anti-CD3 and anti-CD28 mAbs in the presence or absence of IL-6. Relative luciferase activity was measured at different periods of stimulation. (B) Viability of CD4+ T cells stimulated as in panel A was determined by Trypan Blue exclusion. (C) CD4+ T cells from AP-1- or NF-κB-luciferase reporter transgenic mice were stimulated as in panel A and luciferase activity was determined after 48 h. (D) Naive CD4+CD44low T cells were isolated from NFAT-luciferase mice by cell sorting. 4 ×ばつ 105 cells were stimulated with anti-CD3 and anti-CD28 mAbs for 48 h in the absence (−) or presence of IL-6 or IL-4 and relative luciferase activity was determined.
Figure 3.
Figure 3.
Regulation of NFAT by IL-6 is independent of IL-4. (A) 5 ×ばつ 105 NFAT-luciferase CD4+ T cells were stimulated with anti-CD3 and anti-CD28 mAbs and medium alone (−), IL-6, anti–IL-4 mAb, or IL-6 and anti–IL-4- mAb (IL-6/anti–IL4) and luciferase activity was measured 48 h later. (B) CD4+ T cells were stimulated in the presence of medium (−), IL-4, IL-6, anti–IL-4 mAb, or IL-6 and anti–IL-4 mAb for 2 d. GATA-3 expression was determined by Western blot using whole cell extracts. Blots were stripped and reprobed for actin. (C) CD4+ T cells from NFAT-luciferase transgenic mice were stimulated with anti-CD3 and anti-CD28 mAbs in the presence of medium alone (−), IL-6, or IL-4. After 2 or 3 d, relative luciferase activity was measured. (D) NFAT- luciferase CD4+ T cells were stimulated with anti-CD3 and anti-CD28 mAbs in the presence of medium alone (−), IL-2 (25 U/ml), IL-5 (100 ng/ml), or IL-7 (100 ng/ml). Relative luciferase activity was determined after 36 or 48 h. (E) 5 ×ばつ 105 CD4+ T cells from NFAT luciferase transgenic mice were stimulated with soluble anti-CD3 mAb (1 μg/ml) and wild-type splenic APCs (2 ×ばつ 105 cells) in the presence or absence of a neutralizing anti–IL-6 mAb (10 μg/ml). Relative luciferase activity was then measured after 36 or 48 h.
Figure 3.
Figure 3.
Regulation of NFAT by IL-6 is independent of IL-4. (A) 5 ×ばつ 105 NFAT-luciferase CD4+ T cells were stimulated with anti-CD3 and anti-CD28 mAbs and medium alone (−), IL-6, anti–IL-4 mAb, or IL-6 and anti–IL-4- mAb (IL-6/anti–IL4) and luciferase activity was measured 48 h later. (B) CD4+ T cells were stimulated in the presence of medium (−), IL-4, IL-6, anti–IL-4 mAb, or IL-6 and anti–IL-4 mAb for 2 d. GATA-3 expression was determined by Western blot using whole cell extracts. Blots were stripped and reprobed for actin. (C) CD4+ T cells from NFAT-luciferase transgenic mice were stimulated with anti-CD3 and anti-CD28 mAbs in the presence of medium alone (−), IL-6, or IL-4. After 2 or 3 d, relative luciferase activity was measured. (D) NFAT- luciferase CD4+ T cells were stimulated with anti-CD3 and anti-CD28 mAbs in the presence of medium alone (−), IL-2 (25 U/ml), IL-5 (100 ng/ml), or IL-7 (100 ng/ml). Relative luciferase activity was determined after 36 or 48 h. (E) 5 ×ばつ 105 CD4+ T cells from NFAT luciferase transgenic mice were stimulated with soluble anti-CD3 mAb (1 μg/ml) and wild-type splenic APCs (2 ×ばつ 105 cells) in the presence or absence of a neutralizing anti–IL-6 mAb (10 μg/ml). Relative luciferase activity was then measured after 36 or 48 h.
Figure 4.
Figure 4.
Expression of dnNFAT inhibits IL-6–driven IL-4 production and Th2 differentiation. (A) Whole extracts were isolated from CD4+ T cells from negative littermate control (NLC) and lines no. 4 and no. 7 of dnNFAT transgenic (Tg+) mice. Expression of the dnNFAT transgene was analyzed by Western blotting using an Ab directed against the Flag tag on dn-NFAT. (B) CD4+ T cells from negative littermate control (NLC) or dnNFAT transgenic mice (Tg+) were stimulated for 12 h with anti-CD3 and anti-CD28 mAbs. Nuclear extracts were prepared and analyzed for NFAT (top panel) and CREB (bottom panel) DNA binding activity by EMSA. (C) CD4+ T cells were isolated from NFAT-luciferase ×ばつ dnNFAT doubly transgenic (Tg+) mice and NFAT-luciferase single transgenic (NLC) mice. 5 ×ばつ 105 CD4+ T cells were stimulated with PMA (5 ng/ml) and ionomycin (250 ng/ml) and luciferase activity was measured after 24 or 36 h. (D) NFAT luciferase activity was measured in 5 ×ばつ 105 CD4+ T cells from NFAT-luciferase ×ばつ dnNFAT doubly transgenic (Tg+) mice or NFAT-luciferase transgenic (NLC) mice stimulated for 2 d with anti-CD3 and anti-CD28 mAbs in the presence or absence of IL-6. (E) CD4+ T cells were purified from negative littermate control (NLC) or dnNFAT transgenic mice (Tg+), stained with anti-CD4, CD44, and CD45RB mAbs and analyzed by flow cytometry. Dot plots represent the CD44/CD45RB distribution in gated CD4+ T cells. (F) Cytokine mRNA levels were analyzed by RPA in CD4+ T cells from negative littermate control (NLC) and dnNFAT (Tg+) mice that were stimulated with anti-CD3 and anti-CD28 mAbs for 3 d in the presence or absence of IL-6. (G) CD4+ T cells from negative littermate control (NLC) or dnNFAT (Tg+) mice were stimulated for 4 d with anti-CD3 and anti-CD28 mAbs in the presence or absence of IL-6, washed, and restimulated with anti-CD3 mAb alone for 24 h IL-4 production in supernatants was determined by ELISA. WT, wild-type.
Figure 4.
Figure 4.
Expression of dnNFAT inhibits IL-6–driven IL-4 production and Th2 differentiation. (A) Whole extracts were isolated from CD4+ T cells from negative littermate control (NLC) and lines no. 4 and no. 7 of dnNFAT transgenic (Tg+) mice. Expression of the dnNFAT transgene was analyzed by Western blotting using an Ab directed against the Flag tag on dn-NFAT. (B) CD4+ T cells from negative littermate control (NLC) or dnNFAT transgenic mice (Tg+) were stimulated for 12 h with anti-CD3 and anti-CD28 mAbs. Nuclear extracts were prepared and analyzed for NFAT (top panel) and CREB (bottom panel) DNA binding activity by EMSA. (C) CD4+ T cells were isolated from NFAT-luciferase ×ばつ dnNFAT doubly transgenic (Tg+) mice and NFAT-luciferase single transgenic (NLC) mice. 5 ×ばつ 105 CD4+ T cells were stimulated with PMA (5 ng/ml) and ionomycin (250 ng/ml) and luciferase activity was measured after 24 or 36 h. (D) NFAT luciferase activity was measured in 5 ×ばつ 105 CD4+ T cells from NFAT-luciferase ×ばつ dnNFAT doubly transgenic (Tg+) mice or NFAT-luciferase transgenic (NLC) mice stimulated for 2 d with anti-CD3 and anti-CD28 mAbs in the presence or absence of IL-6. (E) CD4+ T cells were purified from negative littermate control (NLC) or dnNFAT transgenic mice (Tg+), stained with anti-CD4, CD44, and CD45RB mAbs and analyzed by flow cytometry. Dot plots represent the CD44/CD45RB distribution in gated CD4+ T cells. (F) Cytokine mRNA levels were analyzed by RPA in CD4+ T cells from negative littermate control (NLC) and dnNFAT (Tg+) mice that were stimulated with anti-CD3 and anti-CD28 mAbs for 3 d in the presence or absence of IL-6. (G) CD4+ T cells from negative littermate control (NLC) or dnNFAT (Tg+) mice were stimulated for 4 d with anti-CD3 and anti-CD28 mAbs in the presence or absence of IL-6, washed, and restimulated with anti-CD3 mAb alone for 24 h IL-4 production in supernatants was determined by ELISA. WT, wild-type.
Figure 5.
Figure 5.
IL-6 induces NFATc2 expression. (A) Nuclear extracts were prepared from unstimulated CD4+ T cells or from CD4+ T cells that were stimulated with anti-CD3 and anti-CD28 mAbs in the presence of absence of IL-6 for 2 d. Extracts were incubated with a double-stranded oligonucleotide containing the NFAT (top panel), AP-1 (middle panel), or CREB (bottom panel) binding sequence and DNA binding complexes were resolved by EMSA. (B) CD4+ T cells were stimulated with anti-CD3 and anti-CD28 mAbs in the presence or absence of IL-6. After 2 d nuclear extracts were prepared and NFAT and AP-1 DNA binding activity was determined by EMSA. Binding reactions were performed in the presence of control anti-GST Ab (CT), anti-NFATc2 (c2) Ab, or anti-NFATc1 (c1) mAb. (C) NFATc2 (left panels), NFATc1 (middle panels), and NFATc3 (right panels) expression in CD4+ T cells stimulated for 2 d in the absence or presence of IL-6 or IL-4 was determined by confocal microscopy using specific anti-NFAT Abs and the DNA marker YOYO for nuclear detection. Green color represents YOYO, red color indicates NFAT staining, and yellow color indicates colocalization of YOYO and NFAT (×ばつ). (D) CD4+ T cells were stimulated with anti-CD3 and anti-CD28 mAbs in the presence or absence of IL-6 for 2 d. Whole cell extracts were prepared and examined for NFATc2, NFATc1, and NFATc3 protein levels by Western blot. Blots were stripped and reprobed for determination of NFATc1 and NFATc3 expression. (E) Northern blot analysis of NFATc2 gene expression using total RNA from unstimulated CD4+ T cells and cells stimulated in the presence or absence of IL-6. γ-actin expression was examined as a loading control.
Figure 5.
Figure 5.
IL-6 induces NFATc2 expression. (A) Nuclear extracts were prepared from unstimulated CD4+ T cells or from CD4+ T cells that were stimulated with anti-CD3 and anti-CD28 mAbs in the presence of absence of IL-6 for 2 d. Extracts were incubated with a double-stranded oligonucleotide containing the NFAT (top panel), AP-1 (middle panel), or CREB (bottom panel) binding sequence and DNA binding complexes were resolved by EMSA. (B) CD4+ T cells were stimulated with anti-CD3 and anti-CD28 mAbs in the presence or absence of IL-6. After 2 d nuclear extracts were prepared and NFAT and AP-1 DNA binding activity was determined by EMSA. Binding reactions were performed in the presence of control anti-GST Ab (CT), anti-NFATc2 (c2) Ab, or anti-NFATc1 (c1) mAb. (C) NFATc2 (left panels), NFATc1 (middle panels), and NFATc3 (right panels) expression in CD4+ T cells stimulated for 2 d in the absence or presence of IL-6 or IL-4 was determined by confocal microscopy using specific anti-NFAT Abs and the DNA marker YOYO for nuclear detection. Green color represents YOYO, red color indicates NFAT staining, and yellow color indicates colocalization of YOYO and NFAT (×ばつ). (D) CD4+ T cells were stimulated with anti-CD3 and anti-CD28 mAbs in the presence or absence of IL-6 for 2 d. Whole cell extracts were prepared and examined for NFATc2, NFATc1, and NFATc3 protein levels by Western blot. Blots were stripped and reprobed for determination of NFATc1 and NFATc3 expression. (E) Northern blot analysis of NFATc2 gene expression using total RNA from unstimulated CD4+ T cells and cells stimulated in the presence or absence of IL-6. γ-actin expression was examined as a loading control.
Figure 6.
Figure 6.
NFATc2 is required for IL-6–mediated Th2 differentiation. (A) Total RNA from wild-type (WT) or NFATc2-deficient (NFATc2−/−) CD4+ T cells that were stimulated for 2 d in the presence or absence of IL-6 was subjected to RPA analysis. (B) NFATc1 and NFATc3 protein levels were determined by Western blot analysis of whole cell lysates from wild-type and NFATc2−/− CD4+ T cells stimulated for 4 d in the presence or absence of IL-6. Actin is shown as a loading control. (C) CD4+ T cells from wild-type or NFATc2−/− mice were stimulated for 4 d with anti-CD3 and anti-CD28 mAbs in the absence (−) or presence of IL-6. After 4 d cells were washed, restimulated with anti-CD3, and IL-4 production was determined after 24 h. Results are representative of three experiments. (D) NFAT-mediated differentiation of Th2 cells by IL-6.
Figure 6.
Figure 6.
NFATc2 is required for IL-6–mediated Th2 differentiation. (A) Total RNA from wild-type (WT) or NFATc2-deficient (NFATc2−/−) CD4+ T cells that were stimulated for 2 d in the presence or absence of IL-6 was subjected to RPA analysis. (B) NFATc1 and NFATc3 protein levels were determined by Western blot analysis of whole cell lysates from wild-type and NFATc2−/− CD4+ T cells stimulated for 4 d in the presence or absence of IL-6. Actin is shown as a loading control. (C) CD4+ T cells from wild-type or NFATc2−/− mice were stimulated for 4 d with anti-CD3 and anti-CD28 mAbs in the absence (−) or presence of IL-6. After 4 d cells were washed, restimulated with anti-CD3, and IL-4 production was determined after 24 h. Results are representative of three experiments. (D) NFAT-mediated differentiation of Th2 cells by IL-6.

References

    1. Taga, T., M. Hibi, Y. Hirata, K. Yamasaki, K. Yasukawa, T. Matsuda, T. Hirano, and T. Kishimoto. 1989. Interleukin-6-triggers the association of its receptor with a possible signal transducer, gp 130. Cell. 58:573–581. - PubMed
    1. Daeipour, M., G. Kumar, M.C. Amaral, and A.E. Nel. 1993. Recombinant IL-6 activates p42 and p44 mitogen-activated protein kinases in the IL-6 responsive B cell line, AF-10. J. Immunol. 150:4743–4753. - PubMed
    1. Akira, S., H. Issihiki, T. Sugita, O. Tanabe, S. Kinoshita, Y. Nishio, T. Nakajima, T. Hirano, and T. Kishimoto. 1990. A nuclear factor for IL-6 expression (NF-IL6) is a member of a C/EBP family. EMBO J. 9:1897–1906. - PMC - PubMed
    1. Poli, V., F.P. Mancini, and R. Cortese. 1990. IL-6DBP, a nuclear protein involved in interleukin-6 signal transduction, defines a new family of leucine zipper proteins related to C/EBP. Cell. 63:643–653. - PubMed
    1. Ramji, D.P., A. Vitelli, F. Tronche, R. Cortese, and G. Ciliberto. 1993. The two C/EBP isoforms, IL-6DBP/NF-IL6 and C/EBP delta/NF-IL6 beta, are induced by IL-6 to promote acute phase gene transcription via different mechanisms. Nucleic Acids Res. 21:289–294. - PMC - PubMed

Publication types

MeSH terms

Cite

AltStyle によって変換されたページ (->オリジナル) /