This site needs JavaScript to work properly. Please enable it to take advantage of the complete set of features!
Skip to main page content
U.S. flag

An official website of the United States government

Dot gov

The .gov means it’s official.
Federal government websites often end in .gov or .mil. Before sharing sensitive information, make sure you’re on a federal government site.

Https

The site is secure.
The https:// ensures that you are connecting to the official website and that any information you provide is encrypted and transmitted securely.

NIH NLM Logo
Log in
Access keys NCBI Homepage MyNCBI Homepage Main Content Main Navigation
. .&checktime(2001,1,1,':').
doi: 10.1186/1471-2334年1月1日. Epub 2001 Feb 2.

Endemic and epidemic dynamics of cholera: the role of the aquatic reservoir

Affiliations

Endemic and epidemic dynamics of cholera: the role of the aquatic reservoir

C T Codeço. BMC Infect Dis. 2001.

Abstract

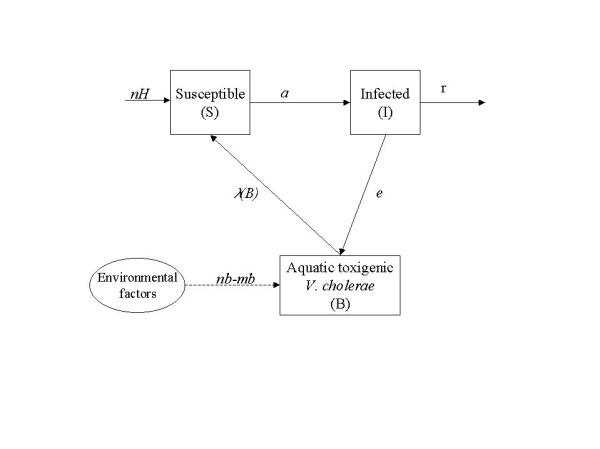
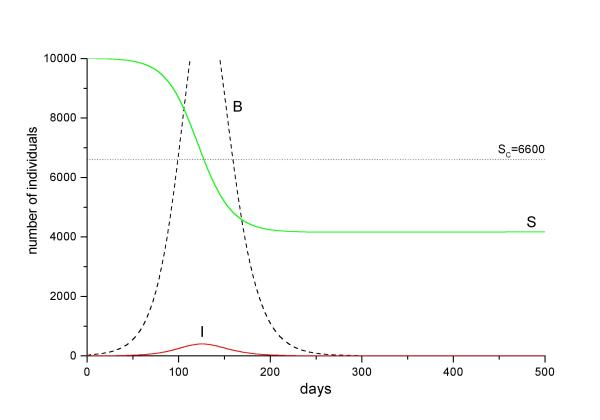
Background: In the last decades, attention to cholera epidemiology increased, as cholera epidemics became a worldwide health problem. Detailed investigation of V. cholerae interactions with its host and with other organisms in the environment suggests that cholera dynamics is much more complex than previously thought. Here, I formulate a mathematical model of cholera epidemiology that incorporates an environmental reservoir of V. cholerae. The objective is to explore the role of the aquatic reservoir on the persistence of endemic cholera as well as to define minimum conditions for the development of epidemic and endemic cholera.

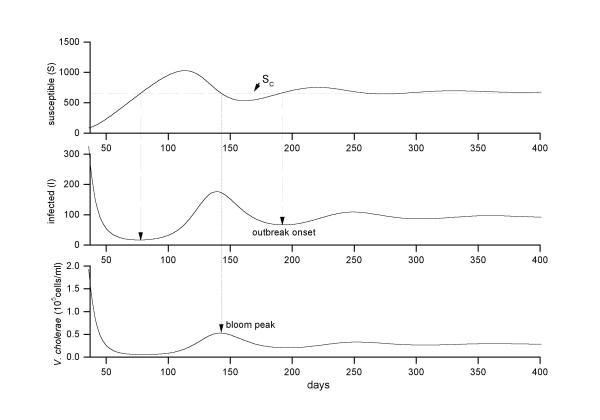
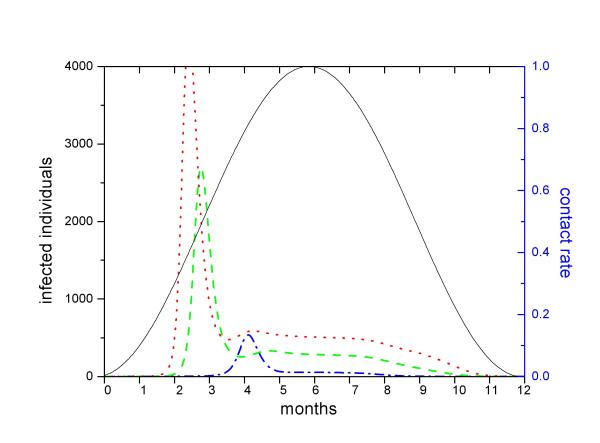
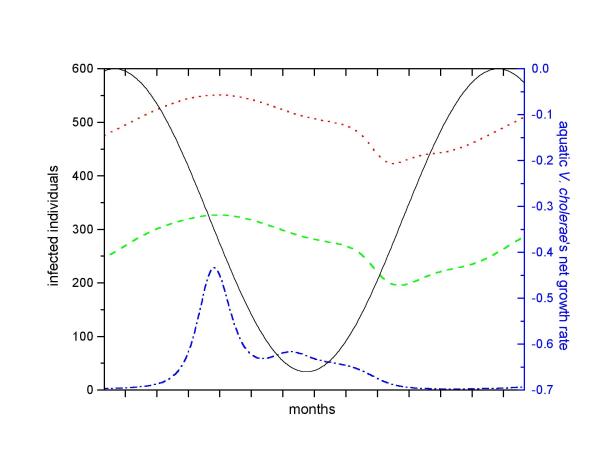
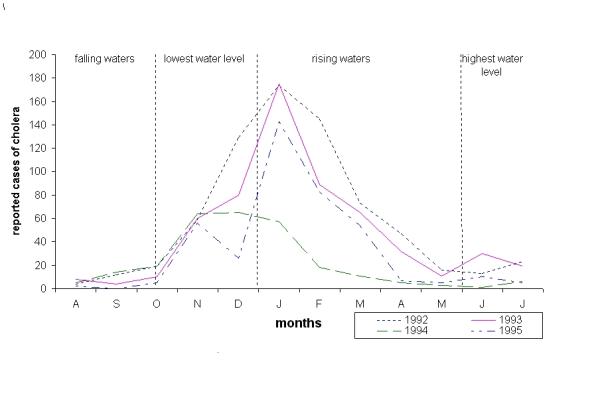
Results: The reproduction rate of cholera in a community is defined by the product of social and environmental factors. The importance of the aquatic reservoir depends on the sanitary conditions of the community. Seasonal variations of contact rates force a cyclical pattern of cholera outbreaks, as observed in some cholera-endemic communities.

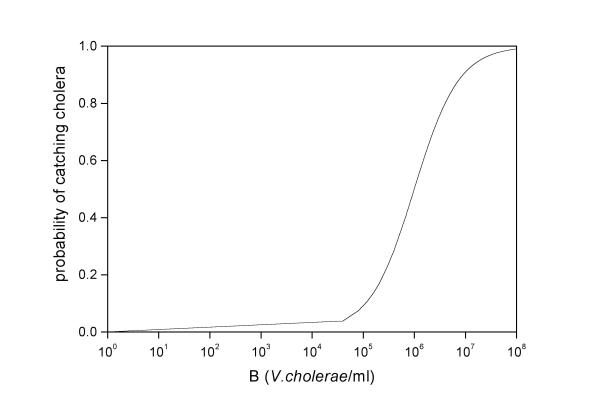
Conclusions: Further development on cholera modeling requires a better understanding of V. cholerae ecology and epidemiology. We need estimates of the prevalence of V. cholerae infection in endemic populations as well as a better description of the relationship between dose and virulence.


Figures

Figure 1
Figure 1
Model diagram (symbols are listed in table 1). All individuals in population H are born susceptible. Susceptible people (S) become infected as they are exposed to contaminated water (i.e., to B). Infected people recover at a rate r. Recovered population is not explicitly included but its size can be estimated by H-I-S (since total population is constant). While infected, individuals contribute to the enhancement of bacterial population through excretion. Bacterial population in the aquatic reservoir (B) may also grow in the water at a rate determined by environmental factors (temperature, for example).
Figure 2
Figure 2
Dose-dependent infection rate.
Figure 3
Figure 3
Effect of e (mean contribution of each individual to water contamination) on the threshold population size SC (equation 5). Curve a = 0.5 uses parameters from community 1; curve a = 1 uses parameters from communities 2 and 3 (table 2). Each curve defines values of e and SC at which R0 = 1 (see additional material: Appendix). A community located above its curve will suffer an outbreak following the introduction of infectives. A community located below its curve, will not. The three hypothetical communities occupy the same position in this graph as they share the same initial susceptible pool size and degree of water contamination. However, community 1 does not suffer a cholera outbreak because the lower contact with contaminated water (a = 0.5) shifts its threshold curve outwards. Communities 2 and 3 are located above their threshold curve (a = 1); the introduction of infectives will trigger an outbreak.
Figure 4
Figure 4
Simulation of a cholera outbreak in Community 2 (numerical solution of equation system 1 with parameters from table 2). The simulation starts with 10,000 susceptibles. The arrival of an infected individual triggers an outbreak. Bacterial density in the water (dashed black line) increases as result of human excretion. The epidemic curve (red solid line) starts to decline when the number of susceptibles crosses down the threshold line Sc.
Figure 5
Figure 5
Simulation of cholera dynamics in the hypothetical community 3, using parameters from table 2. The fast turnover of susceptibles allows cholera to persist. After the initial outbreak (not shown, but similar to figure 4), cholera prevalence oscillates until it reaches a steady-state. Oscillations are triggered when the number of susceptibles exceed the Sc threshold (dashed line).
Figure 6
Figure 6
Simulation of a community that experiences seasonal contact with contaminated waters (due to periodic flooding, for example). Periodic fluctuation of the contact rate causes oscillations in the number of infections. During the low contact period, no infections occur. As contact increases (due to rising waters in a flooding area, for example), the probability of catching cholera increases. Outbreaks tend to occur sooner in larger populations. Dot-dashed line shows the number of infections in a population with 1,000 individuals, dashed line in a 5,500 population and dotted line in a 100,000 population. In large populations, the seasonal outbreak may be followed by a period with relatively constant incidence as contact rate continues high.
Figure 7
Figure 7
Dynamics of infection in a hypothetical population with 1,000; 5,500 and 100,000 individuals under seasonal variation of the water contamination rate (due to water shortage, for example). Symbols are the same as figure 6. Seasonal decay of water quality triggers periodic outbreaks that are followed by a period of approximately constant prevalence.
Figure 8
Figure 8
Dynamics of infection in a population with 1,000; 5,500 and 100,000 individuals in contact with a environmental reservoir of toxigenic V. cholerae. In this reservoir, growth rate of V. cholerae oscillates due to variations in water temperature, for example. Line symbols are the same of figure 6. As in figures 6 and 7, seasonal growth of V. cholerae in the environment also triggers seasonal outbreaks of cholera.
Figure 9
Figure 9
Periodicity of reported cases of cholera in the Brazilian Central Amazon region. This region is characterized by seasonal flooding of the Negro and Amazon Rivers, driven mainly by snow melt in the Andean headwaters of the Amazon River.

References

    1. Epstein PR. Algal blooms in the spread and persistence of cholera. Biosystems. 1993;31:209–221. doi: 10.1016/0303-2647(93)90050-M. - DOI - PubMed
    1. Islam MS, Miah MA, Hasan MK, Sack RB, Albert MJ. Detection of non-culturable Vibrio cholerae O1 associated with a cyanobacterium from an aquatic environment in Bangladesh. Transactions of the Royal Society of Tropical Medicine and Hygiene. 1994;88:298–299. - PubMed
    1. Faruque SM, Albert MJ, Mekalanos JJ. Epidemiology, genetics and ecology of toxigenic Vibrio cholerae. Microbiology and Molecular Biology Reviews. 1998;62:1301–1314. - PMC - PubMed
    1. Morillon M, De Pina JJ, Husser JA, Baundet JM, Bertherat E, Martet G. Djibouti, histoire de deux épidémies de choléra: 1993-1994. Bull Soc Path Ex. 1998;91:407–411. - PubMed
    1. Islam MS, Drasar B, Bradley SR. Probable role of blue-green algae in maintaining endemicity and seasonality of cholera in Bangladesh: a hypothesis. J Diarrhoeal Dis Res. 1994;12:245–256. - PubMed

Publication types

Cite

AltStyle によって変換されたページ (->オリジナル) /