MATLAB: An Introduction with Applications
MATLAB: An Introduction with Applications
6th Edition
ISBN: 9781119256830
Author: Amos Gilat
Publisher: John Wiley & Sons Inc
expand_more
expand_more
format_list_bulleted
Bartleby Related Questions Icon
Related questions
Question
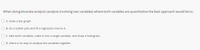
Transcribed Image Text:When doing bivariate analysis (analysis involving two variables) where both variables are quantitative the best approach would be to:
A. draw a bar graph
B. do a scatter plot and fit a regression line to it.
C. take both variables, make it into a single variable, and draw a histogram.
D. there is no way to analyse the variables together.
Expert Solution
Check MarkThis question has been solved!
Explore an expertly crafted, step-by-step solution for a thorough understanding of key concepts.
bartleby
This is a popular solution
bartleby
Trending nowThis is a popular solution!
bartleby
Step by stepSolved in 2 steps
Knowledge Booster
Background pattern image
Similar questions
- 9. Find the equation of the regression line for the given data. Then construct a scatter plot of the data and draw the regression line. (Each pair of variables has a significant correlation.) Then use the regression equation to predict the value of y for each of the given x-values, if meaningful. The caloric content and the sodium content (in milligrams) for 6 beef hot dogs are shown in the table below. Calories, x Sodium, y 160 130 330 120 70 190 (a) x = 170 calories (c) x = 150 calories 180 (b) x = 80 calories 420 470 360 250 530 (d) x = 210 calories Find the regression equation. x+( (Round to three decimal places as needed.) y = Choose the correct graph below. OA. О В. OC. OD. 560- 560 560 560- 200 G 0IN T> 200 200 Calories Calories Calories Calories (a) Predict the value of y for x = 170. Choose the correct answer below. O A. 411.632 O B. 543.752 O C. 455.672 O D. not meaningful (b) Predict the value of y for x = 80. Choose the correct answer below. O A. 411.632 О В. 257.492 O C....arrow_forwardPlease answer... I'm needed only 1 hours time to dd .... Thank uarrow_forwardIn R there is a dataset called diamonds that contains measurements of about 500 diamonds sold in the US. There are three variables present: price (price in US dollar), carat (weight of the diamond), and table (width of top of diamond relative to the widest point). The attached image is a screenshot of the R dataset with the regression table and all that. ANSWER THIS QUESTION IN WORDS: Discuss the regression between the variables table and price. You should address the explanatory variable, response variable, correlation, and sign. You should interpret the slope, the t and p-value, and how much is explained by the response.arrow_forward
- For the following data set, find the regression line without using a calculator. x 1 2 3 4 y 26 8 9 y =arrow_forwardThe accompanying table shows a portion of data that refers to the property taxes owed by a homeowner (in $) and the size of the home (in square feet) in an affluent suburb 30 miles outside New York City. Click here for the Excel Data File Taxes Size 21,987 2,403 17,353 2,451 29,238 2,866 a. Estimate the sample regression equation that enables us to predict property Taxes on the basis of the size of the home. (Round your answers to 2 decimal places.) Taxes = + Size. b. Interpret the slope coefficient. O As Property Taxes increase by 1 dollar, the size of the house increases by 6.71 ft. O As Size increases by 1 square foot, the property taxes are predicted to increase by 6ドル.71. c. Predict the property Taxes for a 1,400-square-foot home. (Round coefficient estimates to at least 4 decimal places and final answer to 2 decimal places.) Taxesarrow_forwarda) Determine the correlation coefficient, r, and interpret this value in the context of the problem. (Round 4 decimal places)b) Find the equation of the regression line for the given data. (Round the slope and y-intercept 4 decimal places).c) Give a practical interpretation of the slope of the regression line.arrow_forward
arrow_back_ios
arrow_forward_ios
Recommended textbooks for you
- Text book imageMATLAB: An Introduction with ApplicationsStatisticsISBN:9781119256830Author:Amos GilatPublisher:John Wiley & Sons IncText book imageProbability and Statistics for Engineering and th...StatisticsISBN:9781305251809Author:Jay L. DevorePublisher:Cengage LearningText book imageStatistics for The Behavioral Sciences (MindTap C...StatisticsISBN:9781305504912Author:Frederick J Gravetter, Larry B. WallnauPublisher:Cengage Learning
- Text book imageElementary Statistics: Picturing the World (7th E...StatisticsISBN:9780134683416Author:Ron Larson, Betsy FarberPublisher:PEARSONText book imageThe Basic Practice of StatisticsStatisticsISBN:9781319042578Author:David S. Moore, William I. Notz, Michael A. FlignerPublisher:W. H. FreemanText book imageIntroduction to the Practice of StatisticsStatisticsISBN:9781319013387Author:David S. Moore, George P. McCabe, Bruce A. CraigPublisher:W. H. Freeman
Text book image
MATLAB: An Introduction with Applications
Statistics
ISBN:9781119256830
Author:Amos Gilat
Publisher:John Wiley & Sons Inc
Text book image
Probability and Statistics for Engineering and th...
Statistics
ISBN:9781305251809
Author:Jay L. Devore
Publisher:Cengage Learning
Text book image
Statistics for The Behavioral Sciences (MindTap C...
Statistics
ISBN:9781305504912
Author:Frederick J Gravetter, Larry B. Wallnau
Publisher:Cengage Learning
Text book image
Elementary Statistics: Picturing the World (7th E...
Statistics
ISBN:9780134683416
Author:Ron Larson, Betsy Farber
Publisher:PEARSON
Text book image
The Basic Practice of Statistics
Statistics
ISBN:9781319042578
Author:David S. Moore, William I. Notz, Michael A. Fligner
Publisher:W. H. Freeman
Text book image
Introduction to the Practice of Statistics
Statistics
ISBN:9781319013387
Author:David S. Moore, George P. McCabe, Bruce A. Craig
Publisher:W. H. Freeman