MATLAB: An Introduction with Applications
MATLAB: An Introduction with Applications
6th Edition
ISBN: 9781119256830
Author: Amos Gilat
Publisher: John Wiley & Sons Inc
expand_more
expand_more
format_list_bulleted
Bartleby Related Questions Icon
Related questions
bartleby
Concept explainers
Question
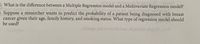
Transcribed Image Text:What is the difference between a Multiple Regression model and a Multivariate Regression model?
Suppose a researcher wants to predict the probability of a patient being diagnosed with breast
cancer given their
be used?
age, family history, and smoking status. What type of regression model should
alsboin sisiurviluM bae alqiluM alm?
Expert Solution
Check MarkThis question has been solved!
Explore an expertly crafted, step-by-step solution for a thorough understanding of key concepts.
bartleby
This is a popular solution
bartleby
Trending nowThis is a popular solution!
bartleby
Step by stepSolved in 2 steps
Knowledge Booster
Background pattern image
Learn more about
Need a deep-dive on the concept behind this application? Look no further. Learn more about this topic, statistics and related others by exploring similar questions and additional content below.Similar questions
- A real estate builder wishes to determine how house size (House) is influenced by family income (Income) and family size (Size). House size is measured in meter square and income is measured in IDR millions. The builder randomly selected 50 families and ran the multiple regression. Partial Microsoft Excel output is provided below: Which of the independent variables in the model are significant at the 5% level? Formulate the hypothesis and explain the answer. How far can you rely upon this model? Or, what is the percentage variation in House explained by the model? What is the predicted house size (in hundreds of square feet) for an individual earning an annual income of IDR 400 million and having a family size of 4?arrow_forwardDiscuss the advantages of using data collected from a designed experiment in performing a regression analysis.arrow_forwardIf the regression line is not a "good fit" what would be better to use to approximate a response variable?arrow_forward
- Please see attached image. In analyzing the effects of an after-school reading program, you run a regression analysis with program participation as the independent variable (0 = control group; 1 = intervention group) and scores on a reading comprehension exam after the program as the dependent variable. Is the effect of the after-school reading program statistically significant? How can you tell, and what does this mean?arrow_forwardA colleague of yours is completing a final report on the causes of the frequency of cyberbullying. In this report, she is asked to identify the causes that most strongly impacted the frequency of cyberbullying. She conducts an OLS regression. What statistic do you advise her to use in her discussion? Why?arrow_forwardYou are analyzing a dataset with 932 datapoints. You decide to create a linear regression model with this dataset, using 18 predictor variables. Using this information, what is the degrees of freedom associated with the sum of squares total (total sum of squares) of your analysis?arrow_forward
- What are the Standard Errors for Fixed Effects Regression?arrow_forwardIn the setting of Multiple Regression Model (MRM), what do we mean by linear statistical models? Give example of a non-linear MRM with two predictors.arrow_forwardA researcher plans to study the causal effect of police on crime using data from a random sample of U.K. counties. He plans to regress the county’s crime rate on the (per capita) size of the county’s police force. Explain why this regression is likely to suffer from omitted variable bias. Which variable would you add to the regression to controlfor important omitted variable? Determine whether the regression will likely over or underestimate the effect of police on the crime rate?arrow_forward
arrow_back_ios
SEE MORE QUESTIONS
arrow_forward_ios
Recommended textbooks for you
- Text book imageMATLAB: An Introduction with ApplicationsStatisticsISBN:9781119256830Author:Amos GilatPublisher:John Wiley & Sons IncText book imageProbability and Statistics for Engineering and th...StatisticsISBN:9781305251809Author:Jay L. DevorePublisher:Cengage LearningText book imageStatistics for The Behavioral Sciences (MindTap C...StatisticsISBN:9781305504912Author:Frederick J Gravetter, Larry B. WallnauPublisher:Cengage Learning
- Text book imageElementary Statistics: Picturing the World (7th E...StatisticsISBN:9780134683416Author:Ron Larson, Betsy FarberPublisher:PEARSONText book imageThe Basic Practice of StatisticsStatisticsISBN:9781319042578Author:David S. Moore, William I. Notz, Michael A. FlignerPublisher:W. H. FreemanText book imageIntroduction to the Practice of StatisticsStatisticsISBN:9781319013387Author:David S. Moore, George P. McCabe, Bruce A. CraigPublisher:W. H. Freeman
Text book image
MATLAB: An Introduction with Applications
Statistics
ISBN:9781119256830
Author:Amos Gilat
Publisher:John Wiley & Sons Inc
Text book image
Probability and Statistics for Engineering and th...
Statistics
ISBN:9781305251809
Author:Jay L. Devore
Publisher:Cengage Learning
Text book image
Statistics for The Behavioral Sciences (MindTap C...
Statistics
ISBN:9781305504912
Author:Frederick J Gravetter, Larry B. Wallnau
Publisher:Cengage Learning
Text book image
Elementary Statistics: Picturing the World (7th E...
Statistics
ISBN:9780134683416
Author:Ron Larson, Betsy Farber
Publisher:PEARSON
Text book image
The Basic Practice of Statistics
Statistics
ISBN:9781319042578
Author:David S. Moore, William I. Notz, Michael A. Fligner
Publisher:W. H. Freeman
Text book image
Introduction to the Practice of Statistics
Statistics
ISBN:9781319013387
Author:David S. Moore, George P. McCabe, Bruce A. Craig
Publisher:W. H. Freeman