MATLAB: An Introduction with Applications
MATLAB: An Introduction with Applications
6th Edition
ISBN: 9781119256830
Author: Amos Gilat
Publisher: John Wiley & Sons Inc
expand_more
expand_more
format_list_bulleted
Bartleby Related Questions Icon
Related questions
Question
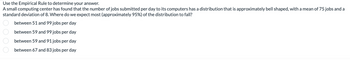
Transcribed Image Text:Use the Empirical Rule to determine your answer.
A small computing center has found that the number of jobs submitted per day to its computers has a distribution that is approximately bell shaped, with a mean of 75 jobs and a
standard deviation of 8. Where do we expect most (approximately 95%) of the distribution to fall?
oooo
between 51 and 99 jobs per day
between 59 and 99 jobs per day
between 59 and 91 jobs per day
between 67 and 83 jobs per day
Transcribed Image Text:Administrators at a large university want to know the average debt incurred by their graduates. Surveys were mailed to 110 graduating seniors asking them to report their total
student loan debt. Identify the population and sample in the study.
0 0 00
The population of interest is the entire set of all graduates of the university. The sample is the group of 110 graduating seniors that were collected by the university
administrators.
The population is the group of 110 graduating seniors that were collected by the university administrators. The sample of interest is the entire set of all graduates of the
university.
The population of interest is the entire set of all graduates of the university. The sample is the entire set of all graduates of the university.
The population of interest is the group of 110 graduating seniors that were collected by the university administrators. The sample is the group of 110 graduating seniors
that were collected by the university administrators.
Expert Solution
Check MarkThis question has been solved!
Explore an expertly crafted, step-by-step solution for a thorough understanding of key concepts.
bartleby
Step by stepSolved in 3 steps
Knowledge Booster
Background pattern image
Similar questions
- 2. This is a sample of 10 random seasons in the National Hockey League, Wayne Gretzky scored 50% more points than anyone who ever played professional hockey. He accomplished this amazing feat while playing in 280 fewer games than Gordie Howe, the previous record holder. Here are the number of games Gretzky played during each season.45 70 73 73 74 78 79 80 80 82 a. Find the mean and standard deviation for the data above. (You do not need to show work, use technology as needed especially for standard deviation).b. Find the five-number summary.arrow_forwardWhich statement about the normal distribution is false? Approximately 68 % of the data lie within 1 standard deviation of the mean. Approximately 99.7% of the data lie within 3 standard deviation of the mean. None of these is true. Approximately 95% of the data lie within 2 standard deviation of the mean. SAMSUNG C Oll % & ★arrow_forwardMotorcycles. The number of motorcyclists killed in motor vehicle traffic crashes in the U.S. in a 7 year span is below. Round your answers to 1 decimal place. 4848 4946 4688 5097 4769 4816 4907 a. Find the mean. deathsb. Find the standard deviation. deathsarrow_forward
- The National Football League (NFL) polls fans to develop a rating for each football game. Each game is rated on a scale from 0 (forgettable) to 100 (memorable). The fan ratings for a random sample of 12 games follow. 58 60 85 75 71 72 20 57 79 79 83 74 a. Develop a point estimate of mean fan rating for the population of NFL games (to 2 decimals). b. Develop a point estimate of the standard deviation for the population of NFL games (to 4 decimals).arrow_forwardThe National Football League (NFL) polls fans to develop a rating for each football game. Each game is rated on a scale from 0 (forgettable) to 100 (memorable). The fan ratings for a random sample of 12 games follow. 56 60 86 75 72 72 21 57 81 79 83 73 a. Develop a point estimate of mean fan rating for the population of NFL games (to 2 decimals). b. Develop a point estimate of the standard deviation for the population of NFL games (to 4 decimals).arrow_forward2000 freshmen at State University took a biology test. The scores were distributed normally with a mean of 70 and a standard deviation of 5. Answer the following questions based on the data. (Don't forget to put the %) 0.0015 55 02351 60 0135 65 0.34 0.34 70 0.135 75 Type a response 10.023 80 * 0.0015 ✓ 85 21. What percentage of scores are between 65 and 75? (Don't forget to put the %) 1arrow_forward
- The number of potholes in any given 1 mile stretch of freeway pavement in Pennsylvania has a bell-shaped distribution. This distribution has a mean of 44 and a standard deviation of 11. Using the empirical rule, what is the approximate percentage of 1-mile long roadways with potholes numbering between 22 and 55?Do not enter the percent symbol.ans = ___________ %arrow_forwardSalaries for teachers in a particular elementary school district are normally distributed with a mean of 42,000ドル and a standard deviation of 6,200ドル. We randomly survey 10 teachers from that district. Part (a) + Part (b) O Part (c) Part (d) Part (e) E Part (f) O Part (g) Find the 90th percentile for an individual teacher's salary. (Round your answer to the nearest whole number.) $ O Part (h) Find the 90th percentile for the average teachers' salary. (Round your answer to the nearest whole number.) $ Part (i) Part (j) O Part (k) Find the probability that an individual teacher earns more than 39,000ドル. (Round your answer to four decimal places.) O Part (1) Find the probability that the average salary for the sample is more than S39,000. (Round your answer to four decimal places.) Additional Materials Readingarrow_forwardA statistician wants to estimate the mean loss suffered by Delta pilots in the labor negotiations to lower Delta salaries to within 2500ドル with 95% confidence. From a first small survey, the standard deviation of the loss is estimated at 10,000ドル. What size sample should the statistician select? 1206 44 7 None of the abovearrow_forward
- Approximate the mean and standard deviation for age.arrow_forwardEsp Heavy children: Are children heavier now than they were in the past? The National Health and Nutrition Examination Survey (NHANES) taken between 1999 and 2002 reported that the mean weight of six-year-old girls in the United States was 49.3 pounds. Another NHANES survey, published in 2008, reported that a sample of 193 six-year-old girls weighed between 2003 and 2006 had an average weight of 52 pounds. Assume the population standard deviation is o =16 pounds. Can you conclude that the mean weight of six-year-old girls in 2006 is different from what it was in 2002? Use the a =0.01 level of significance and the critical value method. 00 Part: 0/ 5 Part 1 of 5 (a) State the appropriate null and alternate hypotheses. H.: OD O=0 dl. H : This hypothesis test is a (Choose one) test. 00arrow_forwardrefer to image belowarrow_forward
arrow_back_ios
SEE MORE QUESTIONS
arrow_forward_ios
Recommended textbooks for you
- Text book imageMATLAB: An Introduction with ApplicationsStatisticsISBN:9781119256830Author:Amos GilatPublisher:John Wiley & Sons IncText book imageProbability and Statistics for Engineering and th...StatisticsISBN:9781305251809Author:Jay L. DevorePublisher:Cengage LearningText book imageStatistics for The Behavioral Sciences (MindTap C...StatisticsISBN:9781305504912Author:Frederick J Gravetter, Larry B. WallnauPublisher:Cengage Learning
- Text book imageElementary Statistics: Picturing the World (7th E...StatisticsISBN:9780134683416Author:Ron Larson, Betsy FarberPublisher:PEARSONText book imageThe Basic Practice of StatisticsStatisticsISBN:9781319042578Author:David S. Moore, William I. Notz, Michael A. FlignerPublisher:W. H. FreemanText book imageIntroduction to the Practice of StatisticsStatisticsISBN:9781319013387Author:David S. Moore, George P. McCabe, Bruce A. CraigPublisher:W. H. Freeman
Text book image
MATLAB: An Introduction with Applications
Statistics
ISBN:9781119256830
Author:Amos Gilat
Publisher:John Wiley & Sons Inc
Text book image
Probability and Statistics for Engineering and th...
Statistics
ISBN:9781305251809
Author:Jay L. Devore
Publisher:Cengage Learning
Text book image
Statistics for The Behavioral Sciences (MindTap C...
Statistics
ISBN:9781305504912
Author:Frederick J Gravetter, Larry B. Wallnau
Publisher:Cengage Learning
Text book image
Elementary Statistics: Picturing the World (7th E...
Statistics
ISBN:9780134683416
Author:Ron Larson, Betsy Farber
Publisher:PEARSON
Text book image
The Basic Practice of Statistics
Statistics
ISBN:9781319042578
Author:David S. Moore, William I. Notz, Michael A. Fligner
Publisher:W. H. Freeman
Text book image
Introduction to the Practice of Statistics
Statistics
ISBN:9781319013387
Author:David S. Moore, George P. McCabe, Bruce A. Craig
Publisher:W. H. Freeman