Related questions
The problem requires the use of parallel arrays, methods, reading the data from the file and the use of proper formatting techniques. This is a java program.
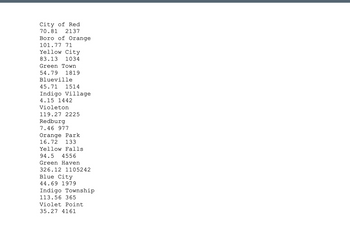
You have been asked to write an analysis of the Mice population by town in New Jersey. The
accompanying file contains data about each town. The format of the file is the name of the town, square miles and the number
of Mice counted. You will need to produce the report as follow:
Township Square Mice Mice Per Mice/Flea Flea Threat
Name Miles Population Square Mile Coefficient Indicator
Green Town 158.98 9865 62.05 0.39 ORANGE
The Mice/Flea coefficient is calculated by dividing the number (Mice per square mile)/Square miles.
The higher the coefficient the denser the Mice population and the greater the threat of Flea
infestation to humans. The
Flea threat is indicated by a color to indicate the danger to human for diseases such as Murine
typhus disease as follows:
Flea Threat Threat Indicator
Less than equal to 0.35 RED
Greater Than 0.35 and less than or equal to 0.50 ORANGE
Greater Than 0.50 or less than or equal to 0.65 YELLOW
Greater Than 0.65 or less than or equal to 0.75 GREEN
Greater Than 0.75 BLUE
You will create program to offer the user the ability to produce the report as show about in
alphabetical order by township name or in size order by township square mile. The program will also
allow the user to send the report to the screen, to a file or to both. You program must also allow
the user to type in the name of the township to look up the above data for the selected township.
An example of menu may be:
New Jersey Health Services
1 - Mice Report by Town
2 - Mice Report by Town Size
3 - Town Look up
0 - Exit
Your program must use parallel arrays or an array of objects to process the data. Do not use the <Array> class.
Trending nowThis is a popular solution!
Step by stepSolved in 5 steps with 6 images
- Language is C++ Lab10B: Binary Bubbles. Binary search is a very fast searching algorithm, however it requires a set of numbers to be sorted first. For this lab, create an array full of 11 integers which the user will generate. Like in the previous lab, assume that the values will be between -100 and +100. Then, using the sorting algorithm called BubbleSort, put the array in the correct order (from lowest to highest number). After this, please printthe array to the screen. Finally, search the array for the target value using Binary Search.The BinarySearch code will implement the algorithm described in the lecture slides. During this, you should print out a few key values which help Binary Search function. For example, this algorithm focuses on a low, mid, and high which correspond to the indices in the array the algorithm is currently considering and searching. Printing these values during the search process will help with debugging and fixing any issues. • BubbleSort sorts the array...arrow_forwardJAVA based programarrow_forwardin C programming Write a main function that declares an array of 100 doubles.In a for loop, assign each of the doubles a random number between 0.50 and 50.00. Here’s how.array[i] = (double) (rand() % 100 + 1) / 2.0;Output the elements of the array in 10 columns that are each 6 spaces wide. Each row in the output will have 10 values. The doubles will be printed with 2 places of accuracy past the decimal.The output of this one-dimensional array requires a single loop with an if statement inside. Even though the 100 numbers are going to be presented as a table of numbers, they are still just a list in memory.arrow_forward
- The purpose is to write a program with 2D arrays that will display Knight's Tour. Knight's Tour is a fascinating problem that is done on an electronic chessboard with a knight. Starting at any location on the chessboard, a knight proceeds to move on the board in such a manner that all positions on the chessboard are visited, once and once only. The knight may only move according to the rules of chess playing. The matrixes below show a sequence of knight moves that starts from the top-left corner. In most cases, the knight is locked in place and can go no farther. Note: there are only 3 legal knight moves from the 44 locations and they have already been visited. 01 60 39 34 31 18 09 6438 35 32 61 10 63 30 1759 02 37 40 33 28 19 0836 49 42 27 62 11 16 2943 58 03 50 41 24 07 2048 51 46 55 26 21 12 1557 44 53 04 23 14 25 0652 47 56 45 54 05 22 13 01 22 39 20 03 18 09 1600 37 02 23 08 15 04 1335 40 21 38 19 12 17 1000 00 36 41 24 07 14 0500 34 00 32 00 28 11 2600 00 00 00 42 25 06 2900...arrow_forwardThe purpose is to write a program with 2D arrays that will display Knight's Tour. Knight's Tour is a fascinating problem that is done on an electronic chessboard with a knight. Starting at any location on the chessboard, a knight proceeds to move on the board in such a manner that all positions on the chessboard are visited, once and once only. The knight may only move according to the rules of chess playing. The matrixes below show a sequence of knight moves that starts from the top-left corner. In most cases, the knight is locked in place and can go no farther. Note: there are only 3 legal knight moves from the 44 locations and they have already been visited. 01 60 39 34 31 18 09 6438 35 32 61 10 63 30 1759 02 37 40 33 28 19 0836 49 42 27 62 11 16 2943 58 03 50 41 24 07 2048 51 46 55 26 21 12 1557 44 53 04 23 14 25 0652 47 56 45 54 05 22 13 01 22 39 20 03 18 09 1600 37 02 23 08 15 04 1335 40 21 38 19 12 17 1000 00 36 41 24 07 14 0500 34 00 32 00 28 11 2600 00 00 00 42 25 06 2900...arrow_forwardNO REGEX OR ANYTHING COMPLICATED PLEASE.. USE BASIC APPROACH Create a program in Python that reads data from Breakfast Menu (https://www.w3schools.com/xml/simple.xml) and builds parallel arrays for the menu items, with each array containing the menu item name, description, calories, and price, respectively. After reading the data and building the arrays, display the menu items similar to the following: name - description - calories - priceAt the bottom, display the total number of items on the menu, the average number of calories per item, and the average price per item similar to: 0 items - 0 average calories - 0ドル.00 average price You may either read the page using Internet processing methods, or you may download and save the page and then read the data from the saved file. You must process the data using string functions (no XML libraries). must use separate subroutines/functions/methods to implement each type of processing, and include error handling for missing or invalid...arrow_forward
- Write a program in C or Java to sort elements of array in ascending order.Test Data :Input the size of array : 5Input 5 elements in the array :element - 0 : 2element - 1 : 7element - 2 : 4element - 3 : 5element - 4 : 9Expected Output :Elements of array in sorted ascending order:2 4 5 7 9arrow_forwardWrite a program called DeliveryCharges for the package delivery service in Exercise 4. The program should again use an array that holds the 10 zip codes of areas to which the company makes deliveries. Create a parallel array containing 10 delivery charges that differ for each zip code. Prompt a user to enter a zip code, and then display either a message indicating the price of delivery to that zip code or a message indicating that the company does not deliver to the requested zip code. In C# form please.arrow_forwardIn this project you will generate a poker hand containing five cards randomly selected from a deck of cards. The names of the cards are stored in a text string will be converted into an array. The array will be randomly sorted to "shuffle" the deck. Each time the user clicks a Deal button, the last five cards of the array will be removed, reducing the size of the deck size. When the size of the deck drops to zero, a new randomly sorted deck will be generated. A preview of the completed project with a randomly generated hand is shown in Figure 7-50.arrow_forward
- Text book imageDatabase System ConceptsComputer ScienceISBN:9780078022159Author:Abraham Silberschatz Professor, Henry F. Korth, S. SudarshanPublisher:McGraw-Hill EducationText book imageStarting Out with Python (4th Edition)Computer ScienceISBN:9780134444321Author:Tony GaddisPublisher:PEARSONText book imageDigital Fundamentals (11th Edition)Computer ScienceISBN:9780132737968Author:Thomas L. FloydPublisher:PEARSON
- Text book imageC How to Program (8th Edition)Computer ScienceISBN:9780133976892Author:Paul J. Deitel, Harvey DeitelPublisher:PEARSONText book imageDatabase Systems: Design, Implementation, & Manag...Computer ScienceISBN:9781337627900Author:Carlos Coronel, Steven MorrisPublisher:Cengage LearningText book imageProgrammable Logic ControllersComputer ScienceISBN:9780073373843Author:Frank D. PetruzellaPublisher:McGraw-Hill Education