Glencoe Algebra 1, Student Edition, 9780079039897, 0079039898, 2018
Glencoe Algebra 1, Student Edition, 9780079039897, 0079039898, 2018
18th Edition
ISBN: 9780079039897
Author: Carter
Publisher: McGraw Hill
expand_more
expand_more
format_list_bulleted
Bartleby Related Questions Icon
Related questions
Question
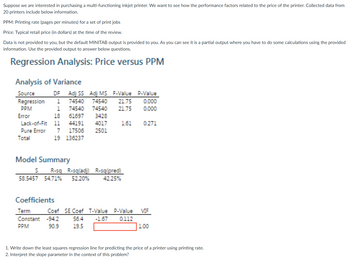
Transcribed Image Text:Suppose we are interested in purchasing a multi-functioning inkjet printer. We want to see how the performance factors related to the price of the printer. Collected data from
20 printers include below information.
PPM: Printing rate (pages per minutes) for a set of print jobs
Price: Typical retail price (in dollars) at the time of the review.
Data is not provided to you, but the default MINITAB output is provided to you. As you can see it is a partial output where you have to do some calculations using the provided
information. Use the provided output to answer below questions.
Regression Analysis: Price versus PPM
Analysis of Variance
DF Adj SS Adj MS F-Value P-Value
Source
Regression 1
PPM
1
74540
74540 74540
74540 21.75
0.000
21.75 0.000
Error
18
Lack-of-Fit 11
44191
Pure Error 7
17506
61697 3428
4017
2501
161
0.271
Total
19 136237
Model Summary
S
58.5457
R-sq R-sq(adj) R-sq(pred)
54.71%
52.20%
42.25%
Coefficients
Term
Coef SE Coef T-Value
Constant
PPM
-94.2
90.9
56.4
-1.67
P-Value VIF
0.112
19.5
100
1. Write down the least squares regression line for predicting the price of a printer using printing rate.
2. Interpret the slope parameter in the context of this problem?
![画像:3. We want to test if printers with higher printing rate are more expensive. Write the appropriate null and alternative hypothesis you would formulate to test this, calculate the test statistic and the p value. Based on the p value you obtained, what can you say about the relationship? • What are the appropriate null and alternative hypothesis you would formulate to test this? [Select] • What is the test statistic? [Select] ° ° • What is the p value? [Select] • What are the test decision and conclusion? [Select] 4. What is the correlation between PPM and the price? [Select] >](https://content.bartleby.com/qna-images/question/c6389447-1237-4af0-b5c6-eb1260425b55/582e5020-f571-40fb-b614-664941b779ee/gr1pad_thumbnail.png)
Transcribed Image Text:3. We want to test if printers with higher printing rate are more expensive. Write the appropriate null
and alternative hypothesis you would formulate to test this, calculate the test statistic and the p
value. Based on the p value you obtained, what can you say about the relationship?
• What are the appropriate null and alternative hypothesis you would formulate to test this?
[Select]
• What is the test statistic? [Select]
°
°
• What is the p value?
[Select]
• What are the test decision and conclusion? [Select]
4. What is the correlation between PPM and the price? [Select]
>
Expert Solution
Check MarkThis question has been solved!
Explore an expertly crafted, step-by-step solution for a thorough understanding of key concepts.
bartleby
Step by stepSolved in 2 steps with 3 images
Knowledge Booster
Background pattern image
Recommended textbooks for you
- Text book imageGlencoe Algebra 1, Student Edition, 9780079039897...AlgebraISBN:9780079039897Author:CarterPublisher:McGraw HillText book imageText book image
- Text book imageMathematics For Machine TechnologyAdvanced MathISBN:9781337798310Author:Peterson, John.Publisher:Cengage Learning,Text book imageTrigonometry (MindTap Course List)TrigonometryISBN:9781337278461Author:Ron LarsonPublisher:Cengage LearningText book imageHolt Mcdougal Larson Pre-algebra: Student Edition...AlgebraISBN:9780547587776Author:HOLT MCDOUGALPublisher:HOLT MCDOUGAL
Text book image
Glencoe Algebra 1, Student Edition, 9780079039897...
Algebra
ISBN:9780079039897
Author:Carter
Publisher:McGraw Hill
Text book image
Text book image
Text book image
Mathematics For Machine Technology
Advanced Math
ISBN:9781337798310
Author:Peterson, John.
Publisher:Cengage Learning,
Text book image
Trigonometry (MindTap Course List)
Trigonometry
ISBN:9781337278461
Author:Ron Larson
Publisher:Cengage Learning
Text book image
Holt Mcdougal Larson Pre-algebra: Student Edition...
Algebra
ISBN:9780547587776
Author:HOLT MCDOUGAL
Publisher:HOLT MCDOUGAL