MATLAB: An Introduction with Applications
MATLAB: An Introduction with Applications
6th Edition
ISBN: 9781119256830
Author: Amos Gilat
Publisher: John Wiley & Sons Inc
expand_more
expand_more
format_list_bulleted
Bartleby Related Questions Icon
Related questions
Question
Transcribed Image Text:Translate
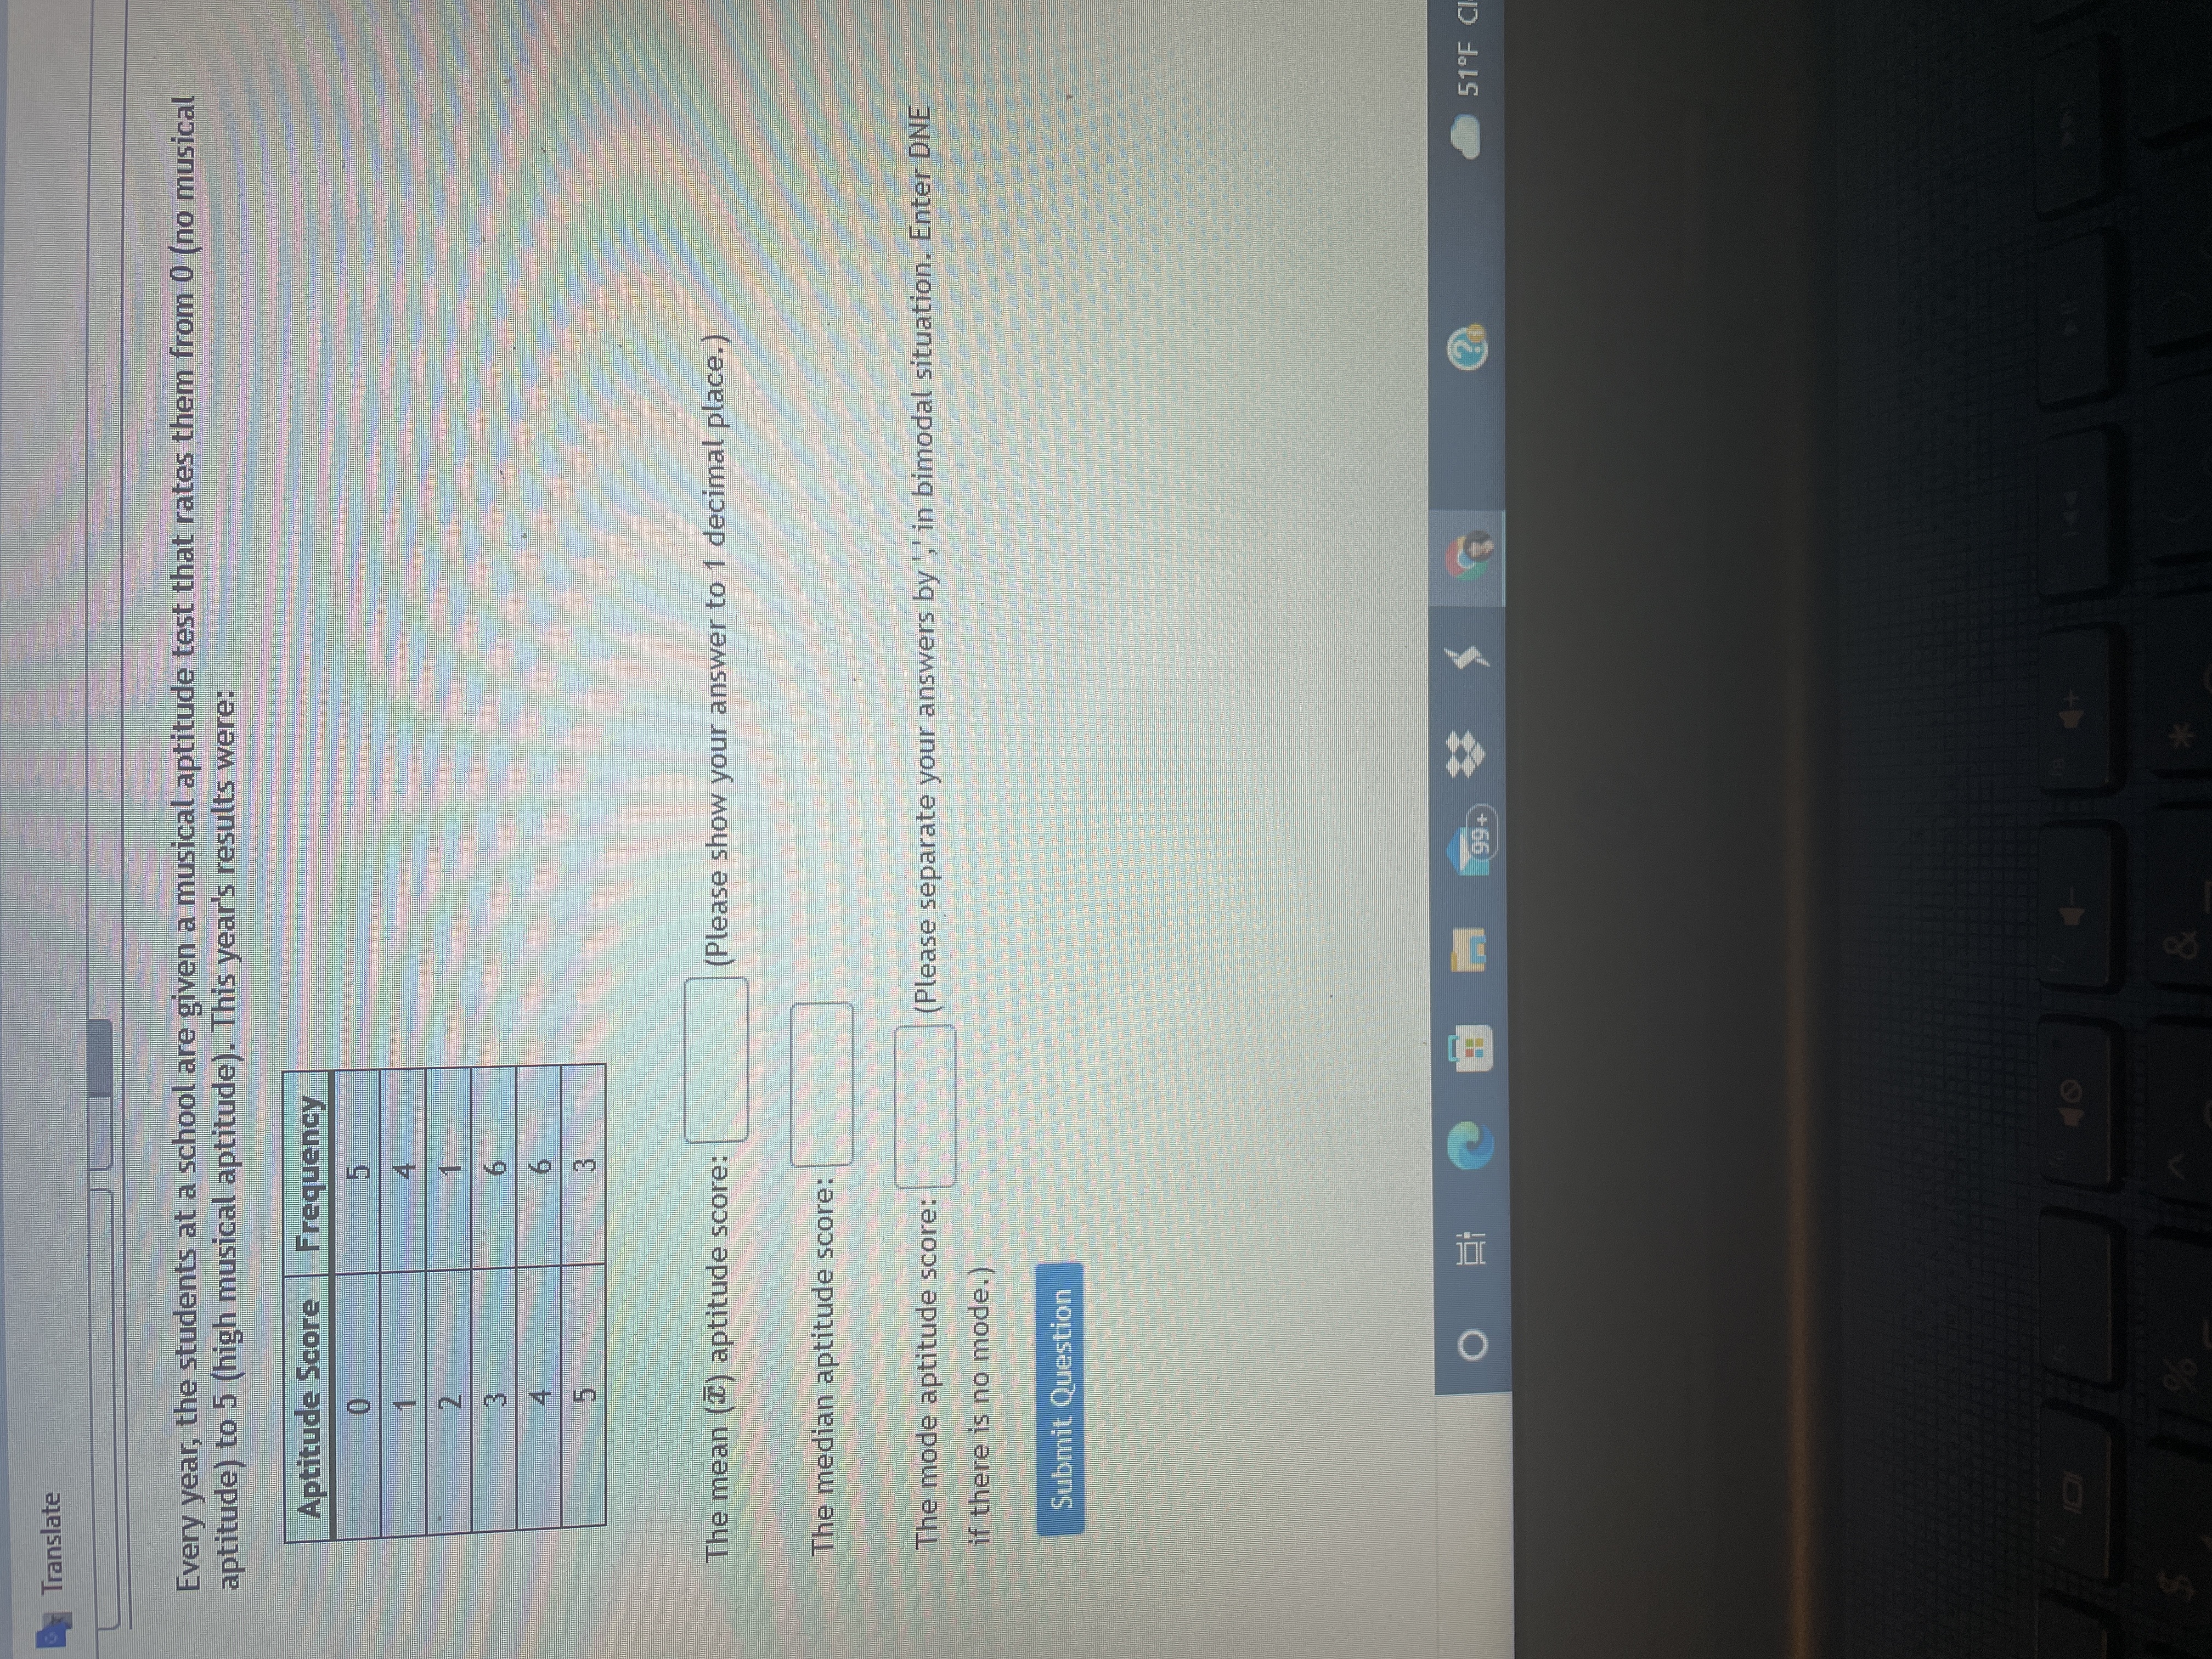
Every year, the students ata school are given a musical aptitude test that rates them from 0 (no musical
aptitude) to 5 (high musical aptitude). This year's results were:
Aptitude Score
0.
1.
2.
4.
5.
5.
4.
1.
The mean (I) aptitude score:
9.
6.
3.
The median aptitude score:
The mode aptitude score:
if there is no mode.)
Submit Question
(Please show your answer to 1 decimal place.)
(Please separate your answers by ,' in bimodal situation. Enter DNE
国 直 o|
+6)
林
OF
51°F CI
Expert Solution
Check MarkThis question has been solved!
Explore an expertly crafted, step-by-step solution for a thorough understanding of key concepts.
bartleby
Step by stepSolved in 2 steps with 3 images
Knowledge Booster
Background pattern image
Similar questions
- This problem is inspired by a study of the "gender gap" in earnings in topcorporate jobs [Bertrand and Hallock (2001)]. The study compares totalcompensation among top executives in a large set of U.S. public corporations in the 1990s. (Each year these publicly traded corporations must report total compensation levels for their top five executives.)a. Let Female be an indicator variable that is equal to 1 for females and 0for males. A regression of the logarithm of earnings onto Female yields "ln (Earnings)" = 6.48 - 0.44 Female, SER = 2.65. (0.01) (0.05)i. The estimated coefficient on Female is -0.44. Explain what thisvalue means.ii. The SER is 2.65. Explain what this value means.iii. Does this regression suggest that female top executives earn lessthan top male executives? Explain.iv. Does this regression suggest that there is gender discrimination?Explain. b. Two new variables, the market value of the firm (a measure of firmsize, in millions of...arrow_forwardSolve this questionarrow_forwardThe reaction times of ten subjects was measured. The median reaction time was 3.7s seconds. The reaction times of nine of the subjects were 3.5s, 3.5s, 3.5s, 3.6s, 3.7s, 3.8s, 3.8s, 3.9s, 3.9s. Was the tenth reaction time?arrow_forward
- Hannyarrow_forwardth Last year over 8000 students took an entrance exam at a certain state university. Tom's score was at the 55 percentile. Leila's score was at the 86 percentile. (a) Which of the following must be true about Tom's and Leila's scores? O Tom scored higher than Leila. O Both Tom and Leila scored higher than the median. O Leila answered 31 more questions correctly than Tom. O Tom's and Leila's scores were both in the bottom half of all scores. (b) Which of the following must be true about Tom's score? O Tom scored lower than about 55% of the students who took the exam. O Tom got about 55% of the questions correct. Tom scored higher than about 55% of the students who took the exam. Tom got about 55% of the questions wrong. Submit Assignme Continue iert 144 %23 4. 6. 8 R Y U H K L A. D paus V. B M alt ctri alt USE YOUR Dew de LLarrow_forwardquestion: mark achieved 48 marks on the last test. Calculate his percentile. What mark would give the 80th percentile? marks: 22, 26, 30, 34, 38, 40, 43, 46, 48, 48, 49, 52, 56, 56, 66, 72, 72, 79, 81, 88 please show all steps.arrow_forward
- On a 5 question multiple choice test there are five possible answers, of which one is correct. Find the mean of the number of questions students guess correctly. Find the standard error of the number of questions guess correctly.arrow_forwardPlease do a-carrow_forwardChoose the best statement to summarize the association shown between hat size and IQ in the scatterplot below. Hat Size O The scatterplot does not show a trend that would indicate an association between hat size and IQ scores. O As hat size increases, IQ scores tend to decrease. O As hat size increases, IQ scores tend to increase. Hat size causes IQ to increase.arrow_forward
- What is the median?arrow_forwardHelp please with P-value. How to compute in excel or statcrunch would be helpful.arrow_forwardCan you please help me figure out the Z and P value. I can do the multiple choice on my own. Also, if you can please make it clear what the answers are that would be great often things are left vauge and I dont know which is the answer. Thank you for your help.arrow_forward
arrow_back_ios
SEE MORE QUESTIONS
arrow_forward_ios
Recommended textbooks for you
- Text book imageMATLAB: An Introduction with ApplicationsStatisticsISBN:9781119256830Author:Amos GilatPublisher:John Wiley & Sons IncText book imageProbability and Statistics for Engineering and th...StatisticsISBN:9781305251809Author:Jay L. DevorePublisher:Cengage LearningText book imageStatistics for The Behavioral Sciences (MindTap C...StatisticsISBN:9781305504912Author:Frederick J Gravetter, Larry B. WallnauPublisher:Cengage Learning
- Text book imageElementary Statistics: Picturing the World (7th E...StatisticsISBN:9780134683416Author:Ron Larson, Betsy FarberPublisher:PEARSONText book imageThe Basic Practice of StatisticsStatisticsISBN:9781319042578Author:David S. Moore, William I. Notz, Michael A. FlignerPublisher:W. H. FreemanText book imageIntroduction to the Practice of StatisticsStatisticsISBN:9781319013387Author:David S. Moore, George P. McCabe, Bruce A. CraigPublisher:W. H. Freeman
Text book image
MATLAB: An Introduction with Applications
Statistics
ISBN:9781119256830
Author:Amos Gilat
Publisher:John Wiley & Sons Inc
Text book image
Probability and Statistics for Engineering and th...
Statistics
ISBN:9781305251809
Author:Jay L. Devore
Publisher:Cengage Learning
Text book image
Statistics for The Behavioral Sciences (MindTap C...
Statistics
ISBN:9781305504912
Author:Frederick J Gravetter, Larry B. Wallnau
Publisher:Cengage Learning
Text book image
Elementary Statistics: Picturing the World (7th E...
Statistics
ISBN:9780134683416
Author:Ron Larson, Betsy Farber
Publisher:PEARSON
Text book image
The Basic Practice of Statistics
Statistics
ISBN:9781319042578
Author:David S. Moore, William I. Notz, Michael A. Fligner
Publisher:W. H. Freeman
Text book image
Introduction to the Practice of Statistics
Statistics
ISBN:9781319013387
Author:David S. Moore, George P. McCabe, Bruce A. Craig
Publisher:W. H. Freeman