Related questions
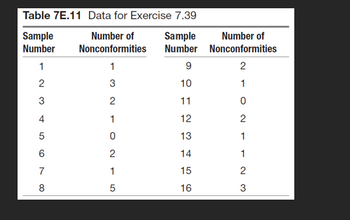
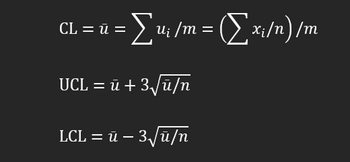
An automobile manufacturer wishes to monitor the number of nonconformities in a subassembly area producing manual transmissions. The inspection unit is defined as four transmissions, and data from 16 samples (each of size 4) are shown in Table 7E.11. a. Set up a control chart for nonconformities per unit. A u chart of average number of nonconformities per unit is appropriate, with n = 4 transmissions in each inspection. b. Do these data come from a controlled process? If not, assume that assignable causes can be found for all out-of-control points and calculate the revised control chart parameters. Draw x-bar control chart and R chart c. Suppose the inspection unit is redefined as eight transmissions. Design an appropriate control chart for monitoring future production
Step by stepSolved in 2 steps with 5 images
- Text book imageGlencoe Algebra 1, Student Edition, 9780079039897...AlgebraISBN:9780079039897Author:CarterPublisher:McGraw HillText book imageBig Ideas Math A Bridge To Success Algebra 1: Stu...AlgebraISBN:9781680331141Author:HOUGHTON MIFFLIN HARCOURTPublisher:Houghton Mifflin HarcourtText book imageHolt Mcdougal Larson Pre-algebra: Student Edition...AlgebraISBN:9780547587776Author:HOLT MCDOUGALPublisher:HOLT MCDOUGAL
- Text book imageCollege Algebra (MindTap Course List)AlgebraISBN:9781305652231Author:R. David Gustafson, Jeff HughesPublisher:Cengage Learning