Related questions
Python
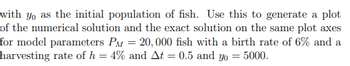
This simulates the population of fish. Use this to generate a plot with a numerical solution and the exact solution on the same plot axes for model parameters, P_m = 20,000 fish with a birth rate of b=6%, a harvesting rate of h=4%, a change in t=0.5 and y_0=5000
![画像:The differential equation has an exact solution \[ y(t) = \frac{y_0 P_M (h-b)}{(P_M(h-b) + b y_0)e^{(h-b)t} - b y_0} \] This equation describes the behavior of a variable \(y\) over time \(t\). It includes parameters such as the initial value \(y_0\), constants \(P_M\), \(h\), and \(b\). It also features an exponential term, which typically indicates a growth or decay process depending on the sign of the exponent.](https://content.bartleby.com/qna-images/question/a4aac48a-4d20-41e4-aba5-4ec9a336b2fd/00183270-d67f-4a9b-b364-a56c7b424b13/wwnivwg_thumbnail.png)
Programmatic access:
Step 1: Import the NumPy and matplotlib modules.
Step 2: Take the initial population from the user and store it in the integer variable y0. Take the birth rate from the user and store it in the b variable. Take the time step size from the user and store it in the float dt variable. Take the number of days from the user and store it in an integer variable n.
Step 3: Create a variable yn for the maximum population and initialize it with a value of 20,000.
Step 4: Create an array t from 0 to (n+1)*dt with n+2 elements.
Step 5: Create an N array with n+2 zeros.
Step 6: Store the initial file y0 as the first element of the N array.
Step 7: Fill in the N fields using the forward Euler method.
Step 8: Plot the graph using xlabels, ylabels, and legends.
Step by stepSolved in 2 steps with 2 images
- IN PYTHON A tridiagonal matrix is one where the only nonzero elements are the ones on the main diagonal and the ones immediately above and below it.Write a function that solves a linear system whose coefficient matrix is tridiag- onal. In this case, Gauss elimination can be made much more efficient because most elements are already zero and don't need to be modified or added. As an example, consider a linear system Ax = b with 100,000 unknowns and the same number of equations. The coefficient matrix A is tridiagonal, with all elements on the main diagonal equal to 3 and all elements on the diagonals above and below it equal to 1. The vector of constant terms b contains all ones, except that the first and last elements are zero. You can use td to find that x1= −0.10557. The following code format should help: def td(l, m, u, b): '''Solve a linear system Ax = b where A is tridiagonal Inputs: l, lower diagonal of A, n-1 vector m, main diagonal of A, n vector u,...arrow_forwardGiven a vector of real numbers r = (r1, V2, ..., rn). We can standardize the vector using the formulation: V; = "im, where m is the ri-m mean of the vector r, and s is the standard deviation of r. The vector v = (V1, V2, . , Un) will be the scaled vector. ... 9 Write a Python function scale_vec(r) that takes the vector r as input and returns the scaled vector v. Sample inputs and outputs: • Input: np.array([1, 3, 5]), output: [-1.22474487 0. 1.22474487] Input: np.array([3.3, 1.2, -2.7, −0.6]), output: [1.35457092 0.40637128 -1.35457092 -0.40637128] Hint: Use numpy.mean and numpy.std with default parameters. [ ] # Write your function here Let's test your function. [ ] import numpy as np print (scale_vec(np.array ( [1, 3, 5]))) print (scale_vec(np.array([3.3, 1.2, -2.7, -0.6])))arrow_forwardWrite a Python function to run a Parking Lot (PL) simulation, called PLSimulation, which takes four integers as parameters: • The first parameter (minArriving) is the minimum number of cars that can park in the PL during one hour. • The second parameter (maxArriving) is the maximum that can park during one hour. • The third parameter (maxLeaving) is the maximum number of cars that may leave the PL during one hour. • The fourth parameter (hours) is the number of hours to run the simulation. Your function should simulate parking and leaving cars for the specified number of hours. In each hour, the following occurs in this order: 1. A random number of cars arrive, ready to park (between the minimum and maximum). That number is added to a count of the number waiting to park. 2. The maximum number of cars that may leave, allowing the same number of cars to park, so that number is subtracted from the count of the number waiting to park (if there are that many waiting to park). Initially, the...arrow_forward
- Use Python. Q1. Suppose deg is an angle in degrees. Write down the NumPy code that computes the counterclockwise rotation matrix. Don't forget to convert the angles into radians when necessary. def rotate(deg): Q2. Let x be a vector. How do you use rotate(deg) to find a vector y that is normal to x? Namely <x,y> = 0. y = ... Q3. Let x be a vector. How do you find a vector v in the same direction as x but with |v| = 1. v = ... Q4. A hyperplane in 2D is the same as a line. A hyperplane is defined by a normal vector w and a bias scalar b. Write down the expression that defines points on the line that is the hyperplane in 2D defined by (w, b). { x : ... } Q5. Given a vector x, and a hyperplane P defined by (w, b). Describe how to compute the point v that is the projection of x on to the plane P.arrow_forwardProgramming language is C. I would really be appriciate if you could help me with this. Please provide me with your cashapp, so I can tip you for your work. THANK YOU:) In this project, we shall simulate the operations of an ATM machine. Suppose you’re in charge of this simulation and here is a scenario of what is required to do: The customer will be assigned a random or fixed number for his/her balance. First, the customer is prompted to enter his personal identification number pin (for this case study, we test only if this pin is formed by 4 digits! otherwise, a message like "Invalid PIN, try again . . ." will be displayed) and the user is re-prompted to enter the pin. The customer is given three chances to enter his pin. If he/she fails during the three trials you display a message like "Sorry you can’t continue, contact your bank for assistance!" If the pin is correct (formed by 4 digits), then the system will ask the customer for the receipt ( 1 for YES and 2 for NO ) and a menu...arrow_forwardIn Python, write a function that produces plots of statistical power versus sample size for simple linear regression. The function should be of the form LinRegPower(N,B,A,sd,nrep), where N is a vector/list of sample sizes, B is the true slope, A is the true intercept, sd is the true standard deviation of the residuals, and nrep is the number of simulation replicates. The function should conduct simulations and then produce a plot of statistical power versus the sample sizes in N for the hypothesis test of whether the slope is different than zero. B and A can be vectors/lists of equal length. In this case, the plot should have separate lines for each pair of A and B values (A[1] with B[1], A[2] with B[2], etc). The function should produce an informative error message if A and B are not the same length. It should also give an informative error message if N only has a single value. Demonstrate your function with some sample plots. Find some cases where power varies from close to zero to...arrow_forward
- Create a program in Python that takes a user's inputted set of data points, x and y values, until the user enters q to quit. The program should then ask the user for any x value and then have a y value returned, where the y value is the best estimate, using linear interpolation/extrapolation, from the nearest x value. The user should be able to repeatedly interpolate or extrapolate until they enter q.arrow_forwardGiven a vector of N positive integers and an integer X. The task is to find the frequency of X in vector. Example 1: Input: N = 5 vector {1, 1, 1, 1, 1} X = 1 Output: 5 Explanation: Frequency of 1 is 5.arrow_forwardFirst, implement a python class called Student. This class should store 2 variables, name and grade. Later, implement a class called Classroom. The constructor of this class should input the list of students in this classrom. This class should also contain 3 methods, add_student, remove_student and calculate_stats. As the names suggest, add_student method should input a Student object and add that to its' already existing student list, remove_student must input a full name(string) and delete the student with the provided name(you can assume no 2 students have the same full name). Finally, calculate_stats method must calculate and print the following statistics of the grades: 1. The name of the student with highest grade and the grade itself. 2. The name of the student with lowest grade and the grade itself. 3. The average gradearrow_forward
- Given a vector of real numbers r = (r1, r2, ..., rm). We can standardize the vector using the formulation: vi = "im, where m ri-m is the mean of the vector r, and s is the standard deviation of r. The vector v = (v1, v2, ..., Un) will be the scaled vector. Write a Python function scale_vec (r) that takes the vector r as input and returns the scaled vector v. Sample inputs and outputs: ●くろまる Input: np.array([1, 3, 5]), output: [-1.22474487 0. 1.22474487] • Input: np. array([3.3, 1.2, -2.7, -0.6]), output: [1.35457092 0.40637128 -1.35457092 -0.40637128] Hint: Use numpy.mean and numpy.std with default parameters. # Write your function here. Let's test your function. [ ] import numpy as np print (scale_vec (np.array([1, 3, 5]))) print (scale_vec (np.array([3.3, 1.2, -2.7, -0.6])))arrow_forwardIn Python, Compute the: sum of squares total (SST), sum of squares regression (SSR), sum of squares error(SSE), and the r, R^2 values. You can use the sum() and mean() built-in functions. Here are the x and y values to use. x = [-5,-1,3,7,5,10] y = [-10,-3,5,8,7,10]arrow_forwardWrite answer in c++arrow_forward
- Text book imageDatabase System ConceptsComputer ScienceISBN:9780078022159Author:Abraham Silberschatz Professor, Henry F. Korth, S. SudarshanPublisher:McGraw-Hill EducationText book imageStarting Out with Python (4th Edition)Computer ScienceISBN:9780134444321Author:Tony GaddisPublisher:PEARSONText book imageDigital Fundamentals (11th Edition)Computer ScienceISBN:9780132737968Author:Thomas L. FloydPublisher:PEARSON
- Text book imageC How to Program (8th Edition)Computer ScienceISBN:9780133976892Author:Paul J. Deitel, Harvey DeitelPublisher:PEARSONText book imageDatabase Systems: Design, Implementation, & Manag...Computer ScienceISBN:9781337627900Author:Carlos Coronel, Steven MorrisPublisher:Cengage LearningText book imageProgrammable Logic ControllersComputer ScienceISBN:9780073373843Author:Frank D. PetruzellaPublisher:McGraw-Hill Education