Algebra & Trigonometry with Analytic Geometry
Algebra & Trigonometry with Analytic Geometry
13th Edition
ISBN: 9781133382119
Author: Swokowski
Publisher: Cengage
expand_more
expand_more
format_list_bulleted
Bartleby Related Questions Icon
Related questions
Question
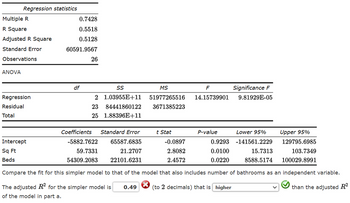
Transcribed Image Text:Regression statistics
Multiple R
0.7428
R Square
0.5518
Adjusted R Square
0.5128
Standard Error
60591.9567
Observations
26
ANOVA
df
SS
MS
Regression
2 1.03955E+11
Residual
51977265516
23 84441860122 3671385223
Total
25 1.88396E+11
F
14.15739901
Significance F
9.81929E-05
Coefficients
Standard Error
t Stat
P-value
Lower 95%
Upper 95%
Intercept
Sq Ft
-5882.7622
65587.6835
-0.0897
0.9293 -141561.2229
59.7331
54309.2083
21.2707
22101.6231
2.8082
2.4572
Beds
0.0100
0.0220
15.7313
8588.5174
129795.6985
103.7349
100029.8991
Compare the fit for this simpler model to that of the model that also includes number of bathrooms as an independent variable.
The adjusted R2 for the simpler model is
of the model in part a.
0.49
(to 2 decimals) that is higher
than the adjusted R2
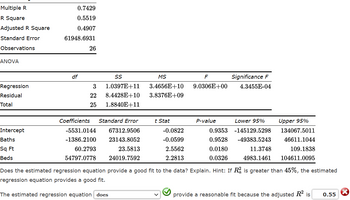
Transcribed Image Text:Multiple R
0.7429
R Square
0.5519
Adjusted R Square
0.4907
Standard Error
61948.6931
Observations
26
ANOVA
SS
1.0397E+11
MS
3.4656E+10
F
9.0306E+00
22 8.4428E+10 3.8376E+09
df
Regression
3
Residual
Total
Significance F
4.3455E-04
25 1.8840E+11
Coefficients
Standard Error
t Stat
P-value
Lower 95%
Intercept
Baths
-5531.0144
-1386.2100
67312.9506
23143.8052
-0.0822
0.9353
-145129.5298
-0.0599
0.9528
-49383.5243
Upper 95%
134067.5011
46611.1044
Sq Ft
Beds
60.2793
54797.0778
23.5813
24019.7592
2.5562
0.0180
11.3748
109.1838
2.2813
0.0326
4983.1461
104611.0095
Does the estimated regression equation provide a good fit to the data? Explain. Hint: If R2 is greater than 45%, the estimated
regression equation provides a good fit.
The estimated regression equation does
provide a reasonable fit because the adjusted R2 is
0.55
Expert Solution
Check MarkThis question has been solved!
Explore an expertly crafted, step-by-step solution for a thorough understanding of key concepts.
bartleby
Step by stepSolved in 2 steps with 2 images
Knowledge Booster
Background pattern image
Recommended textbooks for you
- Text book imageAlgebra & Trigonometry with Analytic GeometryAlgebraISBN:9781133382119Author:SwokowskiPublisher:CengageText book imageMathematics For Machine TechnologyAdvanced MathISBN:9781337798310Author:Peterson, John.Publisher:Cengage Learning,Text book imageAlgebra: Structure And Method, Book 1AlgebraISBN:9780395977224Author:Richard G. Brown, Mary P. Dolciani, Robert H. Sorgenfrey, William L. ColePublisher:McDougal Littell
- Text book imageHolt Mcdougal Larson Pre-algebra: Student Edition...AlgebraISBN:9780547587776Author:HOLT MCDOUGALPublisher:HOLT MCDOUGAL
Text book image
Algebra & Trigonometry with Analytic Geometry
Algebra
ISBN:9781133382119
Author:Swokowski
Publisher:Cengage
Text book image
Mathematics For Machine Technology
Advanced Math
ISBN:9781337798310
Author:Peterson, John.
Publisher:Cengage Learning,
Text book image
Algebra: Structure And Method, Book 1
Algebra
ISBN:9780395977224
Author:Richard G. Brown, Mary P. Dolciani, Robert H. Sorgenfrey, William L. Cole
Publisher:McDougal Littell
Text book image
Holt Mcdougal Larson Pre-algebra: Student Edition...
Algebra
ISBN:9780547587776
Author:HOLT MCDOUGAL
Publisher:HOLT MCDOUGAL