Algebra and Trigonometry (6th Edition)
Algebra and Trigonometry (6th Edition)
6th Edition
ISBN: 9780134463216
Author: Robert F. Blitzer
Publisher: PEARSON
expand_more
expand_more
format_list_bulleted
Bartleby Related Questions Icon
Related questions
Question
expand button
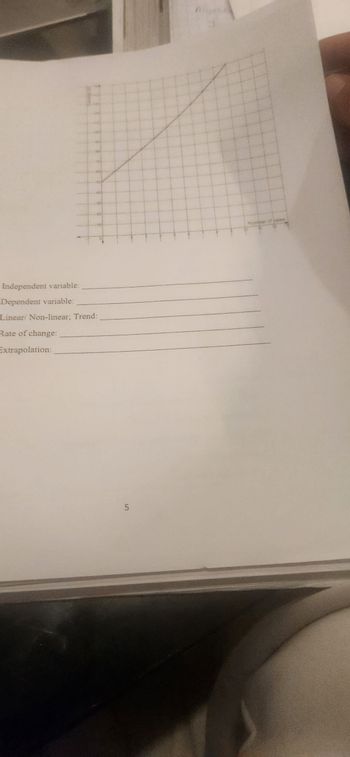
Transcribed Image Text:Independent variable:
Dependent variable:
Linear/ Non-linear; Trend:
Rate of change:
Extrapolation:
5
Number of sales
Expert Solution
Check MarkThis question has been solved!
Explore an expertly crafted, step-by-step solution for a thorough understanding of key concepts.
bartleby
Step by stepSolved in 2 steps
Knowledge Booster
Background pattern image
Similar questions
- Classify the variable below as qualitative, discrete, or continuous. The major field of study of students -- Select an Option-arrow_forwardPart II: Joe and his Dream Porsche Joe is 16 years old and has decided that he wants a brand-spankin' new Porsche Boxter Convertible, but his mom says there's no way that he could ever afford it! So, Joe has decided to show his mom that he will be able to purchase his dream car at the age of 35 if he plans his finances just right. He's asked you to help him plan. A. How much will his car cost in 19 years? The following table shows the approximate MSRP (manufacturers suggested retail price) of a Porsche Boxter Convertible from 2004 to 2008. Create a scatter plot of the data and determine the line of best fit, finding an appropriate slope and initial value assuming it started in 2004.. Year MSRP 2004 57ドル 510 2005 59ドル 130 2006 60ドル 750 2007 61ドル 965 2008 63ドル 600 B. Financing Joe's new Porsche Joe knows that he will have to put 10% down on his car. To save up for this down payment, he plans on investing a set amount monthly, starting now, into Teen's Choice Financial's Interest Plus Savings...arrow_forwardDevelop a scatterplot and explore the correlation between customer age and net sales by each type of customer (regular/promotion). Use the horizontal axis for the customer age to graph. Find the linear regression line that models the data by each type of customer. Round the rate of changes (slopes) to two decimal places and interpret them in terms of the relation between the change in age and the change in net sales. What can you conclude? Hint: Rate of Change = Vertical Change / Horizontal Change = Change in y / Change in xarrow_forward
- Do the plots show any trend? If yes, is the trend,Why or why not?arrow_forwardWhat's a good topic for a regression topic? Make sure you have two quantitative variables (for example # of siblings and heart rate). Ask for another variable like academic year, major, hobbies, favorite genre of movie. - State the independent and dependent variables and what is the population.arrow_forwardA scatterplot with no linear trend will have an r value of zero true or false?arrow_forward
- Plot the scatterplots and predicted trendlines. Observe the role and effects of SCALE,R Square,slope, p-value. " Normal babies" patient set apgar score d1 apgar score d2 1 1 1.1 2 2 2.2 3 3 3.3 4 4 4.4 5 5 5.5 6 6 6.6 7 7 7.7 8 8 8.8 9 9 9.9arrow_forwardIdentify the variable as either qualitative or quantitative.(a) months in the year (b) distance of a successful field goal during a football seasonarrow_forwardThe amount of time adults spend watching television is closely monitored by firms because this helps to determine advertising pricing for commercials. Complete parts (a) through (d). C (a) Do you think the variable "weekly time spent watching television" would be normally distributed? If not, what shape would you expect the variable to have? A. The variable "weekly time spent watching television" is likely skewed right, not normally distributed. O B. The variable "weekly time spent watching television" is likely symmetric, but not normally distributed. O C. The variable "weekly time spent watching television" is likely skewed left, not normally distributed. O D. The variable "weekly time spent watching television" is likely normally distributed. O E. The variable "weekly time spent watching television" is likely uniform, not normally distributed. (b) According to a certain survey, adults spend 2.45 hours per day watching television on a weekday. Assume that the standard deviation for...arrow_forward
arrow_back_ios
arrow_forward_ios
Recommended textbooks for you
- Text book imageAlgebra and Trigonometry (6th Edition)AlgebraISBN:9780134463216Author:Robert F. BlitzerPublisher:PEARSONText book imageContemporary Abstract AlgebraAlgebraISBN:9781305657960Author:Joseph GallianPublisher:Cengage LearningText book imageLinear Algebra: A Modern IntroductionAlgebraISBN:9781285463247Author:David PoolePublisher:Cengage Learning
- Text book imageAlgebra And Trigonometry (11th Edition)AlgebraISBN:9780135163078Author:Michael SullivanPublisher:PEARSONText book imageIntroduction to Linear Algebra, Fifth EditionAlgebraISBN:9780980232776Author:Gilbert StrangPublisher:Wellesley-Cambridge PressText book imageCollege Algebra (Collegiate Math)AlgebraISBN:9780077836344Author:Julie Miller, Donna GerkenPublisher:McGraw-Hill Education
Text book image
Algebra and Trigonometry (6th Edition)
Algebra
ISBN:9780134463216
Author:Robert F. Blitzer
Publisher:PEARSON
Text book image
Contemporary Abstract Algebra
Algebra
ISBN:9781305657960
Author:Joseph Gallian
Publisher:Cengage Learning
Text book image
Linear Algebra: A Modern Introduction
Algebra
ISBN:9781285463247
Author:David Poole
Publisher:Cengage Learning
Text book image
Algebra And Trigonometry (11th Edition)
Algebra
ISBN:9780135163078
Author:Michael Sullivan
Publisher:PEARSON
Text book image
Introduction to Linear Algebra, Fifth Edition
Algebra
ISBN:9780980232776
Author:Gilbert Strang
Publisher:Wellesley-Cambridge Press
Text book image
College Algebra (Collegiate Math)
Algebra
ISBN:9780077836344
Author:Julie Miller, Donna Gerken
Publisher:McGraw-Hill Education