MATLAB: An Introduction with Applications
MATLAB: An Introduction with Applications
6th Edition
ISBN: 9781119256830
Author: Amos Gilat
Publisher: John Wiley & Sons Inc
expand_more
expand_more
format_list_bulleted
Bartleby Related Questions Icon
Related questions
bartleby
Concept explainers
Question
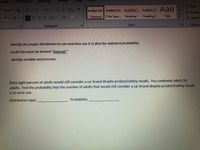
Transcribed Image Text:**Identification of Distribution and Probability Analysis**
In this exercise, we aim to identify the appropriate statistical distribution to use for the problem at hand and then calculate the specified probability.
**Task**
Evaluate whether this event could be classified as "unusual."
**Instructions**
Identify the relevant variable and function.
**Scenario**
According to a survey, sixty-eight percent of adults would still consider a car brand despite product or safety recalls. You will randomly select 20 adults for this study. Your task is to find the probability that the number of adults who would still consider a car brand despite product/safety recalls is at most one.
**Required Information**
- **Distribution type:** _____________
- **Probability:** _____________
Expert Solution
Check MarkThis question has been solved!
Explore an expertly crafted, step-by-step solution for a thorough understanding of key concepts.
bartleby
This is a popular solution
bartleby
Trending nowThis is a popular solution!
bartleby
Step by stepSolved in 3 steps with 2 images
Knowledge Booster
Background pattern image
Learn more about
Need a deep-dive on the concept behind this application? Look no further. Learn more about this topic, statistics and related others by exploring similar questions and additional content below.Similar questions
- I need help with this one please thank you.arrow_forwardYou want to know the probability that you will select a king of any suit from a deck of cards. You calculate the probability by dividing the number kings in the pack by the total number of cards in the pack (52) . This is an example for relative frequency?arrow_forwardUsing the data given below, determine whether it would unusual for a household to have no HD televisions. The number of televisions (HD) per household in a small town Televisions 1 2 Households 26 445 655 1474 P(x) 0.010 0.171 0.252 0.567 Choose the correct answer below. O A. It would be unusual because the probability of having no HD televisions is less than 0.05. OB. It would not be unusual because the probability of having no HD televisions is more than 0.05. O C. It would not be unuşual beçause 26 people have no HD televisions in the town. O D. It would be unusual because 26 people have no HD televisions in the town. Click to select your answer.arrow_forward
- A survey was conducted two years ago asking college students their top motivations for using a credit card. You think this distribution has changed. You randomly select 425 college students and ask each one what the top motivation is for using a credit card. Can you conclude that there has been a change in the distribution? Use a = 0.025. Complete parts (a) through (d). Response Old Survey % 29% New Survey Frequency, f Rewards 110 Low rates Cash back Discounts 23% 96 21% 109 7% 46 Other 20% 64 O B. The distribution of motivations is 110 rewards, 96 low rate, 109 cash back, 46 discounts, and 64 other. O C. The distribution of motivations is 29% rewards, 23% low rate, 21% cash back, 7% discounts, and 20% other. Which hypothesis is the claim? o Ho (b) Determine the critical value, Yo, and the rejection region. X = 11.143 (Round to three decimal places as needed.) Choose the correct rejection region below. Oc. Xarrow_forwardQ2arrow_forwardAnswer Part C only.arrow_forwardMake a histogram of the probability distribution of X. Describe its shape.arrow_forwardJamie’s Intro to Biology professor tells the class that on the first exam, the mean score is a 70, but the median score is an 84. What does this tell you about the skewness of the distribution? What measures of center and spread would you use to describe this distribution? a. The distribution is skewed left, so we should use the mean and the median to describe the distribution. b. The distribution is skewed left, so we should use the median and the IQR to describe the distribution. c. The distribution is skewed right, so we should use the median and the IQR to describe the distribution. d. The distribution is symmetric, so we should use the standard deviation and the IQR to describe the distribution. e. The distribution is skewed right, so we should use the mean and the IQR to describe the distribution.arrow_forwardUse the following table for the next two questions. The following data represent the number of male and female students enrolled in nursing at the University of Oklahoma Health Sciences Center for a recent semester. A student is selected at random. Find the probability of each event. Nursing majors 180 1010 1190 Males Females Totals 23. The student is a male or nursing majors? (a) 1.0222 (b) 0.6200 (c) 0.6101 (d) 0.5750 Non-nursing majors 1110 1700 2810 Totals 1290 2710 4000 (e) 0.0450 24. Given that the selected student is female, find the probability that the student is a nursing major? (e) 0.1200 (a) 0.0380 (b) 0.2525 (c) 0.3727 (d) 0.9772arrow_forwardPlease help asaparrow_forwardHelparrow_forwardK The following data represent the number of drivers involved in a fatal crash in 2016 in various light and weather conditions. Complete parts (a) through (c) below. Click the icon to view the data for fatal crashes in 2016. (a) Among fatal crashes in unknown weather conditions, what is the probability that a randomly selected fatal crash occurs when it is dawn/dusk? The probability that a randomly selected fatal crash in unknown weather conditions occurs when it is dawn/dusk is approximately. (Round to three decimal places as needed.) Data table Weather Daylight Dark, but Lighted 5875 497 51 54 255 Normal Rain Snow/Sleet Other Unknown 14,307 875 219 125 810 (...) Dark 8151 681 156 220 548 Dawn/Dusk Other 1183 87 40 71 65 8 2 9 133 Xarrow_forwardarrow_back_iosarrow_forward_ios
Recommended textbooks for you
- Text book imageMATLAB: An Introduction with ApplicationsStatisticsISBN:9781119256830Author:Amos GilatPublisher:John Wiley & Sons IncText book imageProbability and Statistics for Engineering and th...StatisticsISBN:9781305251809Author:Jay L. DevorePublisher:Cengage LearningText book imageStatistics for The Behavioral Sciences (MindTap C...StatisticsISBN:9781305504912Author:Frederick J Gravetter, Larry B. WallnauPublisher:Cengage Learning
- Text book imageElementary Statistics: Picturing the World (7th E...StatisticsISBN:9780134683416Author:Ron Larson, Betsy FarberPublisher:PEARSONText book imageThe Basic Practice of StatisticsStatisticsISBN:9781319042578Author:David S. Moore, William I. Notz, Michael A. FlignerPublisher:W. H. FreemanText book imageIntroduction to the Practice of StatisticsStatisticsISBN:9781319013387Author:David S. Moore, George P. McCabe, Bruce A. CraigPublisher:W. H. Freeman
Text book image
MATLAB: An Introduction with Applications
Statistics
ISBN:9781119256830
Author:Amos Gilat
Publisher:John Wiley & Sons Inc
Text book image
Probability and Statistics for Engineering and th...
Statistics
ISBN:9781305251809
Author:Jay L. Devore
Publisher:Cengage Learning
Text book image
Statistics for The Behavioral Sciences (MindTap C...
Statistics
ISBN:9781305504912
Author:Frederick J Gravetter, Larry B. Wallnau
Publisher:Cengage Learning
Text book image
Elementary Statistics: Picturing the World (7th E...
Statistics
ISBN:9780134683416
Author:Ron Larson, Betsy Farber
Publisher:PEARSON
Text book image
The Basic Practice of Statistics
Statistics
ISBN:9781319042578
Author:David S. Moore, William I. Notz, Michael A. Fligner
Publisher:W. H. Freeman
Text book image
Introduction to the Practice of Statistics
Statistics
ISBN:9781319013387
Author:David S. Moore, George P. McCabe, Bruce A. Craig
Publisher:W. H. Freeman