MATLAB: An Introduction with Applications
MATLAB: An Introduction with Applications
6th Edition
ISBN: 9781119256830
Author: Amos Gilat
Publisher: John Wiley & Sons Inc
expand_more
expand_more
format_list_bulleted
Bartleby Related Questions Icon
Related questions
Question
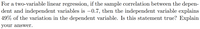
Transcribed Image Text:For a two-variable linear regression, if the sample correlation between the depen-
dent and independent variables is –0.7, then the independent variable explains
49% of the variation in the dependent variable. Is this statement true? Explain
your answer.
Expert Solution
Check MarkThis question has been solved!
Explore an expertly crafted, step-by-step solution for a thorough understanding of key concepts.
bartleby
This is a popular solution
bartleby
Trending nowThis is a popular solution!
bartleby
Step by stepSolved in 2 steps
Knowledge Booster
Background pattern image
Similar questions
- Because colas tend to replace healthier beverages and colas contain caffeine and phosphoric acid, researchers wanted to know whether cola consumption is associated with lower bone mineral density in women. The accompanying data lists the typical number of cans of cola consumed in a week and the femoral neck bone mineral density for a sample of 15 women. Complete parts (a) through (d) below. Click the icon to view the women's data. (a) Find the regression equation treating cola consumption per week as the x-variable. y=x+ (Round to three decimal places as needed.) (b) Interpret the slope. Select the correct choice below and, if necessary, fill in the answer box to complete your choice. OA. For 0 colas consumed in a week, the bone density is predicted to be (Round to three decimal places as needed.) g/cm3. OB. For every cola consumed per week, the bone density decreases by (Round to three decimal places as needed.) g/cm3, on average. OC. For a bone density of 0 g/cm3, the number of colas...arrow_forwardCan you please tell also the test statistics and if the weight is close to 518 pounds?arrow_forwardThe equation of a regression line, unlike the correlation, depends on the units we use to measure the explanatory and response variables. Here is the data on percent body fat and preferred amount of salt. Preferred amountof salt x 0.2 0.3 0.4 0.5 0.6 0.8 1.1 Percent body fat y 21 30 23 30 39 24 31 In calculating the preferred amount of salt, the weight of the salt was in milligrams. (a) Find the equation of the regression line for predicting percent body fat from preferred amount of salt when weight is in milligrams. (Round your answers to one decimal place.) ŷ = + x (b) A mad scientist decides to measure weight in tenths of milligrams. The same data in these units are as follows. Preferred amountof salt x 2 3 4 5 6 8 11 Percent body fat y 21 30 23 30 39 24 31 Find the equation of the regression line for predicting percent body fat from preferred amount of salt when weight is in tenths of milligrams. (Round your intercept to one decimal place and your slope to two...arrow_forward
- You generate a scatter plot using Excel. You then have Excel plot the trend line and report the equation and the r2r2 value. The regression equation is reported asy=55.82x+32.43y=55.82x+32.43and the r2=0.3136r2=0.3136.What is the correlation coefficient for this data set?r =arrow_forwardThe data show the chest size and weight of several bears. Find the regression equation, letting chest size be the independent (x) variable. Then find the best predicted weight of a bear with a chest size of 58 inches. Is the result close to the actual weight of 572 pounds? Use a significance level of 0.05. Chest size (inches) 46 57 53 41 40 40 Weight (pounds) 384 580 542 358 306 320 LOADING... Click the icon to view the critical values of the Pearson correlation coefficient r. What is the regression equation? y=nothing+nothingx (Round to one decimal place as needed.)arrow_forwardyou take a bar of soap and weigh it after each shower. will the regression line be positive or negativearrow_forward
- The datasetBody.xlsgives the percent of weight made up of body fat for 100 men as well as other variables such as Age, Weight (lb), Height (in), and circumference (cm) measurements for the Neck, Chest, Abdomen, Ankle, Biceps, and Wrist. We are interested in predicting body fat based on abdomen circumference. Find the equation of the regression line relating to body fat and abdomen circumference. Make a scatter-plot with a regression line. What body fat percent does the line predict for a person with an abdomen circumference of 110 cm? One of the men in the study had an abdomen circumference of 92.4 cm and a body fat of 22.5 percent. Find the residual that corresponds to this observation. Bodyfat Abdomen 32.3 115.6 22.5 92.4 22 86 12.3 85.2 20.5 95.6 22.6 100 28.7 103.1 21.3 89.6 29.9 110.3 21.3 100.5 29.9 100.5 20.4 98.9 16.9 90.3 14.7 83.3 10.8 73.7 26.7 94.9 11.3 86.7 18.1 87.5 8.8 82.8 11.8 83.3 11 83.6 14.9 87 31.9 108.5 17.3...arrow_forwardAfter interviewing salespersons at Harley Davidson dealerships, a researcher has created a linear regression line to explain the relationship between a Harley Davidson motorcycle's age (x) and price (y). The regression has an R2 = 87.7%. Write a sentence summarizing what R2 says about this regression. The age of the motorcycle explains 12.3% of the variation in price. The age of the motorcycle explains 9.36% of the variation in price. The age of the motorcycle explains 87.7% of the variation in price. The price of the motorcycle explains 12.3% of the variation in age. The price of the motorcycle explains 87.7% of the variation in age.arrow_forwardA pediatrician wants to determine the relation that exists between a child's height (x) and head circumference (y). She randomly selects 11 children from her practice and measures their height and head circumference in inches. She finds that the correlation is 0.477 and the regression equation is y = 0.149x + 8.15 What proportion of the variation in head circumference can be explained by the variation in the values of height? % Report answer as a percentage accurate to one decimal place.arrow_forward
- What are the odds in favor of drawing a face card from a standard deck of 52 playing cards? 10:3 13:3 3:13 3:10 auto proctoru.com is sharing your screen Stop sharing Hidearrow_forwardFor the last 12 years, Colin has contributed 110ドル each month into a retirement savings account. If the account earns 7% per year compounded monthly what is the balance of the account at the end of the 12th year?arrow_forwardThe correlation between first year college GPA and high school GPA is 0.683. If a simple linear regression was conducted to predict first year college GPA from high school GPA what does the correlation tell us about the fit of the model?arrow_forward
arrow_back_ios
SEE MORE QUESTIONS
arrow_forward_ios
Recommended textbooks for you
- Text book imageMATLAB: An Introduction with ApplicationsStatisticsISBN:9781119256830Author:Amos GilatPublisher:John Wiley & Sons IncText book imageProbability and Statistics for Engineering and th...StatisticsISBN:9781305251809Author:Jay L. DevorePublisher:Cengage LearningText book imageStatistics for The Behavioral Sciences (MindTap C...StatisticsISBN:9781305504912Author:Frederick J Gravetter, Larry B. WallnauPublisher:Cengage Learning
- Text book imageElementary Statistics: Picturing the World (7th E...StatisticsISBN:9780134683416Author:Ron Larson, Betsy FarberPublisher:PEARSONText book imageThe Basic Practice of StatisticsStatisticsISBN:9781319042578Author:David S. Moore, William I. Notz, Michael A. FlignerPublisher:W. H. FreemanText book imageIntroduction to the Practice of StatisticsStatisticsISBN:9781319013387Author:David S. Moore, George P. McCabe, Bruce A. CraigPublisher:W. H. Freeman
Text book image
MATLAB: An Introduction with Applications
Statistics
ISBN:9781119256830
Author:Amos Gilat
Publisher:John Wiley & Sons Inc
Text book image
Probability and Statistics for Engineering and th...
Statistics
ISBN:9781305251809
Author:Jay L. Devore
Publisher:Cengage Learning
Text book image
Statistics for The Behavioral Sciences (MindTap C...
Statistics
ISBN:9781305504912
Author:Frederick J Gravetter, Larry B. Wallnau
Publisher:Cengage Learning
Text book image
Elementary Statistics: Picturing the World (7th E...
Statistics
ISBN:9780134683416
Author:Ron Larson, Betsy Farber
Publisher:PEARSON
Text book image
The Basic Practice of Statistics
Statistics
ISBN:9781319042578
Author:David S. Moore, William I. Notz, Michael A. Fligner
Publisher:W. H. Freeman
Text book image
Introduction to the Practice of Statistics
Statistics
ISBN:9781319013387
Author:David S. Moore, George P. McCabe, Bruce A. Craig
Publisher:W. H. Freeman