MATLAB: An Introduction with Applications
MATLAB: An Introduction with Applications
6th Edition
ISBN: 9781119256830
Author: Amos Gilat
Publisher: John Wiley & Sons Inc
expand_more
expand_more
format_list_bulleted
Bartleby Related Questions Icon
Related questions
Question
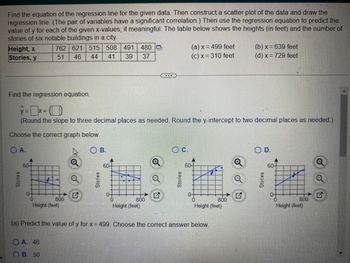
Answer the questions and then predict the values of y for x=499, 639, 310, 729
Transcribed Image Text:Find the equation of the regression line for the given data. Then construct a scatter plot of the data and draw the
regression line. (The pair of variables have a significant correlation.) Then use the regression equation to predict the
value of y for each of the given x-values, if meaningful. The table below shows the heights (in feet) and the number of
stories of six notable buildings in a city.
762 621 515 508 491 480 D
51 46 44 41 39 37
Height, x
Stories, y
pos
Find the regression equation.
y = x +
(Round the slope to three decimal places as needed. Round the y-intercept to two decimal places as needed.)
Choose the correct graph below.
OA.
OB.
800
Height (feet)
OA. 46
OB. 50
Q
Q
G
Stories
60
800
0
Height (feet)
Q
Q
OC.
(a) x = 499 feet
(c) x = 310 feet
Stories
60-
E
0
Height (feet)
(a) Predict the value of y for x = 499. Choose the correct answer below.
800
Q
Q
(b) x = 639 feet
(d) x = 729 feet
G
OD.
Stories
60
800
Height (feet)
Q
Q
Q
Expert Solution
Check MarkThis question has been solved!
Explore an expertly crafted, step-by-step solution for a thorough understanding of key concepts.
bartleby
Step by stepSolved in 5 steps with 11 images
Knowledge Booster
Background pattern image
Similar questions
- A circle is partitioned into 5 equal parts, so as to create 5 identical angles, each with vertex at the center of the circle, as shown here: 1. If each of the 5 angles is x°, then what is x? Explain 2. If you view the circle as a protractor, and you use it to measure angles that are drawn on a page, what size angles can you measure? Explain. to to 0122 to to % toarrow_forwardWhat is the value of X to the nearest 10th?arrow_forwardDetermine the missing leg length for a right triangle with hypotenuse 13.8 and a leg of 7.8arrow_forward
arrow_back_ios
arrow_forward_ios
Recommended textbooks for you
- Text book imageMATLAB: An Introduction with ApplicationsStatisticsISBN:9781119256830Author:Amos GilatPublisher:John Wiley & Sons IncText book imageProbability and Statistics for Engineering and th...StatisticsISBN:9781305251809Author:Jay L. DevorePublisher:Cengage LearningText book imageStatistics for The Behavioral Sciences (MindTap C...StatisticsISBN:9781305504912Author:Frederick J Gravetter, Larry B. WallnauPublisher:Cengage Learning
- Text book imageElementary Statistics: Picturing the World (7th E...StatisticsISBN:9780134683416Author:Ron Larson, Betsy FarberPublisher:PEARSONText book imageThe Basic Practice of StatisticsStatisticsISBN:9781319042578Author:David S. Moore, William I. Notz, Michael A. FlignerPublisher:W. H. FreemanText book imageIntroduction to the Practice of StatisticsStatisticsISBN:9781319013387Author:David S. Moore, George P. McCabe, Bruce A. CraigPublisher:W. H. Freeman
Text book image
MATLAB: An Introduction with Applications
Statistics
ISBN:9781119256830
Author:Amos Gilat
Publisher:John Wiley & Sons Inc
Text book image
Probability and Statistics for Engineering and th...
Statistics
ISBN:9781305251809
Author:Jay L. Devore
Publisher:Cengage Learning
Text book image
Statistics for The Behavioral Sciences (MindTap C...
Statistics
ISBN:9781305504912
Author:Frederick J Gravetter, Larry B. Wallnau
Publisher:Cengage Learning
Text book image
Elementary Statistics: Picturing the World (7th E...
Statistics
ISBN:9780134683416
Author:Ron Larson, Betsy Farber
Publisher:PEARSON
Text book image
The Basic Practice of Statistics
Statistics
ISBN:9781319042578
Author:David S. Moore, William I. Notz, Michael A. Fligner
Publisher:W. H. Freeman
Text book image
Introduction to the Practice of Statistics
Statistics
ISBN:9781319013387
Author:David S. Moore, George P. McCabe, Bruce A. Craig
Publisher:W. H. Freeman