Holt Mcdougal Larson Pre-algebra: Student Edition 2012
Holt Mcdougal Larson Pre-algebra: Student Edition 2012
1st Edition
ISBN: 9780547587776
Author: HOLT MCDOUGAL
Publisher: HOLT MCDOUGAL
expand_more
expand_more
format_list_bulleted
Bartleby Related Questions Icon
Related questions
Question
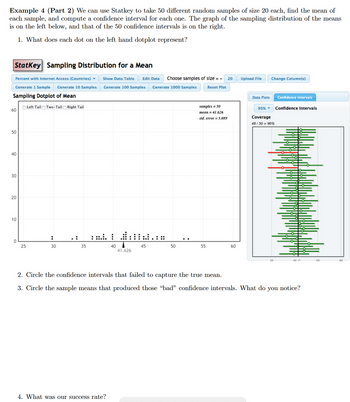
Transcribed Image Text:Example 4 (Part 2) We can use Statkey to take 50 different random samples of size 20 each, find the mean of
each sample, and compute a confidence interval for each one. The graph of the sampling distribution of the means
is on the left below, and that of the 50 confidence intervals is on the right.
1. What does each dot on the left hand dotplot represent?
StatKey Sampling Distribution for a Mean
Percent with Internet Access (Countries) ▾
Show Data Table Edit Data
Choose samples of size n =
20
Upload File
Change Column(s)
Generate 1 Sample
Generate 10 Samples
Generate 100 Samples
Generate 1000 Samples
Reset Plot
Sampling Dotplot of Mean
Left Tail Two-Tail Right Tail
60
50
40
40
30
20
20
10
samples = 50
mean = 41.626
std. error = 5.089
:
.:
:
::
0
25
30
35
40
45
50
55
60
41.626
Data Plots
Confidence Intervals
95%->
Confidence Intervals
Coverage
48/50 = 96%
20
40
60
80
2. Circle the confidence intervals that failed to capture the true mean.
3. Circle the sample means that produced those "bad" confidence intervals. What do you notice?
4. What was our success rate?
Expert Solution
Check MarkThis question has been solved!
Explore an expertly crafted, step-by-step solution for a thorough understanding of key concepts.
bartleby
Step by stepSolved in 2 steps with 1 images
Knowledge Booster
Background pattern image
Recommended textbooks for you
- Text book imageHolt Mcdougal Larson Pre-algebra: Student Edition...AlgebraISBN:9780547587776Author:HOLT MCDOUGALPublisher:HOLT MCDOUGALText book imageGlencoe Algebra 1, Student Edition, 9780079039897...AlgebraISBN:9780079039897Author:CarterPublisher:McGraw HillText book imageCollege Algebra (MindTap Course List)AlgebraISBN:9781305652231Author:R. David Gustafson, Jeff HughesPublisher:Cengage Learning
Text book image
Holt Mcdougal Larson Pre-algebra: Student Edition...
Algebra
ISBN:9780547587776
Author:HOLT MCDOUGAL
Publisher:HOLT MCDOUGAL
Text book image
Glencoe Algebra 1, Student Edition, 9780079039897...
Algebra
ISBN:9780079039897
Author:Carter
Publisher:McGraw Hill
Text book image
College Algebra (MindTap Course List)
Algebra
ISBN:9781305652231
Author:R. David Gustafson, Jeff Hughes
Publisher:Cengage Learning