MATLAB: An Introduction with Applications
MATLAB: An Introduction with Applications
6th Edition
ISBN: 9781119256830
Author: Amos Gilat
Publisher: John Wiley & Sons Inc
expand_more
expand_more
format_list_bulleted
Bartleby Related Questions Icon
Related questions
Question
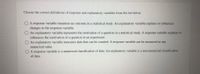
Transcribed Image Text:Choose the correct definitions of response and explanatory variables from the list below.
A response variable measures an outcome in a statistical study. An explanatory variable explains or influences
changes in the response variable.
O An explanatory variable represents the motivation of a question in a statistical study. A response variable explains or
influences the motivation of a question in an experiment.
O An explanatory variable measures data that can be counted. A response variable can be measured as any
numerical value.
O A response variable is a numerical classification of data. An explanatory variable is a non-numerical classification
of data.
Expert Solution
Check MarkThis question has been solved!
Explore an expertly crafted, step-by-step solution for a thorough understanding of key concepts.
bartleby
This is a popular solution
bartleby
Trending nowThis is a popular solution!
bartleby
Step by stepSolved in 2 steps
Knowledge Booster
Background pattern image
Similar questions
- You need to use Stata to look up the dataset and its variables. Use Stata Companion Textbook. (Dataset: NES. Variables: spend8, [pw=nesw].) The NES dataset contains spend8, which records the number of government policy areas where respondents think spending should be increased. Scores range from 0 (the respondent does not want to increase spending on any of the policies) to 8 (the respondent wants to increase spending on all eight policies). The NES, of course, polls a random sample of U.S. adults. In this exercise you will analyze spend8 using the mean and lincom commands. You then will draw inferences about the population mean. (Remember to specify nesw as the probability weight.) The spend8 variable has a sample mean of ______. Make sure you use [pw=nesw] so your results are nationally representative. There is a probability of .95 that spend8’s true population mean falls between a score of ______ at the low end and a score of ______ at the high end. A student researcher...arrow_forwardContingency table analysis (test of independence)Each home sold by Lakeland Homes can be classified according to the price level andto the style. The management would like to determine if the price of the home and thestyle of the home are independent variables. With the observed data given in thefollowing table and with a significance level of of = 0.05, conduct a formalhypothesis test to help the management in decision making process.Price Level Colonial Log Split A Frame <= 100,000ドル 18 6 19 12 > 100,000ドル 12 14 16 3arrow_forwardQuestion: Can you give an example of variable for which the mean would not be appropriate to describe the data (that is, tell me a circumstance in which you would not want to use the mean to describe a dataset).arrow_forward
- Monthly telephone charges for cell phone in the United States are normally distributed with a mean of 62ドル for a single user. Coach Keefer thinks that leasing smart phones has increased the monthly cell phone bill for a single user. O Ho : μ = 62 H : μ> 62 u> O Ho: μ= 62 Ha : μ# 62 OHo: = 62 Ha: 62 O Ho: p = 62 Ha:μ262 ASUS VivoBookarrow_forwardIdentify which of the variables is most likely to be the explanatory variable, and which is most likely to be the response variable. Explain. Identify whether each variable is categorical or quantitative, and classify the relationship as C-Q, C>C, or Q-›Q, and explain how you know. Determine what type of data display and description is appropriate for the relationship, and explain why. Create an appropriate data display and describe the relationship using vocabulary appropriate to the type of data. Describe any potential lurking (confounding) variables and describe how this impacts association (correlation) versus causation.arrow_forwardA medical researcher measures the increase in heart rate of patients who are taking a stress test. What kind of variable is the researcher studying? Choose the correct answer below. Identifier variable Ordinal variable Categorical variable Quantitative variablearrow_forward
- Current Attempt in Progress The USStates dataset, used throughout the textbook, contains information on the 50 US states. A small segment from the dataset is displayed in the following table State 1 California Colorado Connecticut Save for Later Percent of Residents with a College Degree 34.5 39.6 42.7 What variable was used to determine that 42.7% of Connecticut state residents have a college degree? Is it categorical or quantitative? O Variable what state they are from. This is a categorical variable. O Variable what state they are from. This is a quantitative variable. O Variable O Variable whether or not they have a college degree. This is a categorical variable. whether or not they have a college degree. This is a quantitative variable. Attempts Doffriredarrow_forwardWhat is the coefficient of the dummy variable? What is the meaning of the coefficient of the dummy variable?arrow_forwardNet Worth. The Board of Governors of the Federal Reserve System publishes information on family net worth in the Survey of Consumer Finances. In 2010, the mean net worth of families in the United States was 498ドル.8 thousand and the median net worth was 77ドル.3 thousand. Which measure of center do you think is more appropriate? Explain your answer.arrow_forward
arrow_back_ios
arrow_forward_ios
Recommended textbooks for you
- Text book imageMATLAB: An Introduction with ApplicationsStatisticsISBN:9781119256830Author:Amos GilatPublisher:John Wiley & Sons IncText book imageProbability and Statistics for Engineering and th...StatisticsISBN:9781305251809Author:Jay L. DevorePublisher:Cengage LearningText book imageStatistics for The Behavioral Sciences (MindTap C...StatisticsISBN:9781305504912Author:Frederick J Gravetter, Larry B. WallnauPublisher:Cengage Learning
- Text book imageElementary Statistics: Picturing the World (7th E...StatisticsISBN:9780134683416Author:Ron Larson, Betsy FarberPublisher:PEARSONText book imageThe Basic Practice of StatisticsStatisticsISBN:9781319042578Author:David S. Moore, William I. Notz, Michael A. FlignerPublisher:W. H. FreemanText book imageIntroduction to the Practice of StatisticsStatisticsISBN:9781319013387Author:David S. Moore, George P. McCabe, Bruce A. CraigPublisher:W. H. Freeman
Text book image
MATLAB: An Introduction with Applications
Statistics
ISBN:9781119256830
Author:Amos Gilat
Publisher:John Wiley & Sons Inc
Text book image
Probability and Statistics for Engineering and th...
Statistics
ISBN:9781305251809
Author:Jay L. Devore
Publisher:Cengage Learning
Text book image
Statistics for The Behavioral Sciences (MindTap C...
Statistics
ISBN:9781305504912
Author:Frederick J Gravetter, Larry B. Wallnau
Publisher:Cengage Learning
Text book image
Elementary Statistics: Picturing the World (7th E...
Statistics
ISBN:9780134683416
Author:Ron Larson, Betsy Farber
Publisher:PEARSON
Text book image
The Basic Practice of Statistics
Statistics
ISBN:9781319042578
Author:David S. Moore, William I. Notz, Michael A. Fligner
Publisher:W. H. Freeman
Text book image
Introduction to the Practice of Statistics
Statistics
ISBN:9781319013387
Author:David S. Moore, George P. McCabe, Bruce A. Craig
Publisher:W. H. Freeman