MATLAB: An Introduction with Applications
MATLAB: An Introduction with Applications
6th Edition
ISBN: 9781119256830
Author: Amos Gilat
Publisher: John Wiley & Sons Inc
expand_more
expand_more
format_list_bulleted
Bartleby Related Questions Icon
Related questions
Question
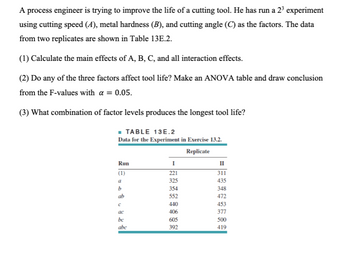
Transcribed Image Text:A process engineer is trying to improve the life of a cutting tool. He has run a 23 experiment
using cutting speed (A), metal hardness (B), and cutting angle (C) as the factors. The data
from two replicates are shown in Table 13E.2.
(1) Calculate the main effects of A, B, C, and all interaction effects.
(2) Do any of the three factors affect tool life? Make an ANOVA table and draw conclusion
from the F-values with α = 0.05.
(3) What combination of factor levels produces the longest tool life?
■しかく TABLE 13E.2
Data for the Experiment in Exercise 13.2.
Replicate
Run
I
II
(1)
221
311
a
325
435
b
354
348
ab
552
472
с
440
453
སྣ་ ནྟི
406
377
bc
605
500
abc
392
419
Expert Solution
Check MarkThis question has been solved!
Explore an expertly crafted, step-by-step solution for a thorough understanding of key concepts.
bartleby
Step by stepSolved in 2 steps with 2 images
Knowledge Booster
Background pattern image
Similar questions
- two types of preoperative skin preparation before performing open heart surgery. These two preparations used aqueous iodine and insoluble iodine. Do these data provide sufficient evidence at the α = 0.05 level to justify the conclusion that they type of skin preparation and infection are associated?arrow_forwardA psychologist would like to examine the effects of different testing methods on the final performance of college students. One group has regular quizzes, one group has three large exams, and the third group only has a final exam. At the end of the course, the psychologist interviews each student to get a measure of the student’s overall knowledge of the material. Do these data indicate any significant differences among the three methods? Test with α = .05. Collected Data Quizzes Exams Final Only 4 1 0 6 4 2 G = 36 3 5 0 ΣX2 =わ 164 7 2 2 T =...arrow_forward20 Statistics students in Oxnard College sampled 10 textbooks in the Condor bookstore and recorded the number of pages in each textbook and its cost. The bivariate data are shown below: Number of Pages (xx) Cost(yy) 900 68 352 34.64 855 58.85 695 60.65 412 38.84 310 20.7 600 45 308 34.56 781 56.67 881 59.67 A student calculates a linear modely=_____ x +_____ . (Please show your answers to two decimal places)Use the model to estimate the cost when number of pages is 450.Cost = $________arrow_forward
- The burning rates of two types of propellants used in aircrew escape systems are being studied. It is known that the two types of propellants have different SD of burning rates. Two samples of n1 :20 and n2 35 specimens are tested, and sample mean burning rates are 1 19.05 cm/s and 2 = 25.37 cm/s, sample SD's are 1ドル = 3.81 cm/s and s2 = 3.97 cm/s. Test the hypothesis that these two types of propellants have the same mean burning rate at level a = 0.05. =arrow_forwardIn a completely randomized experimental design involving three assembly methods, 30 employees were randomly selected and 10 were assigned to each of the three methods. The time required to complete the task was recorded. The following information is provided: MSTR = 45.89 and MSE = 6.27. What is the critical value of F if we want to determine whether the means of the three populations are equal at the 5% level of significance?arrow_forwardFor an AR(1) model with p = 0.6 and n = 100, the lag 1 sample autocorrelation of the residuals is found to be 1 = 0.15. Is this result unusual? Justify your answer.arrow_forward
- You are conducting a study to see if the proportion of men over 50 who regularly have their prostate examined is significantly different from 0.14. You use a significance level of α=0.10α=0.10. H0:p=0.14H0:p=0.14 H1:p≠0.14H1:p≠0.14You obtain a sample of size n=345n=345 in which there are 69 successes.What is the test statistic for this sample? (Report answer accurate to three decimal places.)test statistic = What is the p-value for this sample? (Report answer accurate to four decimal places.)p-value = The p-value is... less than (or equal to) αα greater than αα This test statistic leads to a decision to... reject the null accept the null fail to reject the null As such, the final conclusion is that... The sample data support the claim that the proportion of men over 50 who regularly have their prostate examined is different from 0.14. There is not sufficient sample evidence to support the claim that the proportion of men over 50 who regularly have their prostate...arrow_forwardYou are conducting a study to see if the proportion of men over 50 who regularly have their prostate examined is significantly different from 0.44. You use a significance level of α=0.05α=0.05. H0:p=0.44H0:p=0.44 H1:p≠0.44H1:p≠0.44You obtain a sample of size n=298n=298 in which there are 153 successes.What is the p-value for this sample? (Report answer accurate to four decimal places.)p-value = The p-value is... less than (or equal to) αα greater than αα This p-value leads to a decision to... reject the null accept the null fail to reject the null As such, the final conclusion is that... There is sufficient evidence to warrant rejection of the claim that the proportion of men over 50 who regularly have their prostate examined is different from 0.44. There is not sufficient evidence to warrant rejection of the claim that the proportion of men over 50 who regularly have their prostate examined is different from 0.44. The sample data support the claim that the...arrow_forwardThe marketing research company comScore, Inc. reported that 65% of online searches in March 2010 used Google as the search engine. A network administrator wants to determine whether the percentage of searches that use Google is different in his company. He samples 400 searches and finds that 295 of them use Google. Can he conclude that the percentage of searches that use Google in his company differs from 65%? Use the α= 0.05 level of significance.arrow_forward
- A researcher wants to test a new memory performance supplement that has shown some promise in primate studies where subjects were given the supplement followed by the task of identifying pictures of other animals three days later. The dependent variable was measured by the number of pictures correctly identified. The researchers noticed that while there was a positive correlation between the group given the supplement and number of correctly identified pictures as compared to the control group, they also notice that there seemed to be some variation between the males and females of the primates. Additionally, two different amounts of the drug have been proposed for consideration. Therefore, in the current study, the researchers want to divide the subject primates (N=60) by gender (male: n=30; female: n=30), and give them a 10 mg dose in one treatment condition, and a 25 mg dose in the other treatment condition. To do this, they are dividing each group of males and females in half, and...arrow_forwardA company that makes basketballs has the motto, "Our basketballs are ready to play." Therefore, it is important to the company that the basketballs are inflated with the proper amount of air when shipped. Most basketballs are inflated to 7 to 9 pounds per square inch. From a set of calibration data, X = 8.03 and R=0.57. Recently the company selected a random basketball from its production line at four different time periods over its normal production day. The results were listed in the accompanying table. Complete parts a through c. Click the icon to view the data table. Click the icon to view the factors for calculating control limits. a) Create an x-bar chart based on the calibration data statistics for these 6 samples. Choose the correct graph below. OA. O B. 2 3 4 5 6 Group 1.6-1 1.2- 0.8- 0.4- 1 2 3 4 5 Group 6 Q UCL CL LCL Q Ucha CL 8.6 8.4- b) Create an R chart based on the calibration data statistics for these 6 samples. Choose the correct graph below. O A. O B. LCL 8.24 8 7.8...arrow_forwardPhysical properties of six flame-retardant fabric samples were investigated in an article. Use the accompanying data and a 0.05 significance level to determine whether a linear relationship exists between stiffness x (mg-cm) and thickness y (mm). State the appropriate null and alternative hypotheses. O Ho: P = 0 H2: P 0 O Ho: P #O H2: p=0 O Ho: P = 0 H12 :P #0 8.07 24.69 12.33 6.85 24.22 35.69 y 0.29 0.65 0.31 0.27 0.80 0.57 Compute the value of the sample correlation coefficient, r. Round your answer to four decimal places. r= Calculate the test statistic and determine the P-value. (Round your test statistic to two decimal places and your P-value to three decimal places.) t = P-value = State the conclusion in the problem context. O Fail to reject Ho. The data does not indicate that the population correlation coefficient differs from 0. Reject Ho. The data does not indicate that the population correlation coefficient differs from 0. Fail to reject Ho. The data indicates that the...arrow_forward
arrow_back_ios
SEE MORE QUESTIONS
arrow_forward_ios
Recommended textbooks for you
- Text book imageMATLAB: An Introduction with ApplicationsStatisticsISBN:9781119256830Author:Amos GilatPublisher:John Wiley & Sons IncText book imageProbability and Statistics for Engineering and th...StatisticsISBN:9781305251809Author:Jay L. DevorePublisher:Cengage LearningText book imageStatistics for The Behavioral Sciences (MindTap C...StatisticsISBN:9781305504912Author:Frederick J Gravetter, Larry B. WallnauPublisher:Cengage Learning
- Text book imageElementary Statistics: Picturing the World (7th E...StatisticsISBN:9780134683416Author:Ron Larson, Betsy FarberPublisher:PEARSONText book imageThe Basic Practice of StatisticsStatisticsISBN:9781319042578Author:David S. Moore, William I. Notz, Michael A. FlignerPublisher:W. H. FreemanText book imageIntroduction to the Practice of StatisticsStatisticsISBN:9781319013387Author:David S. Moore, George P. McCabe, Bruce A. CraigPublisher:W. H. Freeman
Text book image
MATLAB: An Introduction with Applications
Statistics
ISBN:9781119256830
Author:Amos Gilat
Publisher:John Wiley & Sons Inc
Text book image
Probability and Statistics for Engineering and th...
Statistics
ISBN:9781305251809
Author:Jay L. Devore
Publisher:Cengage Learning
Text book image
Statistics for The Behavioral Sciences (MindTap C...
Statistics
ISBN:9781305504912
Author:Frederick J Gravetter, Larry B. Wallnau
Publisher:Cengage Learning
Text book image
Elementary Statistics: Picturing the World (7th E...
Statistics
ISBN:9780134683416
Author:Ron Larson, Betsy Farber
Publisher:PEARSON
Text book image
The Basic Practice of Statistics
Statistics
ISBN:9781319042578
Author:David S. Moore, William I. Notz, Michael A. Fligner
Publisher:W. H. Freeman
Text book image
Introduction to the Practice of Statistics
Statistics
ISBN:9781319013387
Author:David S. Moore, George P. McCabe, Bruce A. Craig
Publisher:W. H. Freeman