A First Course in Probability (10th Edition)
A First Course in Probability (10th Edition)
10th Edition
ISBN: 9780134753119
Author: Sheldon Ross
Publisher: PEARSON
expand_more
expand_more
format_list_bulleted
Bartleby Related Questions Icon
Related questions
Question
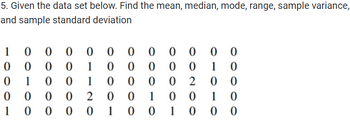
Transcribed Image Text:5. Given the data set below. Find the mean, median, mode, range, sample variance,
and sample standard deviation
1 0 0 0
00 0 0
1 0 0
0
0 0
0
0 0 01
0
0
1
0 000000
0 0
0 0
0 0
11200
0
0
1
0 0
0000
1
00200
10
0 0
1 0
00
Expert Solution
Check MarkThis question has been solved!
Explore an expertly crafted, step-by-step solution for a thorough understanding of key concepts.
bartleby
This is a popular solution
bartleby
Trending nowThis is a popular solution!
bartleby
Step by stepSolved in 7 steps with 2 images
Knowledge Booster
Background pattern image
Similar questions
- Consider the following sample data: 6, 10, 4, 3, 7, 9, 21, and 14. What is the variance? Select one: a. 34.79 b. 33.56 c. 34.21 d. 34.02arrow_forwardCalculate the range, variance , and stanard deviation for the following a.4,2,1,0,1 b.1,6,2,2,3,0,3 c.8,-2,1,3,5,4,4,1,3 d.0,2,0,0,-1,1,-2,1,0,-1,0,-3,-2,-1,0,1arrow_forward2. Please find the following: X-BAR (sample mean), b. "S" (sample standard deviation, +/- 1, 2 and 3 standard deviations) and c. "S-squared" (sample variance). d. Show all heading, formulas and column headings Draw the bell curve and show X-Bar and +/- 1, 2 and 3 standard deviations on the bell a. e. curve drawing. Grouped f Data 30-39 40-49 60-69 3 70-79 6. 80-89 12 90-99 16 100-109 20 Totals or Sums 6.arrow_forward
- Calculate the variance for the following dataset: 15 17 17 5 5arrow_forwardConsider the following data: −10, −10, 0, 3, −10, 3, 3 Step 1 of 3: Calculate the value of the sample Variance. Round your answer to one decimal place. Step 2 of 3: Calculate the value of the sample deviation. Round your answer to one decimal place. Step 3 of 3: Calculate the value of the range.arrow_forwardConsider a sample with data values of 57,45,50,39,50,59,60, and 48. Compute the following values a. Mode b. 40th percentile c. Variance d. Standard deviation e. Coefficient of variationarrow_forward
- Use the magnitudes (Richter scale) of the 120 earthquakes listed in the accompanying data table. Use technology to find the range, variance, and standard deviation. If another value, 8.00, is added to those listed in the data set, do the measures of variation change much? 3.30 2.77 2.80 1.96 1.69 2.54 2.43 3.44 3.92 1.58 2.87 1.63 2.56 3.95 2.50 2.44 1.82 2.19 2.44 2.99 2.92 2.35 1.98 3.06 2.78 3.86 2.95 2.07 1.86 2.36 2.37 3.46 3.45 1.54 2.54 1.49 2.22 3.06 2.27 3.20 1.96 1.91 2.40 2.95 2.61 1.49 2.16 2.33 1.91 2.70 2.92 1.80 3.66 2.69 1.43 3.60 3.13 2.56 1.54 1.41 2.83 2.85 2.20 1.68 3.18 1.38 1.73 2.37 1.15 2.35 2.46 1.81 2.01 3.00 1.94 2.42 1.85 2.24 2.35 3.22 3.97 2.10 1.48 2.31 2.31 2.62 2.55 2.20 2.77 2.46 2.69 3.57 2.84 2.75 3.26 1.74 4.72 3.23 2.36 2.00 3.83 2.41 2.88 2.67 2.32 2.80 2.80 2.40 3.41 2.34 1.49 2.41 2.45 2.50 2.73 2.44 2.78 2.65 2.68 2.43 Without the extra data value, the range is 3.573.57. (Type an integer or...arrow_forwardAnswer all questionsarrow_forwardFind the sample mean x̄, median, variance s2, and standard deviation s of the following data: 15 10 25 12 40arrow_forward
arrow_back_ios
arrow_forward_ios
Recommended textbooks for you
- Text book imageA First Course in Probability (10th Edition)ProbabilityISBN:9780134753119Author:Sheldon RossPublisher:PEARSONText book image
Text book image
A First Course in Probability (10th Edition)
Probability
ISBN:9780134753119
Author:Sheldon Ross
Publisher:PEARSON
Text book image