Glencoe Algebra 1, Student Edition, 9780079039897, 0079039898, 2018
Glencoe Algebra 1, Student Edition, 9780079039897, 0079039898, 2018
18th Edition
ISBN: 9780079039897
Author: Carter
Publisher: McGraw Hill
expand_more
expand_more
format_list_bulleted
Bartleby Related Questions Icon
Related questions
Question
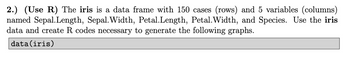
Transcribed Image Text:2.) (Use R) The iris is a data frame with 150 cases (rows) and 5 variables (columns)
named Sepal.Length, Sepal. Width, Petal.Length, Petal.Width, and Species. Use the iris
data and create R codes necessary to generate the following graphs.
data(iris)
Transcribed Image Text:}
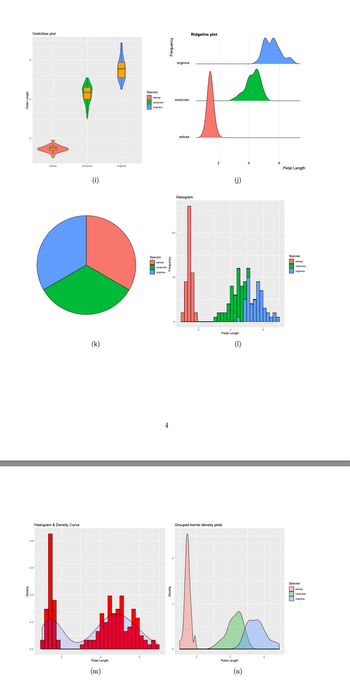
Violin/box plot
0.8-
0.6
0.2
selosa
(i)
virginica
virginical
Species
selosa
versicolor
virginica
Species
E
versicolor
setosa
Ridgeline plot
Histogram
(j)
(k)
Petal Length
(1)
4
Histogram & Density Curve
Grouped kernel density plots
Petal Length
Petal Length
(m)
(n)
6
Petal Length
Species
versicolor
virginica
Species
versicolor
☐ virginica
Expert Solution
Check MarkThis question has been solved!
Explore an expertly crafted, step-by-step solution for a thorough understanding of key concepts.
bartleby
Step by stepSolved in 2 steps with 3 images
Knowledge Booster
Background pattern image
Recommended textbooks for you
- Text book imageGlencoe Algebra 1, Student Edition, 9780079039897...AlgebraISBN:9780079039897Author:CarterPublisher:McGraw HillText book imageHolt Mcdougal Larson Pre-algebra: Student Edition...AlgebraISBN:9780547587776Author:HOLT MCDOUGALPublisher:HOLT MCDOUGALText book imageAlgebra & Trigonometry with Analytic GeometryAlgebraISBN:9781133382119Author:SwokowskiPublisher:Cengage
- Text book imageText book imageText book imageAlgebra: Structure And Method, Book 1AlgebraISBN:9780395977224Author:Richard G. Brown, Mary P. Dolciani, Robert H. Sorgenfrey, William L. ColePublisher:McDougal Littell
Text book image
Glencoe Algebra 1, Student Edition, 9780079039897...
Algebra
ISBN:9780079039897
Author:Carter
Publisher:McGraw Hill
Text book image
Holt Mcdougal Larson Pre-algebra: Student Edition...
Algebra
ISBN:9780547587776
Author:HOLT MCDOUGAL
Publisher:HOLT MCDOUGAL
Text book image
Algebra & Trigonometry with Analytic Geometry
Algebra
ISBN:9781133382119
Author:Swokowski
Publisher:Cengage
Text book image
Text book image
Text book image
Algebra: Structure And Method, Book 1
Algebra
ISBN:9780395977224
Author:Richard G. Brown, Mary P. Dolciani, Robert H. Sorgenfrey, William L. Cole
Publisher:McDougal Littell