Electricity for Refrigeration, Heating, and Air Conditioning (MindTap Course List)
Electricity for Refrigeration, Heating, and Air Conditioning (MindTap Course List)
10th Edition
ISBN: 9781337399128
Author: Russell E. Smith
Publisher: Cengage Learning
expand_more
expand_more
format_list_bulleted
Bartleby Related Questions Icon
Related questions
Question
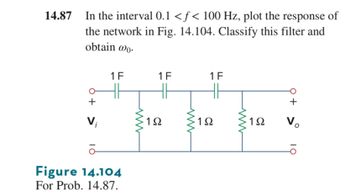
Transcribed Image Text:14.87
In the interval 0.1 <f< 100 Hz, plot the response of
the network in Fig. 14.104. Classify this filter and
obtain @o.
+
Vi
Figure 14.104
For Prob. 14.87.
1F
1 F
1 F
ww
192
www
192
www
+
1Ω
Vo
01
Expert Solution
Check MarkThis question has been solved!
Explore an expertly crafted, step-by-step solution for a thorough understanding of key concepts.
bartleby
Step by stepSolved in 2 steps with 3 images
Knowledge Booster
Background pattern image
Recommended textbooks for you
- Text book imageElectricity for Refrigeration, Heating, and Air C...Mechanical EngineeringISBN:9781337399128Author:Russell E. SmithPublisher:Cengage LearningText book imageEBK ELECTRICAL WIRING RESIDENTIALElectrical EngineeringISBN:9781337516549Author:SimmonsPublisher:CENGAGE LEARNING - CONSIGNMENTText book imageDelmar's Standard Textbook Of ElectricityElectrical EngineeringISBN:9781337900348Author:Stephen L. HermanPublisher:Cengage Learning
- Text book imagePower System Analysis and Design (MindTap Course ...Electrical EngineeringISBN:9781305632134Author:J. Duncan Glover, Thomas Overbye, Mulukutla S. SarmaPublisher:Cengage LearningText book image
Text book image
Electricity for Refrigeration, Heating, and Air C...
Mechanical Engineering
ISBN:9781337399128
Author:Russell E. Smith
Publisher:Cengage Learning
Text book image
EBK ELECTRICAL WIRING RESIDENTIAL
Electrical Engineering
ISBN:9781337516549
Author:Simmons
Publisher:CENGAGE LEARNING - CONSIGNMENT
Text book image
Delmar's Standard Textbook Of Electricity
Electrical Engineering
ISBN:9781337900348
Author:Stephen L. Herman
Publisher:Cengage Learning
Text book image
Power System Analysis and Design (MindTap Course ...
Electrical Engineering
ISBN:9781305632134
Author:J. Duncan Glover, Thomas Overbye, Mulukutla S. Sarma
Publisher:Cengage Learning
Text book image