Algebra & Trigonometry with Analytic Geometry
Algebra & Trigonometry with Analytic Geometry
13th Edition
ISBN: 9781133382119
Author: Swokowski
Publisher: Cengage
expand_more
expand_more
format_list_bulleted
Bartleby Related Questions Icon
Related questions
Question
thumb_up100%
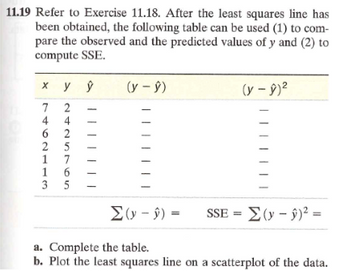
Transcribed Image Text:11.19 Refer to Exercise 11.18. After the least squares line has
been obtained, the following table can be used (1) to com-
pare the observed and the predicted values of y and (2) to
compute SSE.
x y ŷ
(y-ŷ)
7 2
4
2
4
2
1 7
16
3 5
-
(y-ŷ)2
Σ(y-ŷ)=
SSE =(y-ŷ)2=
a. Complete the table.
b. Plot the least squares line on a scatterplot of the data.
Expert Solution
Check MarkThis question has been solved!
Explore an expertly crafted, step-by-step solution for a thorough understanding of key concepts.
bartleby
Step by stepSolved in 2 steps with 8 images
Knowledge Booster
Background pattern image
Recommended textbooks for you
- Text book imageAlgebra & Trigonometry with Analytic GeometryAlgebraISBN:9781133382119Author:SwokowskiPublisher:CengageText book imageLinear Algebra: A Modern IntroductionAlgebraISBN:9781285463247Author:David PoolePublisher:Cengage Learning
Text book image
Algebra & Trigonometry with Analytic Geometry
Algebra
ISBN:9781133382119
Author:Swokowski
Publisher:Cengage
Text book image
Linear Algebra: A Modern Introduction
Algebra
ISBN:9781285463247
Author:David Poole
Publisher:Cengage Learning