Bartleby Related Questions Icon
Related questions
Question
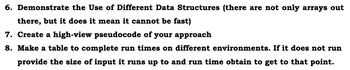
Transcribed Image Text:6. Demonstrate the Use of Different Data Structures (there are not only arrays out
there, but it does it mean it cannot be fast)
7. Create a high-view pseudocode of your approach
8. Make a table to complete run times on different environments. If it does not run
provide the size of input it runs up to and run time obtain to get to that point.
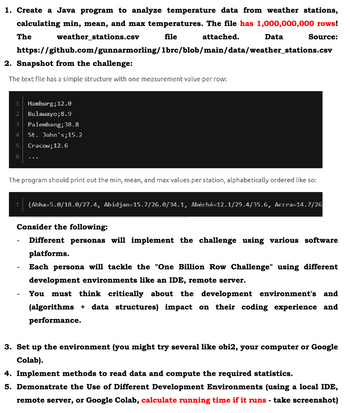
Transcribed Image Text:1. Create a Java program to analyze temperature data from weather stations,
calculating min, mean, and max temperatures. The file has 1,000,000,000 rows!
The
weather_stations.csv
file
attached.
Data
Source:
https://github.com/gunnarmorling/1brc/blob/main/data/weather_stations.csv
2. Snapshot from the challenge:
The text file has a simple structure with one measurement value per row:
1 Hamburg; 12.0
2
Bulawayo; 8.9
3
Palembang; 38.8
4
St. John's; 15.2
5 Cracow; 12.6
6
The program should print out the min, mean, and max values per station, alphabetically ordered like so:
1
{Abha=5.0/18.0/27.4, Abidjan=15.7/26.0/34.1, Abéché-12.1/29.4/35.6, Accra=14.7/26
Consider the following:
Different personas will implement the challenge using various software
platforms.
Each persona will tackle the "One Billion Row Challenge" using different
development environments like an IDE, remote server.
You must think critically about the development environment's and
(algorithms + data structures) impact on their coding experience and
performance.
3. Set up the environment (you might try several like obi2, your computer or Google
Colab).
4. Implement methods to read data and compute the required statistics.
5. Demonstrate the Use of Different Development Environments (using a local IDE,
remote server, or Google Colab, calculate running time if it runs - take screenshot)
Expert Solution
Check MarkThis question has been solved!
Explore an expertly crafted, step-by-step solution for a thorough understanding of key concepts.
bartleby
Step by stepSolved in 2 steps with 7 images