This site needs JavaScript to work properly. Please enable it to take advantage of the complete set of features!
Skip to main page content
U.S. flag

An official website of the United States government

Dot gov

The .gov means it’s official.
Federal government websites often end in .gov or .mil. Before sharing sensitive information, make sure you’re on a federal government site.

Https

The site is secure.
The https:// ensures that you are connecting to the official website and that any information you provide is encrypted and transmitted securely.

NIH NLM Logo
Log in
Access keys NCBI Homepage MyNCBI Homepage Main Content Main Navigation
. 2023 Aug 1;15(8):evad115.
doi: 10.1093/gbe/evad115.

Extensive Copy Number Variation Explains Genome Size Variation in the Unicellular Zygnematophycean Alga, Closterium peracerosum-strigosum-littorale Complex

Affiliations

Extensive Copy Number Variation Explains Genome Size Variation in the Unicellular Zygnematophycean Alga, Closterium peracerosum-strigosum-littorale Complex

Yawako W Kawaguchi et al. Genome Biol Evol. .

Abstract

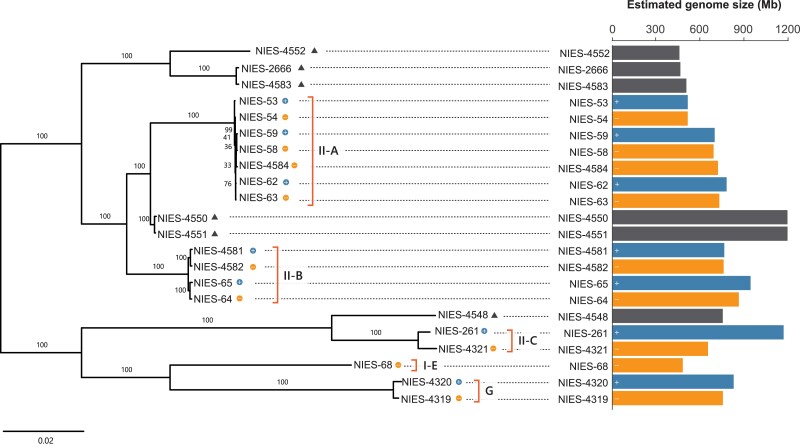
Genome sizes are known to vary within and among closely related species, but the knowledge about genomic factors contributing to the variation and their impacts on gene functions is limited to only a small number of species. This study identified a more than 2-fold heritable genome size variation among the unicellular Zygnematophycean alga, Closterium peracerosum-strigosum-littorale (C. psl.) complex, based on short-read sequencing analysis of 22 natural strains and F1 segregation analysis. Six de novo assembled genomes revealed that genome size variation is largely attributable to genome-wide copy number variation (CNV) among strains rather than mating type-linked genomic regions or specific repeat sequences such as rDNA. Notably, about 30% of genes showed CNV even between strains that can mate with each other. Transcriptome and gene ontology analysis demonstrated that CNV is distributed nonrandomly in terms of gene functions, such that CNV was more often observed in the gene set with stage-specific expression. Furthermore, in about 30% of these genes with CNV, the expression level does not increase proportionally with the gene copy number, suggesting presence of dosage compensation, which was overrepresented in genes involved in basic biological functions, such as translation. Nonrandom patterns in gene duplications and corresponding expression changes in terms of gene functions may contribute to maintaining the high level of CNV associated with extensive genome size variation in the C. psl. complex, despite its possible detrimental effects.

Keywords: copy number variation; dosage compensation; gene duplication; green algae.


Figures

<sc>Fig.</sc> 1.
Fig. 1.
The life cycle of the C. psl. complex. (a) A photograph of vegetative cells of the NIES-65 strain in the C. psl. complex. (b, c) Schematic illustrations of the life cycle of homothallic (b) and heterothallic (c) strains in the C. psl. complex.
<sc>Fig.</sc> 2.
Fig. 2.
Phylogenetic relationship and estimated genome size variation in the 22 strains of the C. psl. complex. The tree was constructed using the maximum likelihood method based on 79,377 SNPs obtained through mapping to the NIES-4552 strain as a reference. k-mer analyses estimated the genome size. II-A, II-B, II-C, I-E, and G indicate mating groups. Triangles and circles indicate homothallic and heterothallic (mt+ and mt−) strains, respectively. The bars show the genome size of the respective strains. Mating types (mt+ and mt) are defined for each mating group and may not be comparable across II-A, II-B, II-C, I-E, and G, as different mating groups cannot reproduce with each other.
<sc>Fig.</sc> 3.
Fig. 3.
Genome size variation of F1 lines estimated by flow cytometry. (a) Genome size of each F1 line. Mating types (mt− and mt−) of each line are also indicated. (b) Genome size was not significantly different between mating types (P = 0.149; t-test). Each dot shows the average genome size of each F1 line. Bars and boxes represent the median and the interquartile range, respectively. Whiskers extend to 1.5 times the interquartile range.
<sc>Fig.</sc> 4.
Fig. 4.
Total genome size and CNV of the de novo assembled genomes. (a) The total length of the de novo assembled sequences. (b) Copy numbers of OGs shared by the six de novo assembled genomes. The numbers in the bar indicate the copy number. We defined the copy number as the number of genes assigned to the identical OG. (c) A schematic diagram illustrating how to calculate the average copy number of OGs per contig. (d) Distribution of the average copy number of the OGs per contig of four strains with high-quality genomes.
<sc>Fig.</sc> 5.
Fig. 5.
The origins of duplicated genes found in the group II-A, the group II-B, the NIES-4550 strain, and the NIES-4552 strain. (a) The mapping depth of short reads from groups II-A (NIES-58 and NIES-59) and II-B (NIES-64 and NIES-65) to the assembled genome of NIES-4550. (b) Clarifying the origins of duplicated genes found in the group II-A, the group II-B, and the NIES-4552 strain. If duplications occurred independently in each strain, gene copies from the same strains should form a clade. The origins of duplicated genes of the 246 OGs that have two to four copies in the group II-A, the group II-B, and the NIES-4552 strain. Each group formed a clade with high bootstrap support (≥70%) in 147–216 OGs. Note that this is a schematic phylogenetic tree, and three clades are shown in a single figure for simplicity. In the actual analysis, the monophyly of three groups was investigated separately.
<sc>Fig.</sc> 6.
Fig. 6.
Correlations between expression levels and gene dosages. (a) Copy number difference of OGs between the NIES-64 and NIES-65 strains. We defined the copy number as the number of genes assigned to the identical OG. OGs with more than four copies are not shown. (b) Frequency of DNA depth log-ratio for each OG (see supplementary fig. S9, Supplementary Material online for other ranges of a total DNA depth). (c) An MA plot of gene expression difference between the NIES-64 and NIES-65 strains. Expression data from the stage L were used (see supplementary fig. S10, Supplementary Material online for other stages). The number of genes and color in each category, DEGs or not, and with or without CNV, is shown in the upper right table. The genes with CNV were defined based on the DNA depth log-ratio (see Materials and Methods for details). (d) The expression level and gene dosage difference between the NIES-64 and NIES-65 strains. Expression data from the stage L were used (see supplementary fig. S11, Supplementary Material online for other stages). A solid line shows the expected relationship representing proportional increases in expression difference to dosage difference, whereas a dashed line represents the simple regression. Dosage-compensated genes are shown in red.
<sc>Fig.</sc> 7.
Fig. 7.
GO enrichment analysis of dosage-compensated genes. Among the GO terms including more than nine genes, those with enrichment of dosage-compensated genes in at least two stages are shown (P < 0.05; Fisher's exact test with the "weight01" algorithm in the R package topGO, Alexa et al. 2006). The dot size indicates the fold enrichment. Each column shows results during each stage: during vegetative reproduction in light (L), during vegetative reproduction in dark (D), under a nitrogen-depleted condition (M), and in the mating-induced conditioned medium for 8 h (C8h) and 24 h (C24h).

References

    1. Ågren JA, Wright SI. 2011. Co-evolution between transposable elements and their hosts: a major factor in genome size evolution? Chromosome Res. 19:777–786. - PubMed
    1. Alexa A, Rahnenführer J, Lengauer T. 2006. Improved scoring of functional groups from gene expression data by decorrelating GO graph structure. Bioinformatics 22:1600–1607. - PubMed
    1. Altschul SF, Gish W, Miller W, Myers EW, Lipman DJ. 1990. Basic local alignment search tool. J Mol Biol. 215:403–410. - PubMed
    1. Ameijeiras-Alonso J, Crujeiras RM, Rodriguez-Casal A. 2021. Multimode: an R package for mode assessment. J Stat Softw. 97:1–32.
    1. Biémont C. 2008. Genome size evolution: within-species variation in genome size. Heredity (Edinb). 101:297–298. - PubMed

Publication types

Cite

AltStyle によって変換されたページ (->オリジナル) /