This site needs JavaScript to work properly. Please enable it to take advantage of the complete set of features!
Skip to main page content
U.S. flag

An official website of the United States government

Dot gov

The .gov means it’s official.
Federal government websites often end in .gov or .mil. Before sharing sensitive information, make sure you’re on a federal government site.

Https

The site is secure.
The https:// ensures that you are connecting to the official website and that any information you provide is encrypted and transmitted securely.

NIH NLM Logo
Log in
Access keys NCBI Homepage MyNCBI Homepage Main Content Main Navigation
. 2022 Oct 24:37:e00769.
doi: 10.1016/j.btre.2022.e00769. eCollection 2023 Mar.

Coproduction of lipids and carotenoids by the novel green alga Coelastrella sp. depending on cultivation conditions

Affiliations

Coproduction of lipids and carotenoids by the novel green alga Coelastrella sp. depending on cultivation conditions

Mizuki Saito et al. Biotechnol Rep (Amst). .

Abstract

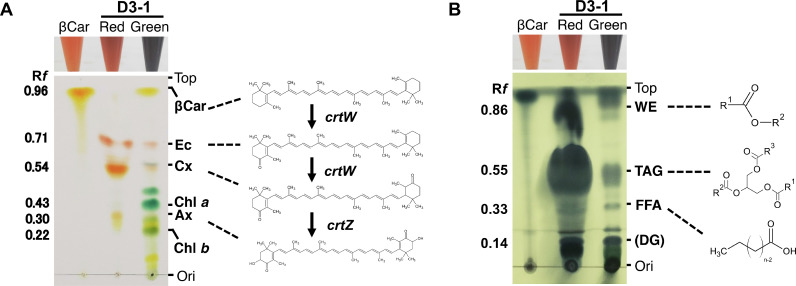
A novel green alga Coelastrella sp. D3-1 was isolated, and its unique and significant lipid and carotenoid coproduction capability was characterised depending on cultivation conditions. The main component of produced lipids was triacylglycerol under nutrient depletion conditions, in which fatty-methyl-esters made up 20-44% of the dry cell weight (DCW) and consisted of abundant C16:0 and C18:1 fatty acids. The red (orange)-stage cells also produced a large portion of carotenoids (38.5% of the DCW) involving echinenone, canthaxanthin, and astaxanthin as major components accumulated over only 5-6 days under optimal conditions. Stress tests revealed resistance of the cells to pH 2-11, high temperatures (40-60 °C), ultraviolet irradiation, drought, and H2O2 treatment, thereby showing a robust nature. Both green- and red (orange)-stage cell extracts also showed antioxidant and anti-inflammatory abilities, implying that they have significant functions as useful biorefinery materials.

Keywords: Biorefinery; Carotenoid; Coelastrella; Dual production; Lipid.


Conflict of interest statement

None

Figures

Fig 1
Fig. 1
Identification of isolated Coelastrella sp. D3–1. (A) The 18S rDNA–ITS1–5.8S–ITS2 region on the genome and the nucleotide sequence alignment of a part of the region. The region (3,258 bp, DDBJ accession number LC702913) was amplified via PCR with a set of primers (93F and ITS2_r), cloned, sequenced, and subjected to database analysis. Asterisks show distinct nucleotide sequences between D3–1 and other Coelastrella sp. strains. (B) Phylogenetic analysis of the 18S rDNA sequences was used for the classification of D3–1 cells. Respective cases are shown with accession numbers. A bootstrap test was performed with 1,000 replicates. The 18S rDNA sequence of Chlamydomonas moewusii was utilised as an out-group. The scale bar indicates 〜6% sequence divergence.
Fig 2
Fig. 2
Lipid production in isolated green algae. (A) A total of 19 isolated green algae were cultivated in BG11–P medium under a static condition with white-light irradiation (30 μmol photons m−2s−1) in 0.04% CO2 air at 30 °C for 14 days. FAMEs derived from the cells were subjected to FID analysis and methyl-esterified fatty acid compositions were determined as a percentage (%). (B) The six strains were cultivated in 0.2BG11 under a reciprocating shaking condition (40 rpm), with white-light irradiation (100 μmol photons m−2s−1 in an incubator with 3% CO2-containing air at 30 °C for 6 days. Total lipids (fatty acids) were extracted from the cells and FAMEs were subjected to FID analysis. Total amounts of FAMEs from DCW or 1 litter of cell culture are shown as a percentage (%) in the left panel or as mg in the right panel, respectively.
Fig 3
Fig. 3
TLC analysis for pigments and lipids. TLC analysis was performed for pigments (A) or FAMEs (B). A 20 μL aliquot of the extract was spotted on the origin (ori) of a silica gel plate. This plate was subjected to TLC with a developer eluent. Positions referring to respective pigments are shown as β-carotene (βCar), echinenone (Ec), canthaxanthin (Cx), astaxanthin (Ax), and chlorophylls on the right. The Rf values are shown on the left. Chemical structures of respective compounds are also shown with biosynthesis genes.
Fig 4
Fig. 4
Red/green-stage cells and their stress resistance. (A) D3–1 cells were cultivated under four distinct SCC (Rd1.0BGp4m, Gr1.0BGp2m, Rd0.2BGc7d, and Gr1.0BGc7d), harvested, and exposed to several stresses. The appearance of cultured cells and the optical micrograph of the red/green-stage cells are shown. Scale bar: 10 μm. (B) After the stress treatment, the same amounts of aliquots of resultant cells were spotted on BG11 plates and the cells were grown under SCC for 7 days. The stress items and prepared cell types are shown. If there is a difference in growth, it is indicated by a square frame.
Fig 5
Fig. 5
Antioxidant capacities of D3–1 red/green extracts. Antioxidant capacities were measured using the ABTS method. 20 μL aliquots of sample extracts under SCC at concentrations of ×ばつ 1.0 (high), ×ばつ 0.2 (medium), ×ばつ 0.04 (low) were prepared and mixed with 180 μL of ABTS working solution, and the absorbance (A734) of the mixture was measured. Fx, fucoxanthin; βCar, β-carotene. The maximum antioxidant capacity was taken as 100% and the relative values are shown. The sample extracts (×ばつ 1.0 concentration) in microtubes are shown at the top. The measurements were performed according to three independent experiments and error bars are also shown. Significance was determined using a t-test: *, P < 0.01; **, P < 0.00001; ***, P < 0.0000001.
Fig 6
Fig. 6
Anti-inflammatory properties of D3–1 red/green extracts. Anti-inflammatory properties of the extracts were measured using the Griess method. A 10 μL aliquot of extract under SCC at different concentrations (×ばつ 1.0, ×ばつ 0.2, ×ばつ 0.04) was prepared and subjected to 100 μL cell culture of the mouse macrophage RAW264 with LPS (10 μL). LPS was used as a control for nitric monoxide (NO) production (+, with LPS; −, without LPS). NO production with LPS is relatively shown as 100%. Sample photography is shown at the top. The measurements were performed according to three independent experiments and error bars are also shown. Significance was determined using a t-test: *, P < 0.075; **, P < 0.05; ***, P < 0.001.

References

    1. Brennan L., Owende P. Biofuels from microalgae–A review of technologies for production, processing, and extractions of biofuels and co-products. Renew. Sustain. Energy Rev. 2010;14:557–577. doi: 10.1016/j.rser.200910009. - DOI
    1. Caporgno M.P., Mathys A. Trends in microalgae incorporation into innovative food products with potential health benefits. Front. Nutr. 2018;5:58. doi: 10.3389/fnut.2018.00058. - DOI - PMC - PubMed
    1. Chisti Y. Biodiesel from microalga. Biotechnol. Adv. 2007;25:294–306. doi: 10.1016/j.biotechadv.200702001. - DOI - PubMed
    1. Fan J., Andre C., Wu C. A chloroplast pathway for the de novo biosynthesis of triacylglycerol in Chlamydomonas reinhardtii. FEBS Lett. 2011;585:1985–1991. doi: 10.1016/j.febslet.2011年05月01日8. - DOI - PubMed
    1. Li X., Přibyl P., Bišová K., Kawano S., Cepák V., Zachleder V., Čížková M., Brányiková I., Vítová M. The Microalga Parachlorella kessleri–A Novel Highly Efficient Lipid Producer. Biotechnol. Bioeng. 2013;110:97–107. doi: 10.1002/bit.24595. - DOI - PubMed

LinkOut - more resources

Cite

AltStyle によって変換されたページ (->オリジナル) /