This site needs JavaScript to work properly. Please enable it to take advantage of the complete set of features!
Skip to main page content
U.S. flag

An official website of the United States government

Dot gov

The .gov means it’s official.
Federal government websites often end in .gov or .mil. Before sharing sensitive information, make sure you’re on a federal government site.

Https

The site is secure.
The https:// ensures that you are connecting to the official website and that any information you provide is encrypted and transmitted securely.

NIH NLM Logo
Log in
Access keys NCBI Homepage MyNCBI Homepage Main Content Main Navigation
. 2020 Feb;101(2-1):022416.
doi: 10.1103/PhysRevE.101.022416.

Motility and phototaxis of Gonium, the simplest differentiated colonial alga

Affiliations

Motility and phototaxis of Gonium, the simplest differentiated colonial alga

Hélène de Maleprade et al. Phys Rev E. 2020 Feb.

Abstract

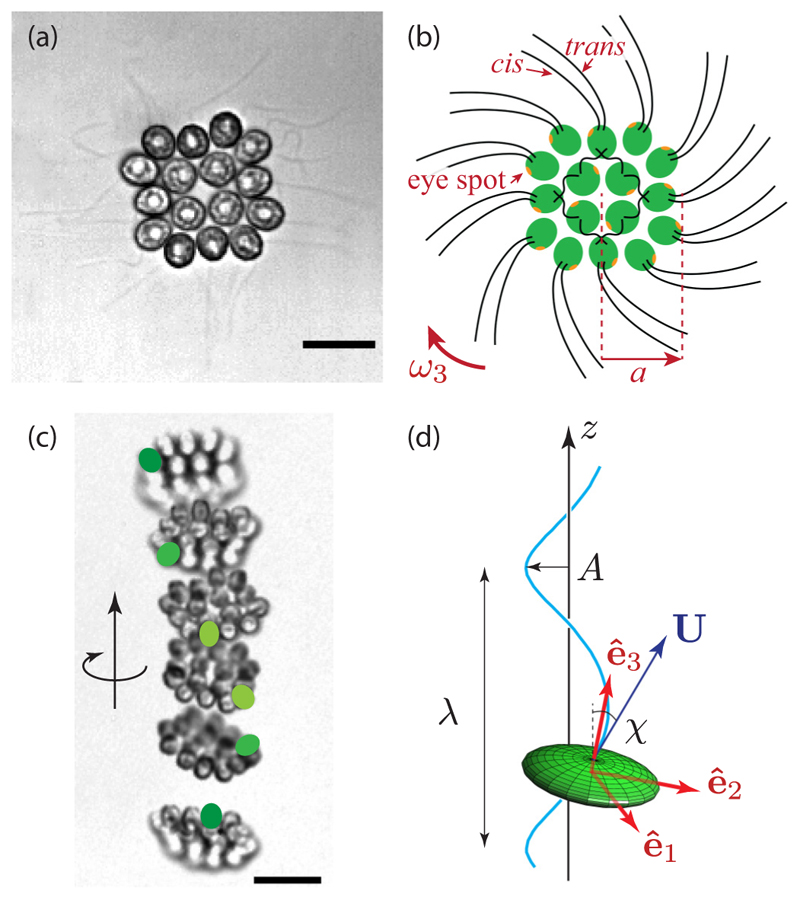
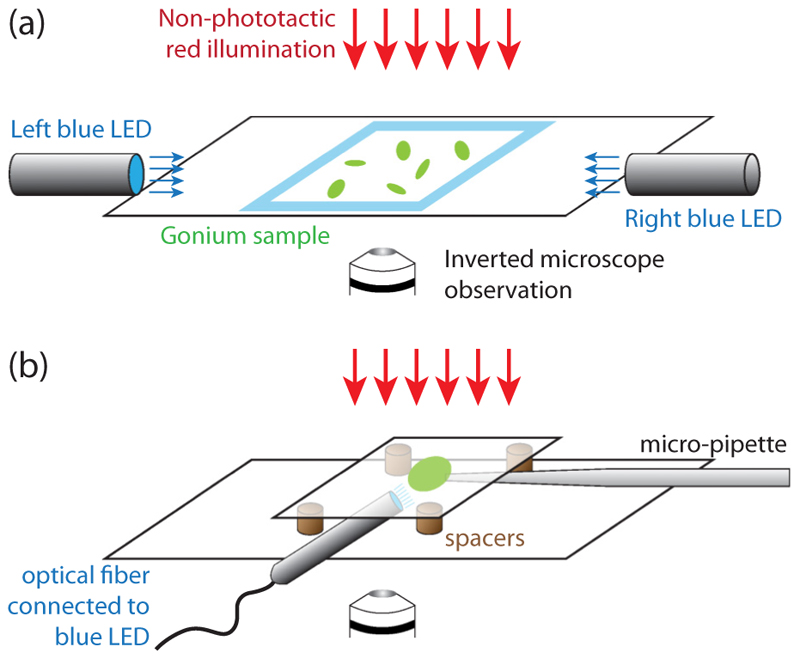
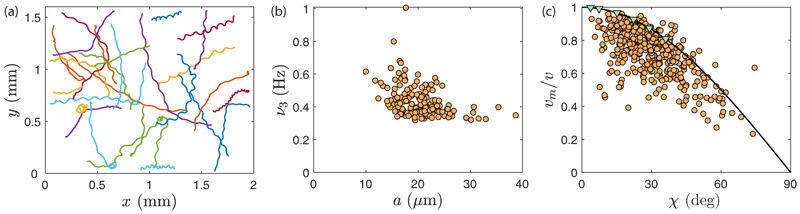
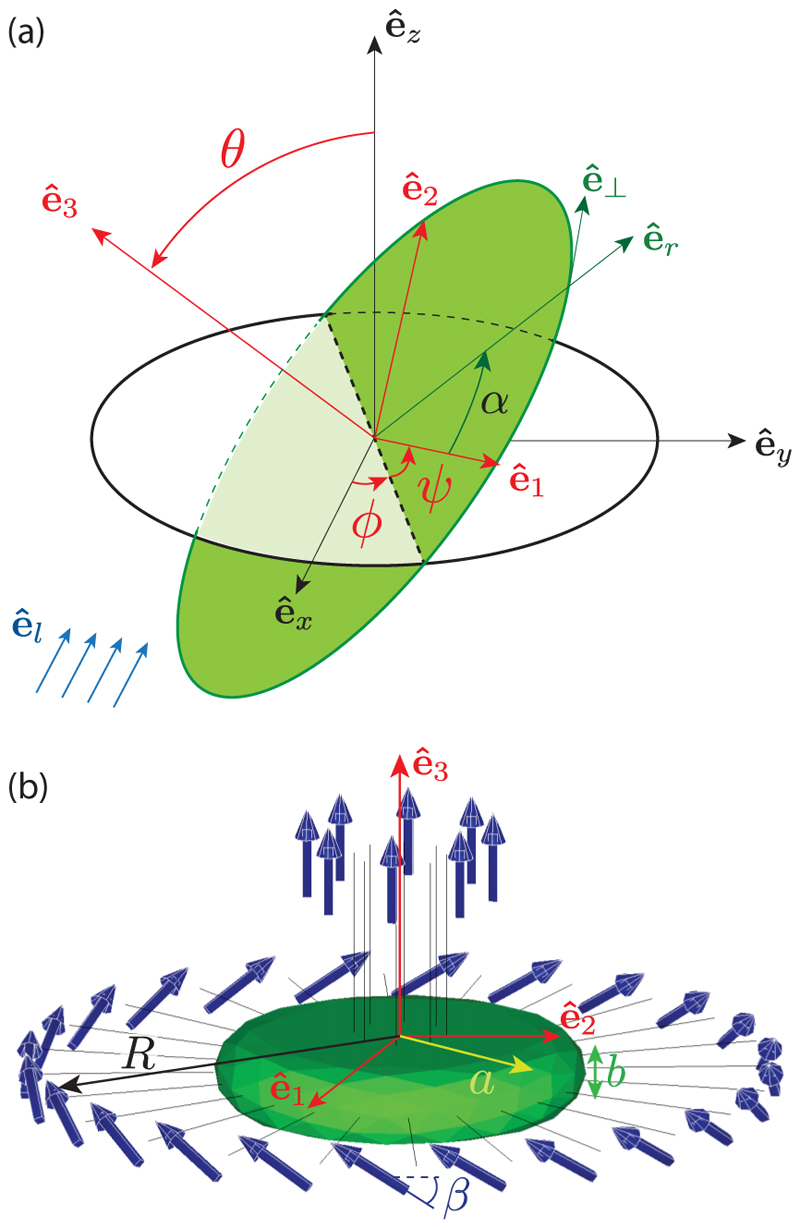
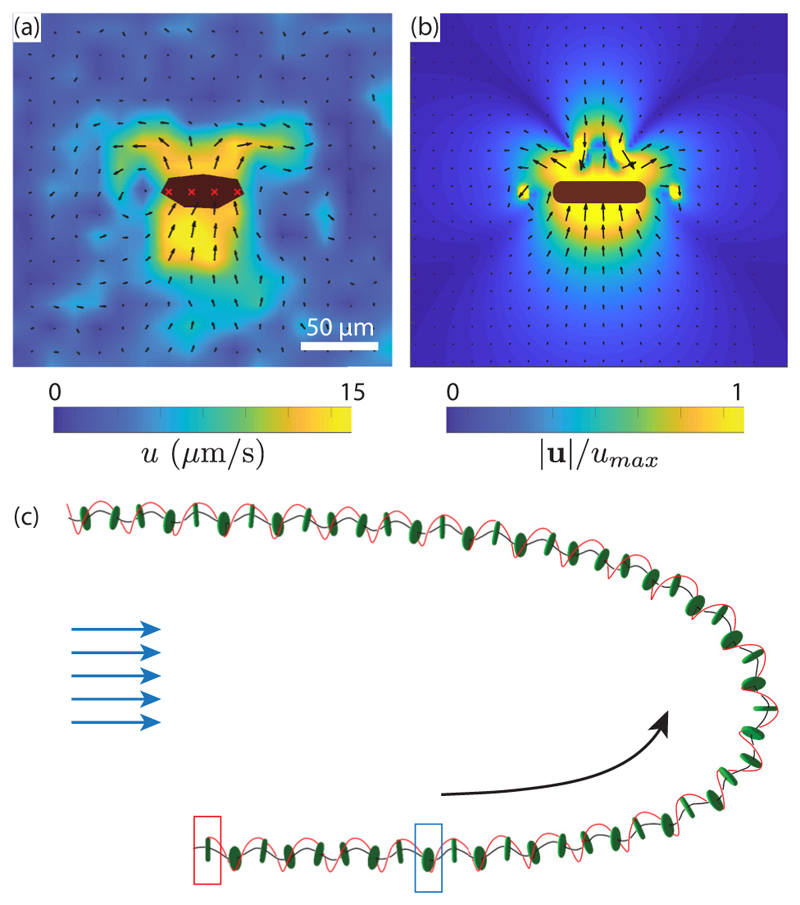
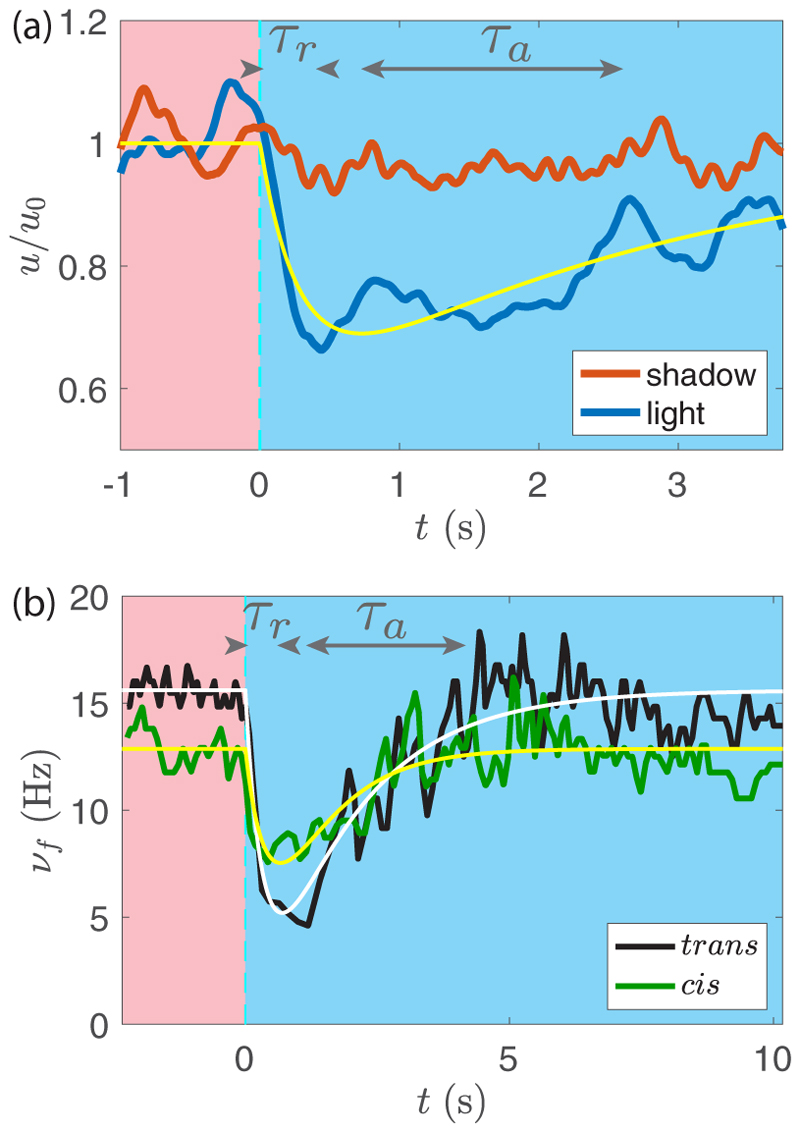
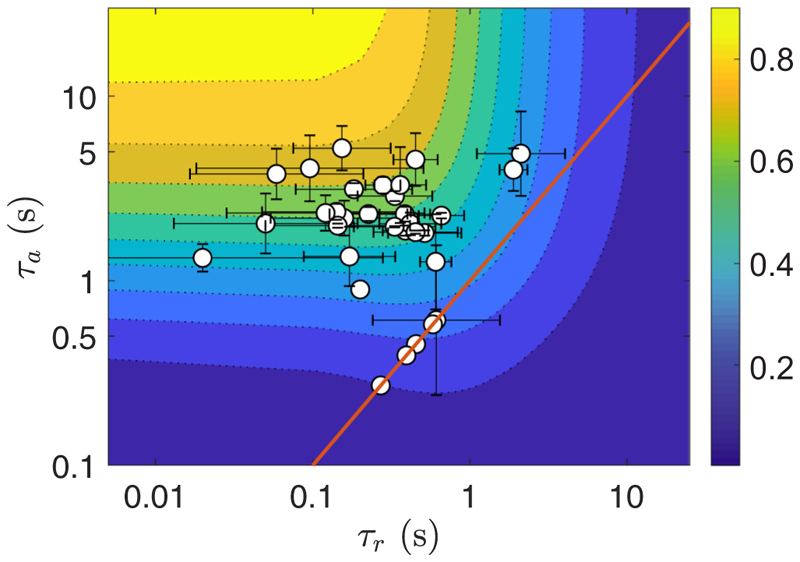
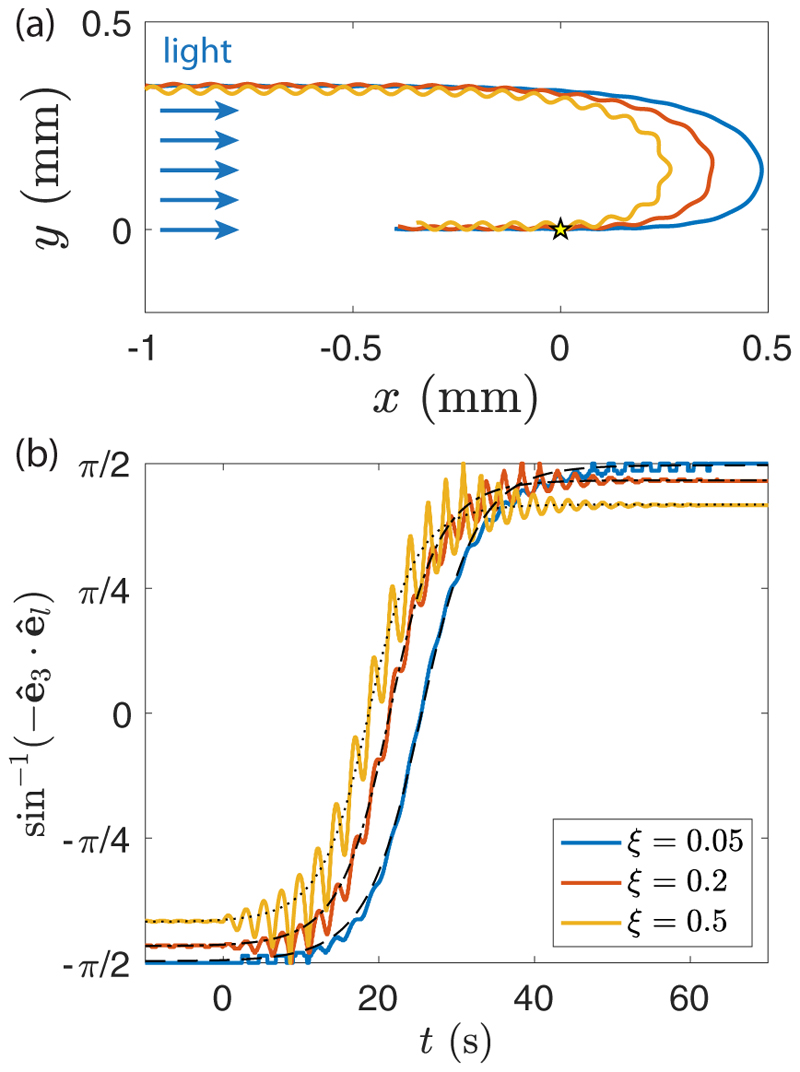
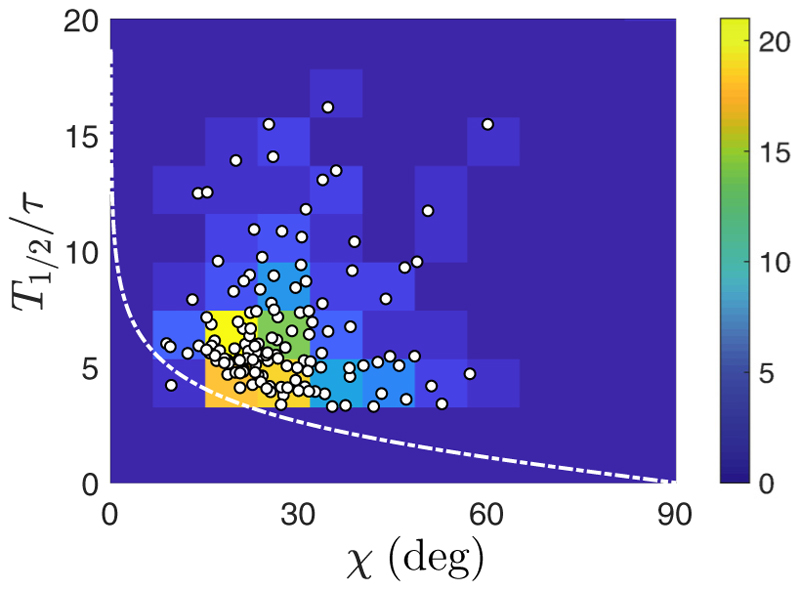
Green algae of the Volvocine lineage, spanning from unicellular Chlamydomonas to vastly larger Volvox, are models for the study of the evolution of multicellularity, flagellar dynamics, and developmental processes. Phototactic steering in these organisms occurs without a central nervous system, driven solely by the response of individual cells. All such algae spin about a body-fixed axis as they swim; directional photosensors on each cell thus receive periodic signals when that axis is not aligned with the light. The flagella of Chlamydomonas and Volvox both exhibit an adaptive response to such signals in a manner that allows for accurate phototaxis, but in the former the two flagella have distinct responses, while the thousands of flagella on the surface of spherical Volvox colonies have essentially identical behavior. The planar 16-cell species Gonium pectorale thus presents a conundrum, for its central 4 cells have a Chlamydomonas-like beat that provide propulsion normal to the plane, while its 12 peripheral cells generate rotation around the normal through a Volvox-like beat. Here we combine experiment, theory, and computations to reveal how Gonium, perhaps the simplest differentiated colonial organism, achieves phototaxis. High-resolution cell tracking, particle image velocimetry of flagellar driven flows, and high-speed imaging of flagella on micropipette-held colonies show how, in the context of a recently introduced model for Chlamydomonas phototaxis, an adaptive response of the peripheral cells alone leads to photoreorientation of the entire colony. The analysis also highlights the importance of local variations in flagellar beat dynamics within a given colony, which can lead to enhanced reorientation dynamics.


Figures

Fig. 1
Fig. 1. Geometry and locomotion of Gonium pectorale.
(a) Sixteen-cell colony. Each cell has two flagella, 30–40 μm long. Scale bar is 10 μm. (b) Schematic of a colony of radius a: sixteen cells (green) each with one eye spot (orange dot). The cis flagellum is closest to the eye spot, the trans flagellum is furthest [21]. Flagella of the central cells beat in an opposing breaststoke, while the peripheral flagella beat in parallel. The pinwheel organization of the peripheral flagella leads to a left-handed body rotation at a rate ω3. (c) Upward swimming of a colony. Superimposition of images separated by 0.4 s. Green spots label one specific cell to highlight the left-handed rotation. Scale bar is 20 μm. (d) Sketch of a helical trajectory: a colony (green ellipsoid) swims with velocity U along an oscillatory path (blue line) of wavelength λ, amplitude A, and pitch angle χ. The frame (ê1, ê2, ê3) is attached to the Gonium body.
Fig. 2
Fig. 2. Phototaxis experiments.
(a) Gonium colonies swim in a sealed chamber made of two glass slides, with nonphototactic red illumination from above, on the stage of an inverted microscope connected to a high-speed video camera. Two blue LEDs on the right- and left-hand sides of the chamber can independently shine light with controllable intensities. (b) Micropipette experiments. A micropipette of inner diameter ~20 μm holds a colony (green disk) in a chamber made of two glass slides, spaced to allow room for optical fiber connected to a blue LED to enter the chamber.
Fig. 3
Fig. 3. Free swimming of Gonium.
(a) Trajectories of many colonies under nonphototactic illumination, showing random swimming. Each colored line shows the path of one colony (sample size: 27 colonies). (b) Body rotation frequency ν3 as a function of colony radius a (sample size: 159 colonies). (c) Mean velocity vm normalized by the instantaneous swimming velocity v as a function of helix pitch angle χ (sample size: 430 colonies). The black line indicates the relation vm/v = cos χ and green triangles along it are results from the numerical simulations as described in text.
Fig. 4
Fig. 4. Details of computational geometry.
(a) Coordinates system and Euler angles. The frame (êx, êy, êz) is attached to the laboratory; the frame (ê1, ê2, ê3) is attached to the Gonium body (green disk), with ê3 the symmetry axis and (ê1, ê2) in the body plane. Euler angles (θ, φ, ψ) relate the two frames: by definition, θ is the angle between êz and ê3, φ is the angle from êx to the line of nodes (dotted line), and ψ is the angle from the line of nodes to ê1. In the Gonium body plane (ê1, ê2), the flagella are labeled by the angle α, with (êr, ê) the corresponding local frame such that cos α = ê1 · êr. For the computation of the phototactic response, we assume the light is incident along êl = − êx (blue arrows). (b) Gonium geometry for simulations. The body (in green) is a thick disk with radius a = 20 μm and thickness b = 8 μm. Flagella (length 20 μm) associated with a point force 20 μm away from the cell body are attached to the body. The 8 central flagella generate thrust while the 24 peripheral ones are tilted by β ≃ 30° and generate both thrust and rotation.
Fig. 5
Fig. 5. Photoresponse of Gonium.
[(a) and (b)] Flow fields around a colony swimming toward the top of the image in the laboratory frame. (a) Micro-PIV measurements (the body is in black with red crosses). The background color shows the norm of the velocity, varying here up to 15 μm/s. Scale bar is 50 μm. (b) Numerical flow field using the point-force model. (c) Wavy trajectory of a colony, numerically computed for ξ = 0.4 and μs0 = 0.5. The initial position is shown by the red rectangle, and the time when light is switched on from the left is indicated by the blue rectangle. Black line shows the trajectory, and the red line follows the position of the point of maximal force, α = 0, highlighting rotation of the body.
Fig. 6
Fig. 6. Phototactic reorientation of Gonium.
(a) Reorientation trajectories of colonies under blue-light stimulation shone alternatively from right to left twice during 20 s. Each color line corresponds to a single colony and shows a swimming direction alternating to the right and left according to the change in light source position. (b) Instantaneous normalized velocity as a function of time for the blue trajectory in (a). Vertical lines indicate a change in the light source position: Yellow shows times when the light is shone from the right, while green dashed lines stand for light coming from the left. (c) Reorientation time T180° as a function of the light intensity s0. The line shows T180° ≃ 1/s0 for s0 < 1 lux, consistent with Eq. (15), and a saturation at T180° = 5 s at larger s0. The gray shaded area corresponds to times longer than the video-camera trigger.
Fig. 7
Fig. 7
Phototactic turnover after a change of light incidence. Gonium colonies are initially swimming (t < 0 s) toward a light of constant intensity on the right. At t = 0 s, this light is switched off while another of controlled adjustable intensity s0 is shone from the left. Trajectories are reported for t > 0 s and have been shifted to the origin at t = 0 s. Colors along the lines show the time for t > 0 s.
Fig. 8
Fig. 8. Micropipette experiments.
(a) A 16-cell colony held on a micropipette, viewed from posterior side. Flagella are clearly visible and their frequency can be followed as a function of time and light. The blue LED is located in the same plane as the micropipette, a few millimeters below the bottom of the image. [(b)–(d)] Velocity fields measured by micro-PIV, averaged over 1 s at three different times indicated below each panel. The Gonium is seen from the back (flagella away from us). Colormap is the same across the three images, from 0 to 30 μm/s. Light intensity s0 ≈ 1 lux.
Fig. 9
Fig. 9. Adaptive phototactic response.
(a) Normalized azimuthal velocities in the shaded (red curve) and illuminated (blue curve) sides of a colony held on a micropipette (averages over two similar experiments). For t < 0 s there is only red illumination (no phototaxis). Blue light is switched on at t = 0 s. The yellow line displays the adaptive model, Eqs. (7) and (9). (b) Trans and cis flagella beat frequencies νf (in black and green, respectively), of a single cell receiving light (at s0 ≈ 1 lux) as a function of time. White and yellow lines are the respective best fits with Eqs. (7) and (9).
Fig. 10
Fig. 10
Experimental characteristic times (τr, τa) of the adaptive model. Data obtained from the flagella beat frequencies averaged for each colony (sample size: 34 colonies). Background color shows the gain function G defined in Appendix F, Eq. (F8). Red line indicates the relation τr = τa.
Fig. 11
Fig. 11. Numerical results for the phototactic response.
(a) The reorientation trajectories of three wavy swimmers are shown for μs0 = 0.5 (corresponding to s0 ≈ 0.3 lux). They are initially swimming away from the light source and then turn around after the light is switched on from the left when colonies are at the origin (yellow star). (b) Evolution of φ as a function of time for the same swimmers. Light is turned on at t = 0. The thin black dashed, dash-dotted, and dotted lines are the respective fits using Eq. (16), with τ = 4.5 ± 0.1 s, τ = 4.0 ± 0.1 s, and τ = 3.9 ± 0.1 s. Curves are also adjusted with the amplitude parameter π/ 2 − ζ to account for the noise in the swimming direction, respectively 0.99, 0.93, and 0.83 for ξ = 0.05, 0.2, and 0.5.
Fig. 12
Fig. 12
Reorientation time T180°, normalized by τ, as a function of the pitch angle χ. Data (white disks) are extracted from 133 trajectories, under all light conditions presented in Fig. 6(c). The white dashed line shows Eq. (17) and the color background indicates the number of experimental measurements within a bin (size 8° ×ばつ 2).

References

    1. Weismann A. Essays on Heredity and Kindred Biological Problems. Clarendon Press; Oxford, UK: 1892.
    1. Huxley J. The Individual in the Animal Kingdom. Cambridge University Press; Cambridge, UK: 1912.
    1. Kirk D. Volvox Molecular-Genetic Origins of Multicellularity and Cellular Differentiation. Cambridge University Press; Cambridge, UK: 1998.
    1. Goldstein RE. Green algae as model organisms for biological fluid mechanics. Annu Rev Fluid Mech. 2015;47:343. - PMC - PubMed
    1. Goldstein RE. Batchelor prize lecture. fluid dynamics at the scale of the cell. J Fluid Mech. 2016;807:1.

LinkOut - more resources

Cite

AltStyle によって変換されたページ (->オリジナル) /