This site needs JavaScript to work properly. Please enable it to take advantage of the complete set of features!
Skip to main page content
U.S. flag

An official website of the United States government

Dot gov

The .gov means it’s official.
Federal government websites often end in .gov or .mil. Before sharing sensitive information, make sure you’re on a federal government site.

Https

The site is secure.
The https:// ensures that you are connecting to the official website and that any information you provide is encrypted and transmitted securely.

NIH NLM Logo
Log in
Access keys NCBI Homepage MyNCBI Homepage Main Content Main Navigation
Comparative Study
. 2019 Apr 1;11(4):1275-1292.
doi: 10.1093/gbe/evz074.

Tracing the Evolution of the Plastome and Mitogenome in the Chloropicophyceae Uncovered Convergent tRNA Gene Losses and a Variant Plastid Genetic Code

Affiliations
Comparative Study

Tracing the Evolution of the Plastome and Mitogenome in the Chloropicophyceae Uncovered Convergent tRNA Gene Losses and a Variant Plastid Genetic Code

Monique Turmel et al. Genome Biol Evol. .

Abstract

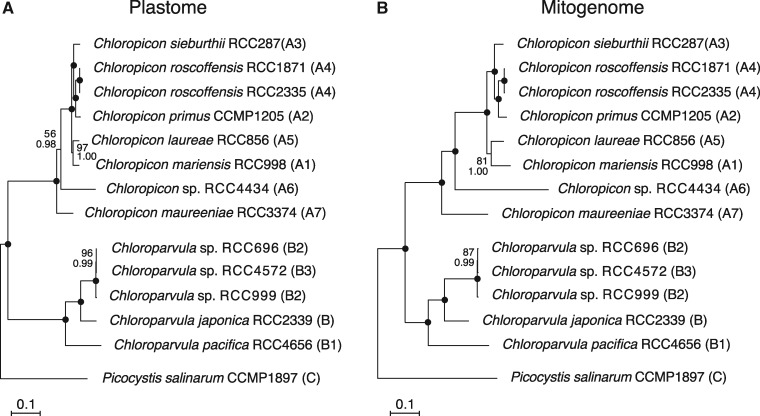
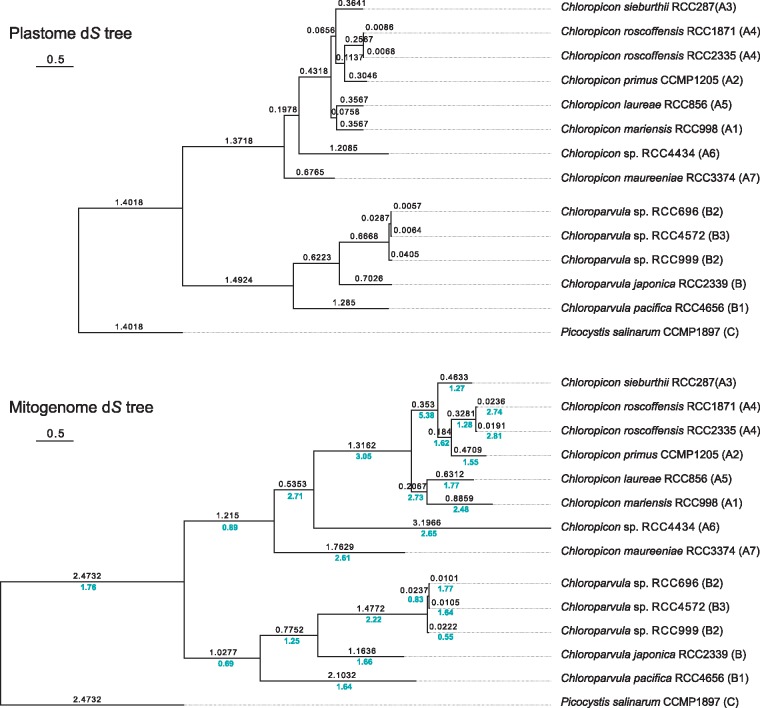
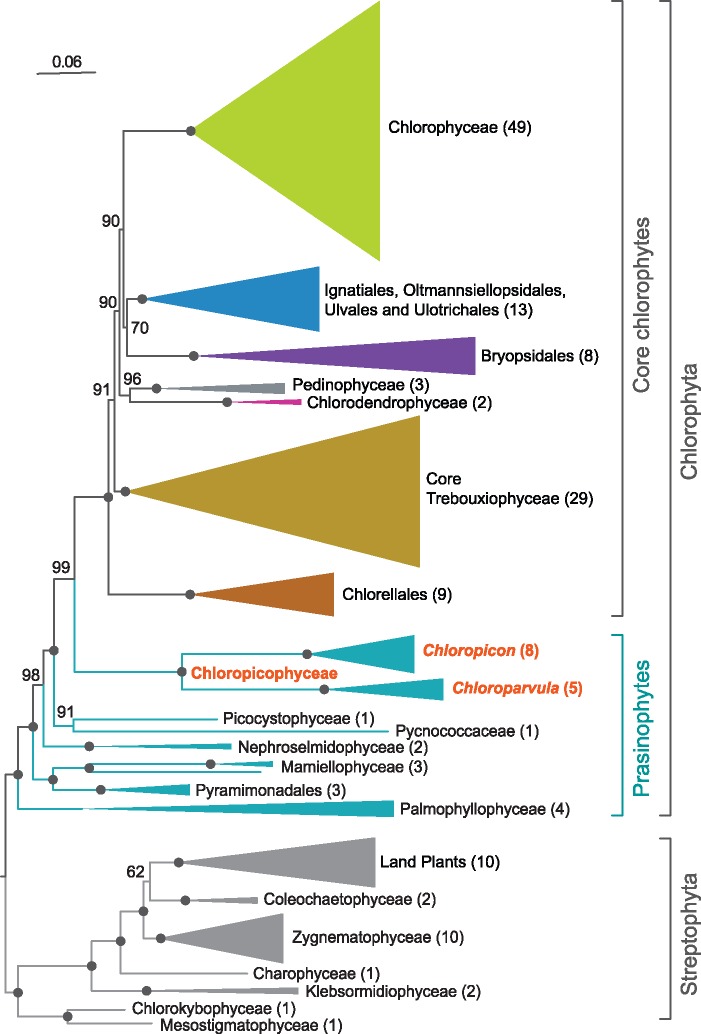
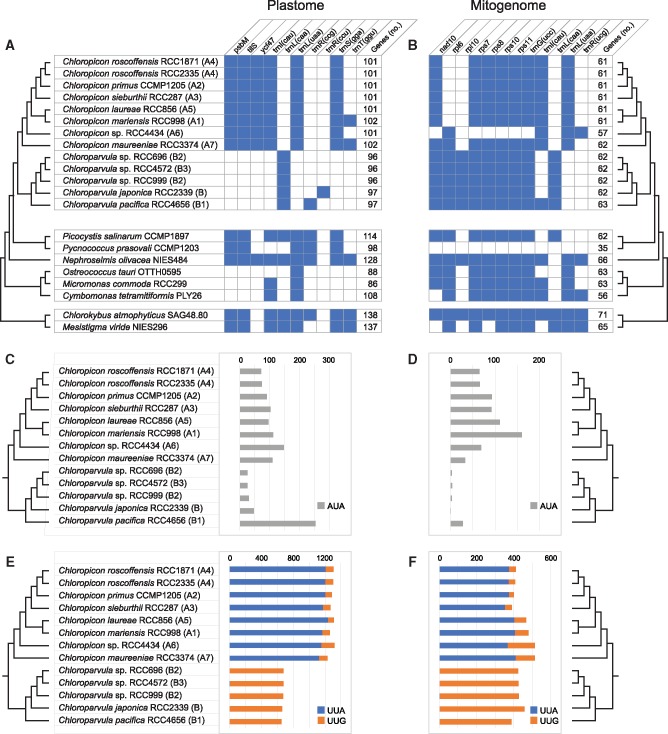
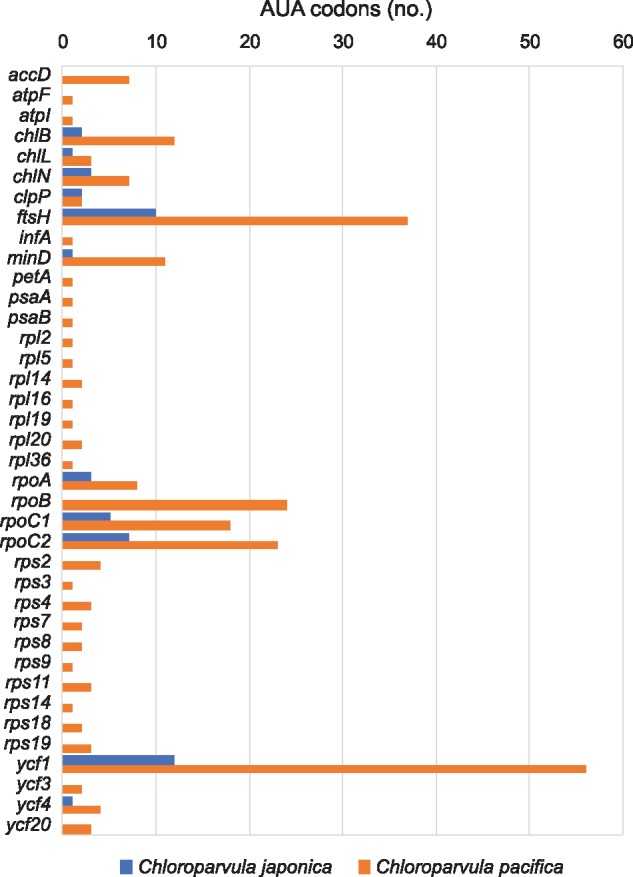
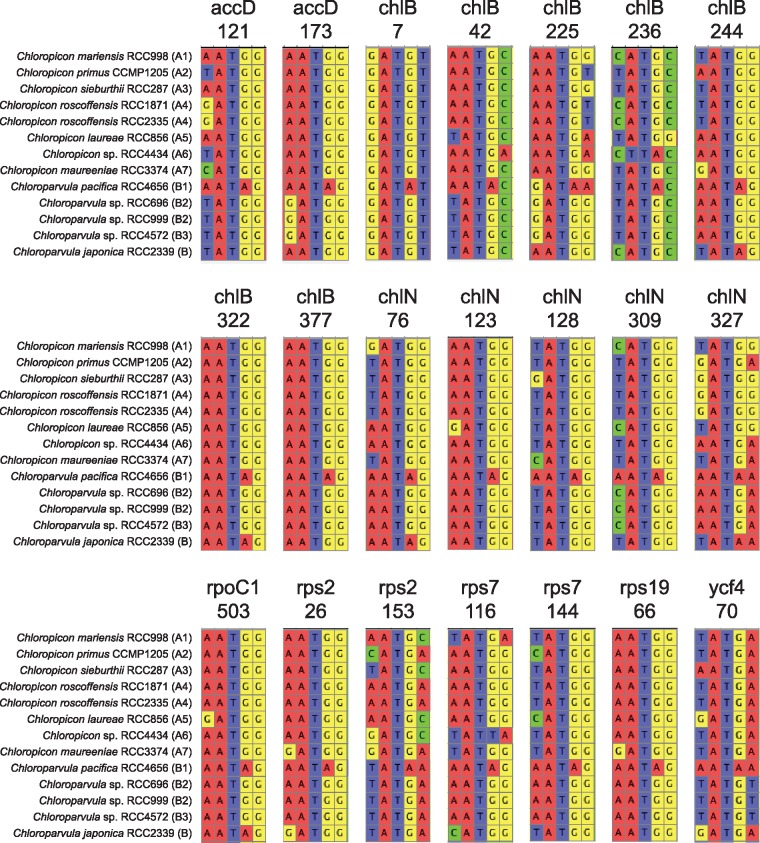
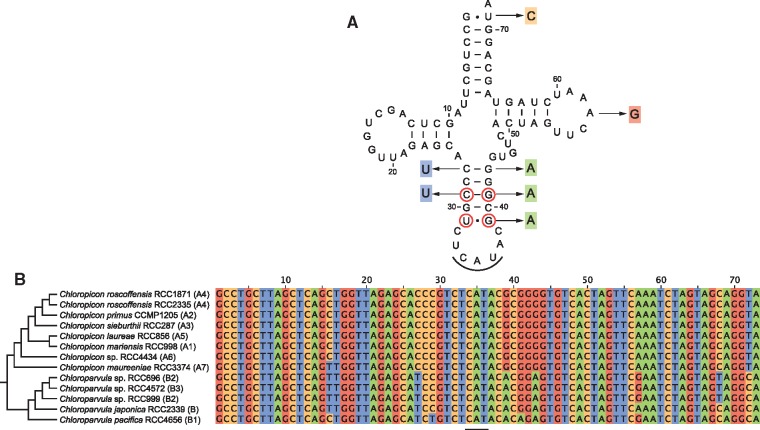
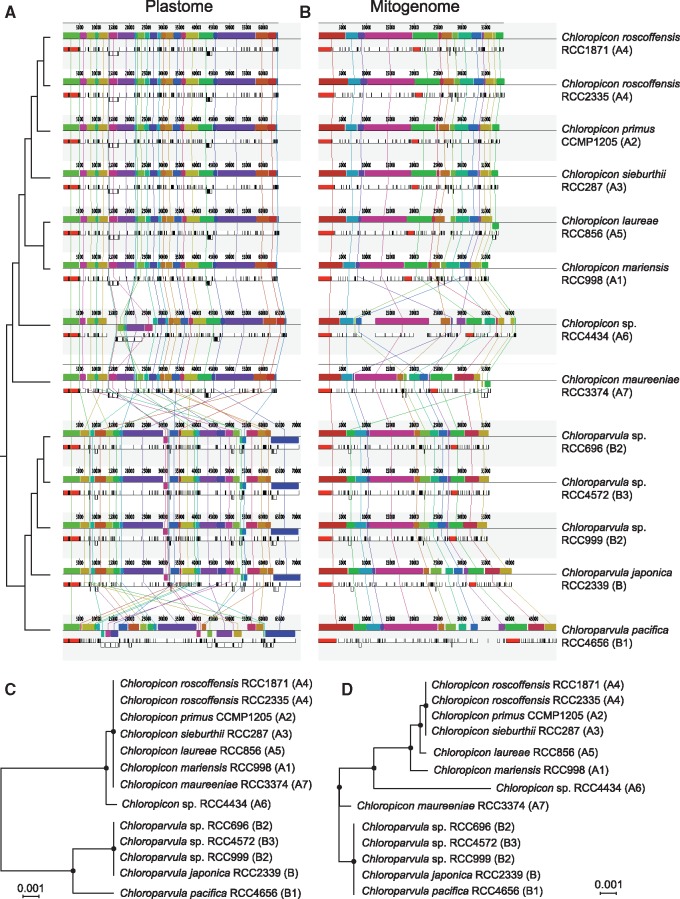
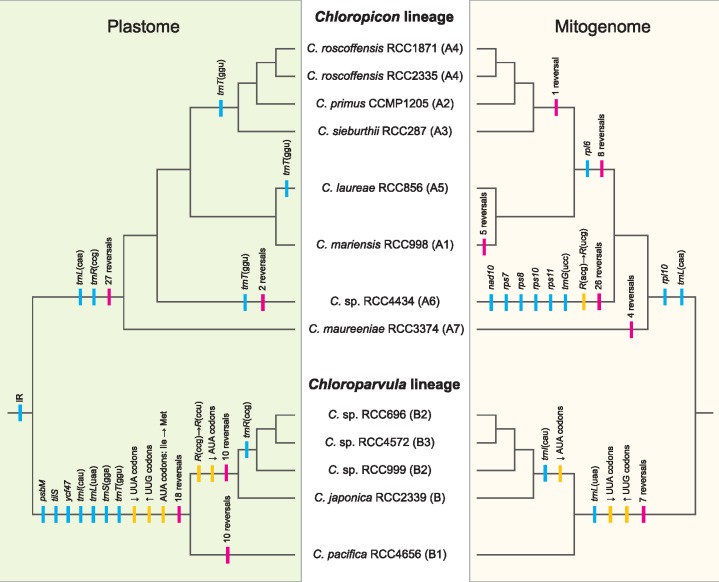
The tiny green algae belonging to the Chloropicophyceae play a key role in marine phytoplankton communities; this newly erected class of prasinophytes comprises two genera (Chloropicon and Chloroparvula) containing each several species. We sequenced the plastomes and mitogenomes of eight Chloropicon and five Chloroparvula species to better delineate the phylogenetic affinities of these taxa and to infer the suite of changes that their organelle genomes sustained during evolution. The relationships resolved in organelle-based phylogenomic trees were essentially congruent with previously reported rRNA trees, and similar evolutionary trends but distinct dynamics were identified for the plastome and mitogenome. Although the plastome sustained considerable changes in gene content and order at the time the two genera split, subsequently it remained stable and maintained a very small size. The mitogenome, however, was remodeled more gradually and showed more fluctuation in size, mainly as a result of expansions/contractions of intergenic regions. Remarkably, the plastome and mitogenome lost a common set of three tRNA genes, with the trnI(cau) and trnL(uaa) losses being accompanied with important variations in codon usage. Unexpectedly, despite the disappearance of trnI(cau) from the plastome in the Chloroparvula lineage, AUA codons (the codons recognized by this gene product) were detected in certain plastid genes. By comparing the sequences of plastid protein-coding genes from chloropicophycean and phylogenetically diverse chlorophyte algae with those of the corresponding predicted proteins, we discovered that the AUA codon was reassigned from isoleucine to methionine in Chloroparvula. This noncanonical genetic code has not previously been uncovered in plastids.

Keywords: Picocystis salinarum; AUA codon reassignment; chloroplast genome; mitochondrial genome; phylogenomic analyses; prasinophyte green algae.


Figures

<sc>Fig</sc>. 1.
Fig. 1.
—Organelle phylogenomic trees showing the relationships among chloropicophycean taxa. (A) Plastome-based phylogeny inferred from a data set of 102 genes (first and second positions of 71 protein-coding genes, 3 rRNA genes, and 28 tRNA genes). (B) Mitogenome-based phylogeny inferred from a data set of 64 genes (first and second positions of 36 protein-coding genes, 2 rRNA genes, and 26 tRNA genes). The trees shown here are the best-scoring ML trees that were inferred under the GTR + Γ4 model. Support values are reported on the nodes: from top to bottom are shown the bootstrap support (BS) values for the RAxML GTR + Γ4 analyses and the posterior probability (PP) values for the PhyloBayes CATGTR + Γ4 analyses. Black dots indicate that the corresponding branches received BS and PP values of 100%.
<sc>Fig</sc>. 2.
Fig. 2.
—Relative synonymous substitution rates in the organelle genomes of the Chloropicophyceae. Plastome and mitogenome trees based on synonymous substitutions were inferred from codon-aligned sequences of concatenated protein-coding genes using CODEML. In both trees, the number of estimated synonymous substitutions per site (dS value) is shown above each branch. In the mitogenome tree, the ratio of the mitogenome to plastome dS values is indicated in blue below each branch.
<sc>Fig</sc>. 3.
Fig. 3.
—Plastome-based phylogenomic tree showing the position of the Chloropicophyceae relative to other classes and major lineages of the Chlorophyta. This ML tree was inferred from a data set of 79 proteins from 167 green plants using IQ-Tree under the GTR+R4 model. BS values are reported on the nodes. The clades that received maximal support were collapsed and represented as triangles with sizes proportional to the number of taxa (indicated in parentheses). Black dots indicate that the corresponding branches received 100% BS.
<sc>Fig</sc>. 4.
Fig. 4.
—Changes in gene content and codon frequency among chloropicophycean plastomes and mitogenomes. (A, B) Distribution of variable genes and total number of genes. The distribution of these genes is also shown for other prasinophytes and two early-branching streptophyte algae. The presence of a gene is denoted by a blue box. All chloropicophycean plastomes share the following 95 genes: accD, atpA, B, E, F, H, I, chlB, L, N, clpP, ftsH, infA, minD, petA, B, D, G, L, psaA, B, C, J, psbA, B, C, D, E, F, H, I, J, K, L, N, T, Z, rbcL, rpl2, 5, 14, 16, 19, 20, 23, 32, 36, rpoA, B, C1, C2, rps2, 3, 4, 7, 8, 9, 11, 12, 14, 18, 19, rrf, rrl, rrs, tufA, ycf1, 3, 4, 12, 20, trnA(ugc), C(gca), D(guc), E(uuc), F(gaa), G(gcc), G(ucc), H(gug), I(gau), K(uuu), L(uag), Me(cau), Mf(cau), N(guu), P(ugg), Q(uug), R(acg), R(ucu), S(gcu), S(uga), T(ugu), V(uac), W(cca), Y(gua). All chloropicophycean mitogenomes share the following 53 genes: atp1, 4, 6, 8, 9, cob, cox1, 2, 3, mttB, nad1, 2, 3, 4, 4L, 5, 6, 7, 9, rpl5, 14, 16, rps2, 3, 4, 12, 13, 14, 19, rnl, rns, trnA(ugc), C(gca), D(guc), E(uuc), F(gaa), G(gcc), H(gug), I(gau), K(uuu), L(uag), Me(cau), Mf(cau), N(guu), P(ugg), Q(uug), R(acg), R(ucu), S(gcu), S(uga), V(uac), W(cca), Y(gua). Duplicated gene copies, including those observed for the Chloroparvula pacifica plastid trnP(ugg) and trnW(cca) genes, were counted once. (C, D) Changes in frequency of the AUA codon associated with the presence/absence of trnI(cau). (E, F) Changes in frequencies of the UUA and UUG codons associated with the presence/absence of trnL(uaa) and trnL(caa), respectively.
<sc>Fig</sc>. 5.
Fig. 5.
—Number of AUA codons in plastid genes of Chloroparvula japonica and Chloroparvula pacifica.
<sc>Fig</sc>. 6.
Fig. 6.
—Partial gene alignments including AUA codons from Chloroparvula plastomes. These codons fall within universally or almost universally conserved sites at the protein level and correspond to AUG codons in orthologous plastid genes of Chloropicon and other green algae. The 21 sites containing AUA codons are distributed among eight protein-coding genes; the number below the gene name indicates the position of the AUA codon in the Chloroparvula pacifica gene.
<sc>Fig</sc>. 7.
Fig. 7.
—Evolution of the plastid elongator tRNAMet(CAU) in the Chloropicophyceae. (A) Consensus secondary structure model of the Chloropicon elongator tRNAMet(CAU) showing the variant nucleotides observed in Chloroparvula pacifica. The circled nucleotides in the anticodon stem are conserved in chlorophyte tRNAsMet(CAU). (B) Alignment of trnMe(cau) gene sequences from all examined chloropicophycean taxa. The anticodon sequence is underlined.
<sc>Fig</sc>. 8.
Fig. 8.
—Extent of gene rearrangements in chloropicophycean plastomes and mitogenomes. (A, B) Analysis of gene order using Mauve 2.3.1. Locally collinear blocks of genome sequences are represented by boxes of identical color and similarly colored blocks are connected by lines. Blocks above the center line of the aligned regions are in the same orientation as in the reference (RCC1871) genome sequence, while those below this line are in the reverse orientation. (C, D) Phylogenetic relationships inferred from gene order data sets using the tree reconstruction option of MLGO. The plastome and mitogenome data sets included 95 and 53 genes, respectively. Consensus trees of 1000 bootstrap replicates are shown; black dots indicate that the corresponding branches received 100% BS.
<sc>Fig</sc>. 9.
Fig. 9.
—Predicted evolutionary scenarios for the plastome and mitogenome of the Chloropicophyceae. Gene losses and gene rearrangements are denoted by blue and red vertical lines, respectively. Mutations of tRNA anticodons, changes in codon frequencies, and reassignment of the AUA codon are indicated by yellow lines.

References

    1. Alkatib S, et al. 2012. The contributions of wobbling and superwobbling to the reading of the genetic code. PLoS Genet. 811:e1003076.. - PMC - PubMed
    1. Bankevich A, et al. 2012. SPAdes: a new genome assembly algorithm and its applications to single-cell sequencing. J Comput Biol. 195:455–477. - PMC - PubMed
    1. Blanc-Mathieu R, Sanchez-Ferandin S, Eyre-Walker A, Piganeau G.. 2013. Organellar inheritance in the green lineage: insights from Ostreococcus tauri. Genome Biol Evol. 58:1503–1511. - PMC - PubMed
    1. Bourque G, Pevzner PA.. 2002. Genome-scale evolution: reconstructing gene orders in the ancestral species. Genome Res. 121:26–36. - PMC - PubMed
    1. Cahoon AB, Nauss JA, Stanley CD, Qureshi A.. 2017. Deep transcriptome sequencing of two green algae, Chara vulgaris and Chlamydomonas reinhardtii, provides no evidence of organellar RNA editing. Genes 8:80.

Publication types

Cite

AltStyle によって変換されたページ (->オリジナル) /