This site needs JavaScript to work properly. Please enable it to take advantage of the complete set of features!
Skip to main page content
U.S. flag

An official website of the United States government

Dot gov

The .gov means it’s official.
Federal government websites often end in .gov or .mil. Before sharing sensitive information, make sure you’re on a federal government site.

Https

The site is secure.
The https:// ensures that you are connecting to the official website and that any information you provide is encrypted and transmitted securely.

NIH NLM Logo
Log in
Access keys NCBI Homepage MyNCBI Homepage Main Content Main Navigation
. 2019 Aug;13(8):1899-1910.
doi: 10.1038/s41396-019-0377-0. Epub 2019 Feb 26.

Taming chlorophylls by early eukaryotes underpinned algal interactions and the diversification of the eukaryotes on the oxygenated Earth

Yuichiro Kashiyama 1 2 3 4 , Akiko Yokoyama 5 6 , Takashi Shiratori 5 7 , Sebastian Hess 8 , Fabrice Not 9 , Charles Bachy 9 , Andres Gutierrez-Rodriguez 9 10 , Jun Kawahara 11 , Toshinobu Suzaki 12 , Masami Nakazawa 13 , Takahiro Ishikawa 14 , Moe Maruyama 11 , Mengyun Wang 15 , Man Chen 15 , Yingchun Gong 15 , Kensuke Seto 16 17 , Maiko Kagami 16 17 , Yoko Hamamoto 18 19 , Daiske Honda 19 20 , Takahiro Umetani 21 , Akira Shihongi 11 , Motoki Kayama 11 , Toshiki Matsuda 11 , Junya Taira 21 , Akinori Yabuki 7 , Masashi Tsuchiya 7 , Yoshihisa Hirakawa 5 , Akane Kawaguchi 22 , Mami Nomura 22 23 , Atsushi Nakamura 22 , Noriaki Namba 22 , Mitsufumi Matsumoto 24 , Tsuyoshi Tanaka 25 , Tomoko Yoshino 25 , Rina Higuchi 12 , Akihiro Yamamoto 21 , Tadanobu Maruyama 11 , Aika Yamaguchi 26 , Akihiro Uzuka 27 , Shinya Miyagishima 27 , Goro Tanifuji 28 , Masanobu Kawachi 29 , Yusuke Kinoshita 30 , Hitoshi Tamiaki 30
Affiliations

Taming chlorophylls by early eukaryotes underpinned algal interactions and the diversification of the eukaryotes on the oxygenated Earth

Yuichiro Kashiyama et al. ISME J. 2019 Aug.

Abstract

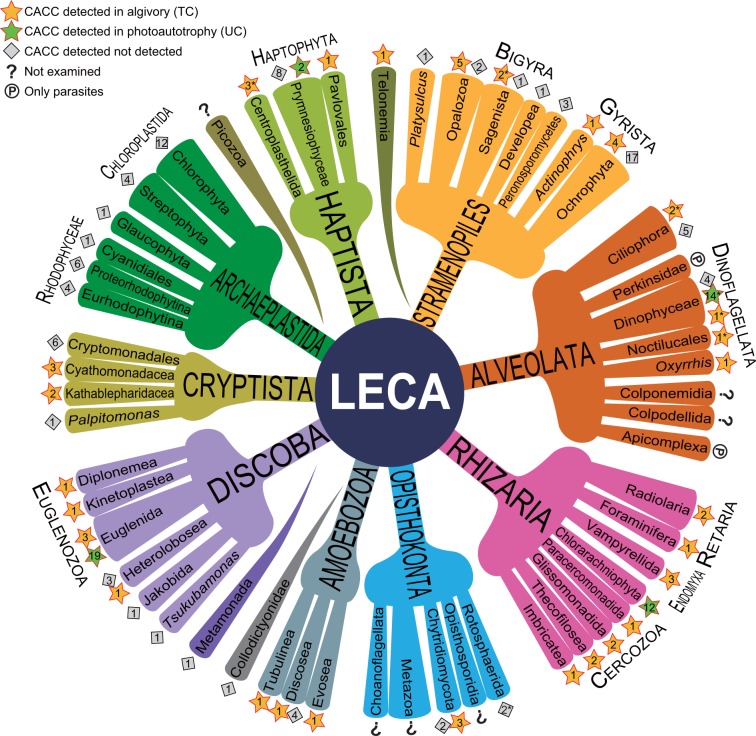
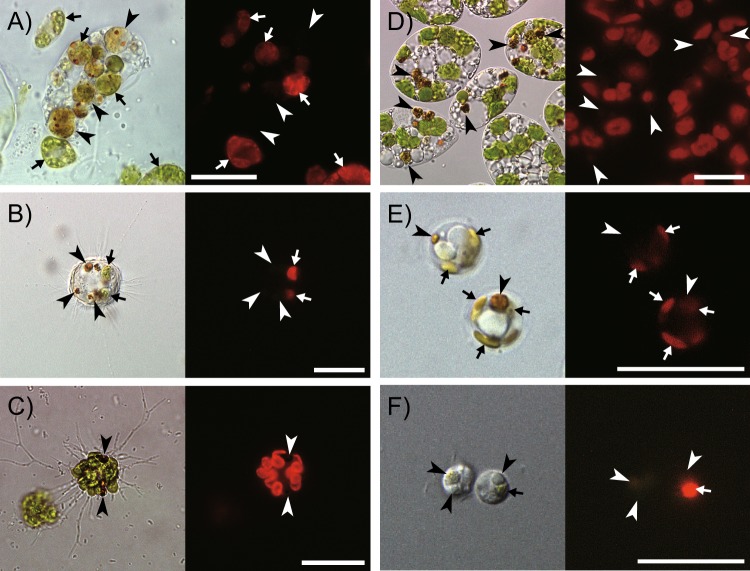
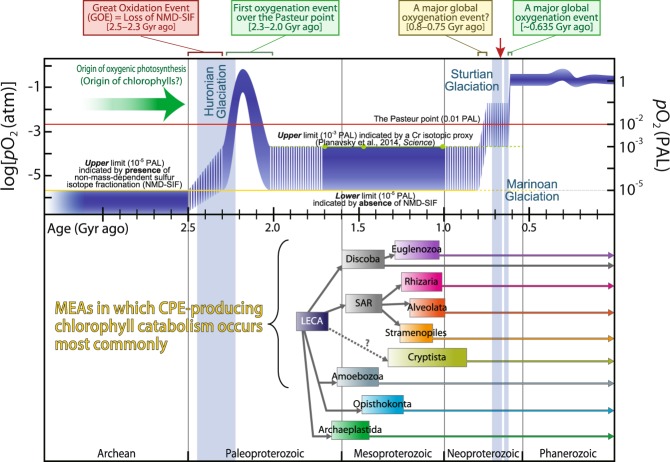
Extant eukaryote ecology is primarily sustained by oxygenic photosynthesis, in which chlorophylls play essential roles. The exceptional photosensitivity of chlorophylls allows them to harvest solar energy for photosynthesis, but on the other hand, they also generate cytotoxic reactive oxygen species. A risk of such phototoxicity of the chlorophyll must become particularly prominent upon dynamic cellular interactions that potentially disrupt the mechanisms that are designed to quench photoexcited chlorophylls in the phototrophic cells. Extensive examination of a wide variety of phagotrophic, parasitic, and phototrophic microeukaryotes demonstrates that a catabolic process that converts chlorophylls into nonphotosensitive 132,173-cyclopheophorbide enols (CPEs) is phylogenetically ubiquitous among extant eukaryotes. The accumulation of CPEs is identified in phagotrophic algivores belonging to virtually all major eukaryotic assemblages with the exception of Archaeplastida, in which no algivorous species have been reported. In addition, accumulation of CPEs is revealed to be common among phototrophic microeukaryotes (i.e., microalgae) along with dismantling of their secondary chloroplasts. Thus, we infer that CPE-accumulating chlorophyll catabolism (CACC) primarily evolved among algivorous microeukaryotes to detoxify chlorophylls in an early stage of their evolution. Subsequently, it also underpinned photosynthetic endosymbiosis by securing close interactions with photosynthetic machinery containing abundant chlorophylls, which led to the acquisition of secondary chloroplasts. Our results strongly suggest that CACC, which allowed the consumption of oxygenic primary producers, ultimately permitted the successful radiation of the eukaryotes throughout and after the late Proterozoic global oxygenation.


Conflict of interest statement

The authors declare that they have no conflict of interest.

Figures

Fig. 1
Fig. 1
Scheme of eukaryote evolution and classification showing major eukaryotic assemblages (MEAs) displaying CPE-accumulating chlorophyll catabolism. Stars indicate accumulation of CPEs detected: yellow stars, data from two-membered co-cultures (algivory); green stars, data from unialgal cultures (chloroplast dismantling). Diamonds indicate no accumulation of CPE detected. Number in each star or diamond denotes the total number of species examined in the present study and/or previously reported (listed in Supplementary Table S2). Numbers with asterisks are data from previous reports [, –14]. Among the nine MEAs, Archaeplastida examined in the present study consists exclusively of phototrophs, whereas Amoebozoa and Opisthokonta consist exclusively of heterotrophs. Each of the other six supergroups includes both phototrophs and algivores; thus, we examined both phototrophic and algivorous cultures across all the six MEAs
Fig. 2
Fig. 2
Identification and quantitative illustration of CPEs and other chlorophyll derivatives. Left: Three-dimensional (3D) HPLC chromatograms of extracts of a an aged unialgal culture of a euglenophyte (Eutreptiella sp. CCMP389); and b a two-membered co-culture of a algivorous stramenopile (Actinophris sol) fed a dietary green alga (Chlorogonium capillatum); c HPLC online visible absorption spectra of major chlorophylls and their derivatives; d 3D HPLC chromatogram of an extract of C. capillatum only (an unialgal culture). Right: e Donut charts showing the relative abundances of the derivatives of chlorophyll a (Chl-a) in representative cultures in which CPEs were detected. These included 132,173-cyclopheophorbide a enol (cPPB-aE) and other miscellaneous derivatives: (132R/S)-hydroxychlorophyllone a (hCPL-a), other cPPB-aE derivatives (pyropheophytin a and compound-X_a; Supplementary Fig. S1), pheophytin a (Phe-a), Mg-chelated derivatives of Chl-a (Chl-a allomers and chlorophyllide a), and free-base derivatives of Chl-a (pheophorbide a and pyropheophorbide a). Species names in parentheses indicate the dietary algae in two-membered co-cultures. Numerals in each doughnut chart indicate the ratio of the plotted derivative to the total Chl-a derivatives (the plotted derivatives plus intact Chl-a) in each analysis as a percentage. Therefore, 100 indicates the complete alteration of the originally produced Chl-a
Fig. 3
Fig. 3
Microscopic documentation of the degradation of chloroplasts. Differential interference (left) and fluorescent images (excitation: 400–440 nm) (right). a Cell of heterotrophic euglenid Peranema trichophorum (center) containing phagosomes of variable color, which is surrounded by live cells of the green alga Chlorogonium capillatum (arrows). Among the ingesta, the autofluorescence intensity differs more than the color, indicating the progress of chlorophyll catabolism together with chloroplast digestion (arrowheads); b cell of the heterotrophic heliozoan (Haptista) Choanocystis sp. that had ingested C. capillatum, demonstrating that chlorophyll autofluorescence gradually disappeared in an early stage of digestion (arrowheads); c cells of Euglena gracilis in an aged culture, showing the formation of brown granules after chloroplast dismantling, where the loss of chlorophyll autofluorescence was observed in the earliest stage. Cells of d the chlorarachniophyte Chlorarachnion reptans; and e the haptophyte Calyptrosphaera sphaeroidea, respectively, both showing the formation of nonfluorescent reddish-brown granules (arrowheads); f cells of Palpitomonas bilix that had ingested a pedinophycean green alga, demonstrating that the pigmentation of the dietary alga was also lost within the phagosome (arrow: in the earliest stage of digestion; arrowheads: in the later stages), in contrast to the CPE-producing algivores
Fig. 4
Fig. 4
Comparative reconstruction of the temporal evolution of atmospheric pO2 and estimated age of emergences of major eukaryotic assemblages (MEAs). In the upper diagram, the blue band shows the estimated range of Earth’s atmospheric oxygen content for the last three billion years (Gyr), modified from Lyons et al. [2]. The yellow and green lines delineate the upper and lower limits, respectively, of the estimated range based on geochemical proxies [3]. Red arrow on the top indicates the time point (0.80–0.64 Gyr ago) when pO2 exceeded the Pasteur point (the presumed level of oxygen required for mitochondrial respiration). In the lower diagram, the estimated divergence times (95% highest probability density) of selected MEAs and the estimated age of LECA are shown, according to Parfrey et al. [37]. This illustrates a conspicuous discrepancy between the timing of the final oxygenation of the atmosphere and the appearance of extant eukaryotic lineages with notable affinity for molecular oxygen. PAL present atmospheric level, MEAs major eukaryotic assemblages, LECA last eukaryotic common ancestor, SAR the supergroup Stramenopiles–Alveolata–Rhizaria

References

    1. Sahoo SK, Planavsky NJ, Kendall B, Wang X, Shi X, Scott C, et al. Ocean oxygenation in the wake of the Marinoan glaciation. Nature. 2012;489:546–9. doi: 10.1038/nature11445. - DOI - PubMed
    1. Lyons TW, Reinhard CT, Planavsky NJ. The rise of oxygen in Earth’s early ocean and atmosphere. Nature. 2014;506:307–15. doi: 10.1038/nature13068. - DOI - PubMed
    1. Planavsky NJ, Reinhard CT, Wang X, Thomson D, McGoldrick P, Rainbird RH, et al. Low mid-proterozoic atmospheric oxygen levels and the delayed rise of animals. Science. 2014;346:635–8. doi: 10.1126/science.1258410. - DOI - PubMed
    1. Gray MW. Mitochondrial evolution. Cold Spring Harb Perspect Biol. 2012;4:a011403. doi: 10.1101/cshperspect.a011403. - DOI - PMC - PubMed
    1. Karnkowska A, Vacek V, Zubáčová Z, Treitli SC, Petrželková R, Eme L, et al. A eukaryote without a mitochondrial organelle. Curr Biol. 2016;26:1–11. doi: 10.1016/j.cub.2016年03月05日3. - DOI - PubMed

Publication types

Cite

AltStyle によって変換されたページ (->オリジナル) /