This site needs JavaScript to work properly. Please enable it to take advantage of the complete set of features!
Skip to main page content
U.S. flag

An official website of the United States government

Dot gov

The .gov means it’s official.
Federal government websites often end in .gov or .mil. Before sharing sensitive information, make sure you’re on a federal government site.

Https

The site is secure.
The https:// ensures that you are connecting to the official website and that any information you provide is encrypted and transmitted securely.

NIH NLM Logo
Log in
Access keys NCBI Homepage MyNCBI Homepage Main Content Main Navigation
. 2011 Aug;1(3):171-82.
doi: 10.1534/g3.111.000240. Epub 2011 Aug 1.

Stacks: building and genotyping Loci de novo from short-read sequences

Stacks: building and genotyping Loci de novo from short-read sequences

Julian M Catchen et al. G3 (Bethesda). 2011 Aug.

Abstract

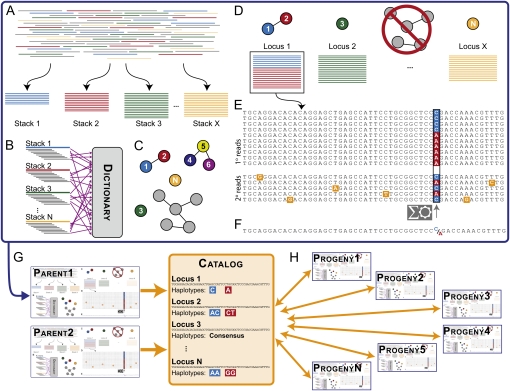
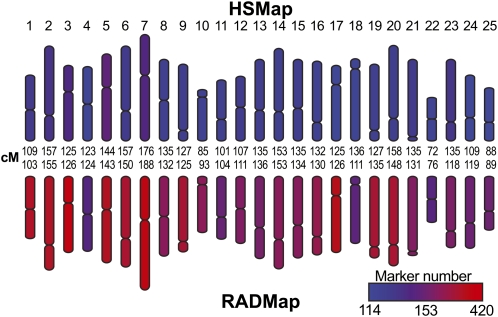
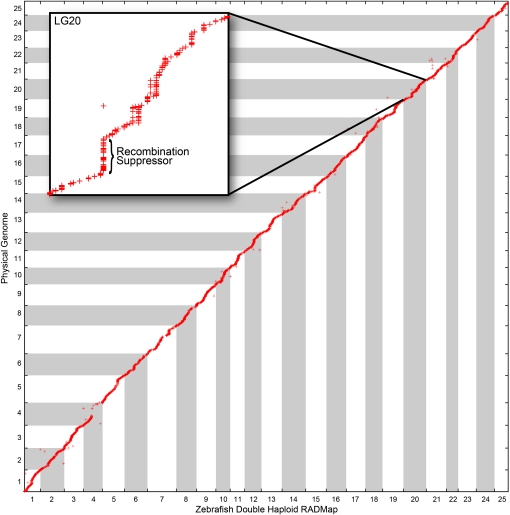
Advances in sequencing technology provide special opportunities for genotyping individuals with speed and thrift, but the lack of software to automate the calling of tens of thousands of genotypes over hundreds of individuals has hindered progress. Stacks is a software system that uses short-read sequence data to identify and genotype loci in a set of individuals either de novo or by comparison to a reference genome. From reduced representation Illumina sequence data, such as RAD-tags, Stacks can recover thousands of single nucleotide polymorphism (SNP) markers useful for the genetic analysis of crosses or populations. Stacks can generate markers for ultra-dense genetic linkage maps, facilitate the examination of population phylogeography, and help in reference genome assembly. We report here the algorithms implemented in Stacks and demonstrate their efficacy by constructing loci from simulated RAD-tags taken from the stickleback reference genome and by recapitulating and improving a genetic map of the zebrafish, Danio rerio.

Keywords: Illumina; RAD-seq; RAD-tag; meiotic linkage map; zebrafish.


Figures

Figure 1
Figure 1
Stacks schematic. (A) The ustacks program forms stacks in an individual from short sequencing reads (cleaned by process_radtags.pl) that match exactly. (B) The ustacks program breaks down the sequence of each stack into k-mers and loads them into a dictionary. The ustacks program breaks down each stack again into k-mers and queries the k-mer Dictionary to create a list of potentially matching stacks, which can be visualized as nodes in a graph connected by the nucleotide distance between them. (C) ustacks merges matched stacks to form putative loci. (D) ustacks matches secondary reads that were not initially placed in a stack against putative loci to increase stack depth. An SNP model in ustacks checks each locus at each nucleotide position for polymorphisms. (E) ustacks calls a consensus sequence and records SNP and haplotype data. (F) The cstacks program loads stacks from the parents of a genetic cross into a Catalog to create a set of all possible loci in a mapping cross. (G) sstacks matches map cross progeny against the Catalog to determine the haplotypes at each locus in every individual in the cross.
Figure 2
Figure 2
Stacks web interface. (A) The interface allows a researcher to view observed haplotypes at each locus in all individuals. (B) Researchers can click each haplotype to view the stack itself. The interface provides extensive filtering facilities as well as the ability to annotate and export results in a number of formats, including Excel, JoinMap, and R/qtl.
Figure 3
Figure 3
Stacks simulation results. The stickleback reference genome was digested in silico by SbfI, and 60 bp reads were made from each direction from the 22,774 cut sites at several different sequencing depths with several different error rates. The left panel shows the number of (A) loci, (B) stacks, and (C) SNPs observed in the Stacks output. Loci that Stacks assembled incorrectly are displayed in a dark color, whereas loci containing repetitive sequences are shown in a crosshatch pattern. A comparison of the number of loci present in the dataset (A) vs. the number of stacks reconstructed (B) showed that ustacks collapsed repetitive loci but correctly reconstructed nearly all other loci at low and moderate error rates or at high coverage. The right panel shows the number of reads with a certain number of sequencing errors that were incorporated into correct stacks, incorrect stacks, and unused reads for ×ばつ coverage and error rates of (D) 0.5%, (E) 1%, and (F) 3%. As errors accumulated, Stacks excluded more reads, lowering the overall depth, whereas some reads accumulated enough errors to be incorporated into stacks that appeared to be correctly assembled but, in fact, joined stacks representing loci from which they did not originate (indicated by reads with more errors than allowed by the k-mer matching algorithm, four errors in the simulation).
Figure 4
Figure 4
Stacks depth of coverage distribution. (A) Correctly reconstructed stacks have a depth of coverage equal to twice the mean sequencing coverage because the simulation assumes diploid individuals. With no polymorphism or error (gray line), the depth of coverage distribution nearly matched the known simulation distribution (dotted red line), with the exception of repetitive loci, which created the long tail of the distribution to the right, which was truncated at ×ばつ but extends to ×ばつ. After adding SNPs, ustacks failed to reconstruct a small number of loci (green arrow) as shown by the increase in stacks with a depth of coverage equal to the sequencing mean depth. (B–C) With the addition of sequencing error and increasing mean sequencing depth, most stacks were still properly reconstructed. Results showed a repeating pattern of improperly reconstructed stacks occurring at multiples of the mean sequencing depth corresponding to the number of loci improperly merged together. The increasing error rate caused a general loss of depth in the stacks (green vs. violet lines).
Figure 5
Figure 5
Danio rerio RAD-tag map compared to the doubled haploid map. We constructed a RAD-seq genetic map of zebrafish (RADmap) using DNA from 42 individuals of the doubled haploid mapping panel (HSmap) that had been previously genotyped by microsatellites or single strand conformation polymorphism (Kelly et al. 2000; Woods et al. 2000; Woods et al. 2005). Stacks recovered the 25 zebrafish linkage groups (Figure S2) with lengths nearly identical to published values (3186 cM in the HSmap vs. 3160 cM in the RADmap). With 7861 markers, our RADmap had nearly twice as many markers as appeared in the HSmap (4073 markers). The insert shows the scale for marker density.
Figure 6
Figure 6
RADmap marker order is consistent with the sequenced zebrafish genome. A specific region on LG20 with no recombination in the RADmap spanned almost 10 Mb in the physical genome (inset). This recombination suppression could be due to a heterozygous inversion present in the genome of the mother of the gynogenetic HS mapping panel.

References

    1. Allendorf F. W., Danzmann R. G., 1997. Secondary tetrasomic segregation of MDH-B and preferential pairing of homeologues in rainbow trout. Genetics 145: 1083–1092 - PMC - PubMed
    1. Altschul S. F., Madden T. L., Schaffer A. A., Zhang J., Zhang Z., et al. , 1997. Gapped BLAST and PSI-BLAST: a new generation of protein database search programs. Nucleic Acids Res. 25: 3389–3402 - PMC - PubMed
    1. Amores A., Force A., Yan Y. L., Joly L., Amemiya C., et al. , 1998. Zebrafish hox clusters and vertebrate genome evolution. Science 282: 1711–1714 - PubMed
    1. Amores A., Catchen J. M., Ferrara A., Fontenot Q., Postlethwait J. H., 2011. Genome evolution and meiotic maps by massively parallel DNA sequencing: spotted gar, an outgroup for the teleost genome duplication. Genetics 188: 799–808 - PMC - PubMed
    1. Arias J., Keehan M., Fisher P., Coppieters W., Spelman R., 2009. A high density linkage map of the bovine genome. BMC Genet. 10(1): 18. - PMC - PubMed

LinkOut - more resources

Cite

AltStyle によって変換されたページ (->オリジナル) /