This site needs JavaScript to work properly. Please enable it to take advantage of the complete set of features!
Skip to main page content
U.S. flag

An official website of the United States government

Dot gov

The .gov means it’s official.
Federal government websites often end in .gov or .mil. Before sharing sensitive information, make sure you’re on a federal government site.

Https

The site is secure.
The https:// ensures that you are connecting to the official website and that any information you provide is encrypted and transmitted securely.

NIH NLM Logo
Log in
Access keys NCBI Homepage MyNCBI Homepage Main Content Main Navigation
. 2007 Jul;27(1):135-44.
doi: 10.1016/j.immuni.2007年05月02日2. Epub 2007 Jul 19.

Toll-like receptor 4 is a sensor for autophagy associated with innate immunity

Affiliations

Toll-like receptor 4 is a sensor for autophagy associated with innate immunity

Yi Xu et al. Immunity. 2007 Jul.

Abstract

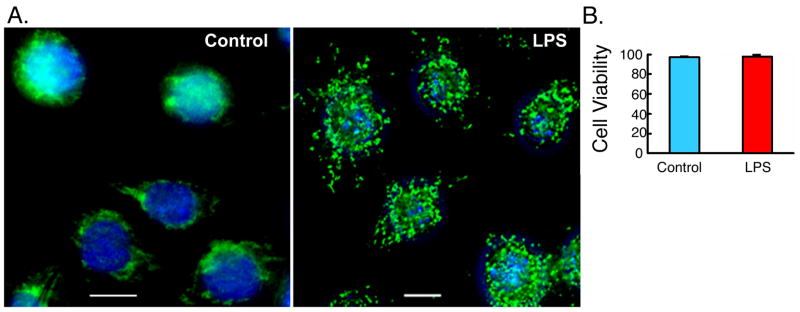
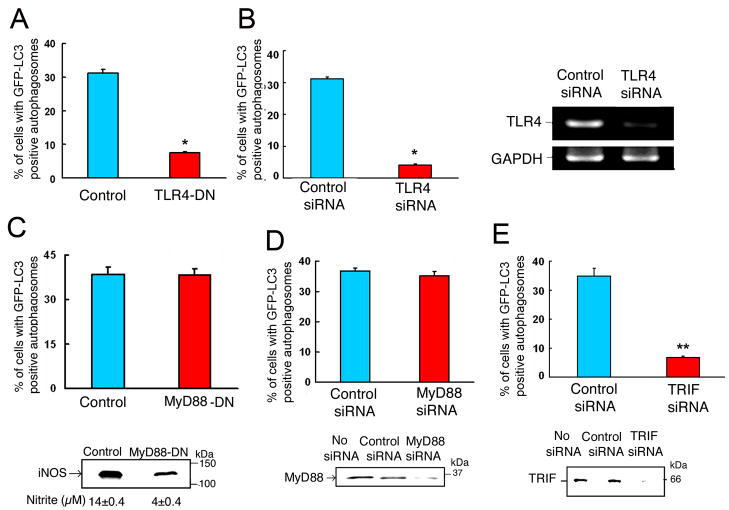
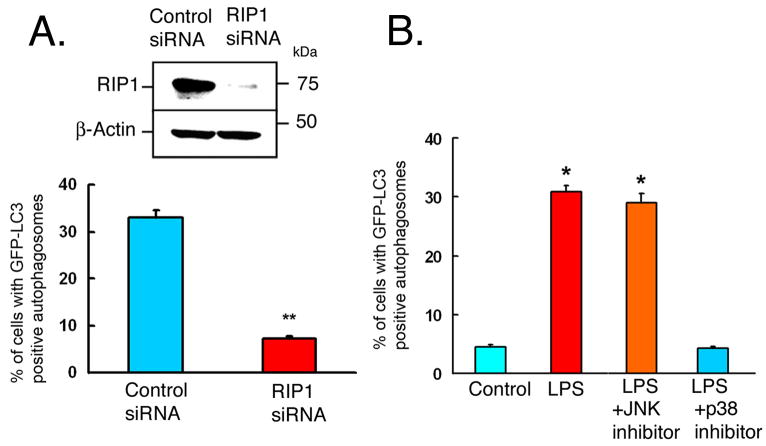
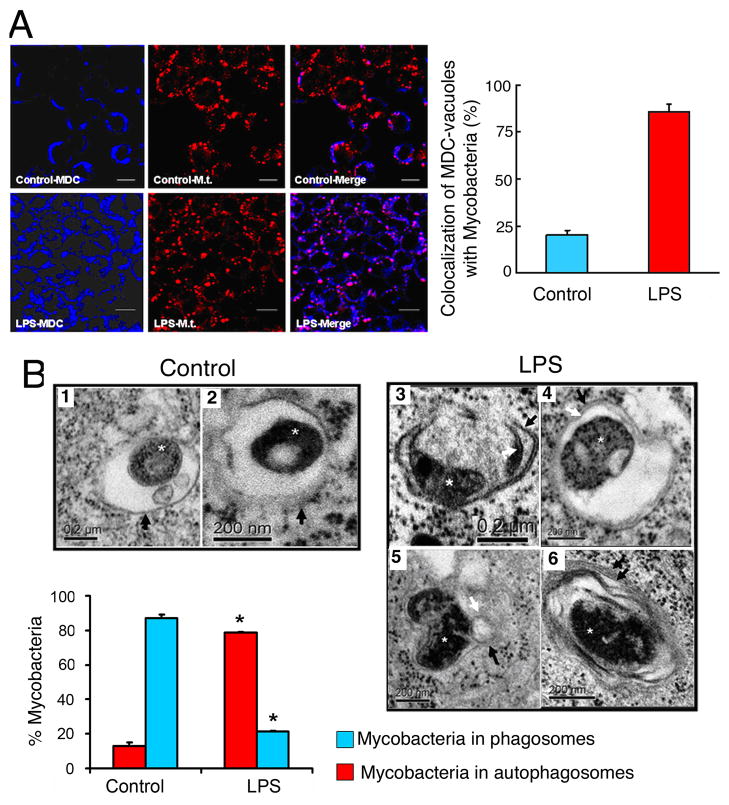
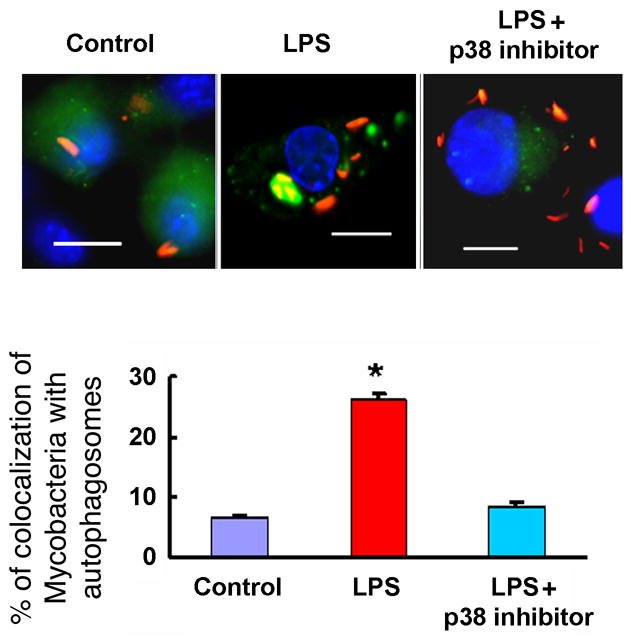
Autophagy has recently been shown to be an important component of the innate immune response. The signaling pathways leading to activation of autophagy in innate immunity are not known. Here we showed that Toll-like receptor 4 (TLR4) served as a previously unrecognized environmental sensor for autophagy. Autophagy was induced by lipopolysaccharide (LPS) in primary human macrophages and in the murine macrophage RAW264.7 cell line. We defined a new molecular pathway in which LPS-induced autophagy was regulated through a Toll-interleukin-1 receptor domain-containing adaptor-inducing interferon-beta (TRIF)-dependent, myeloid differentiation factor 88 (MyD88)-independent TLR4 signaling pathway. Receptor-interacting protein (RIP1) and p38 mitogen-activated protein kinase were downstream components of this pathway. This signaling pathway did not affect cell viability, indicating that it is distinct from the autophagic death signaling pathway. We further showed that LPS-induced autophagy could enhance mycobacterial colocalization with the autophagosomes. This study links two ancient processes, autophagy and innate immunity, together through a shared signaling pathway.


Figures

Figure 1
Figure 1. LPS induces formation of autophagosomes
(A) RAW264.7 cells were incubated in the absence or presence of LPS for 16 h, fixed, stained with DAPI to visualize the nuclei (blue), and immunolabled with anti- LC3 antibody followed by Alexa Fluor 488-conjugated goat anti-rabbit IgG (green). Representative images are shown. (B) Cell viability analysis of RAW264.7 cells, stably expressing LC3-GFP, following incubation in the presence or absence of LPS (100 ng/ml) for 16 h. Cell viability was determined using Cell Viability Analyzer (Vi-Cell, BECKMAN COULTER) based on trypan blue reagent (Mean±SEM, n=4).
Figure 2
Figure 2. Induction of autophagy in primary human alveolar macrophages and murine macrophages RAW264.7 cells by LPS Stimulation
Cells were incubated the in the absence (control cells) or presence of LPS (100 ng/ml) or in the presence of LPS plus PMB (25 μg/ml) for 16 h. (A) Upper panel- Representative immunofluorescence images with LC3 antibody staining in RAW264.7 cells. Middle panel- Quantitation of the percentage of cells with autophagosomes. Lower panel- Western analysis using antibodies against LC3 or β-actin. (B) GFP-LC3 fluorescence images and quantitation analyses are shown in upper and middle panels, respectively. Lower panel- Western analysis with anti-iNOS antibody. Activity of iNOS was evaluated by measuring nitrite accumulation in culture media. (C) Upper panel- Representative immunofluorescence images of LC3 antibody staining in primary human alveolar macrophages. Lower panel-Quantitation of the percentage of cells with autophagosomes. (D) Ultrastructural analysis of LPS-induced autophagy by transmission electron microscopy in RAW264.7 cells. av, autophagic vacuole; n, nucleus; m, mitochondria. Graph represents quantitation of the number of autophagosomes per cross-sectioned cell. Data are mean±SEM from three (A-B) or two (C-D) independent experiments. Scale bar, 10 μm. * and ** denote p < 0.05 and p < 0.001, respectively, when compared to control condition.
Figure 3
Figure 3. TRIF-dependent TLR-4 signaling is required for LPS-induced autophagy
Quantitation analysis of the percentage of cells with GFP-LC3-positive autophagosomes in RAW264.7 cells, stably expressing GFP-LC3, after incubation in the presence of LPS (100 ng/ml) for 16 h. In (A), cells were transfected with vector only or with a plasmid expressing TLR4-dominant negative mutant. In (B, D and E), cells were transfected with control siRNA or siRNA specific for TLR4, MyD88 or TRIF, respectively. All transfections were done for 32 h, prior to LPS treatment. In (C), cells stably expressed both GFP-LC3 and MyD88 dominant negative mutant. Right panel in (B)- results of RT-PCR confirming deletion of TLR4 by siRNA. Lower panel in (C)- evaluation of iNOS protein expression by Western analysis and iNOS activity by measuring nitrite in culture media. Lower panel in (D)- Western analysis of MyD88 in cell lysates. Lower panel in (E)- Western analysis of TRIF in cell lysates. Data represent means±SEM of three independent experiments. * and ** denote p < 0.05 and p < 0.001, respectively, when compared to control condition.
Figure 4
Figure 4. IP1 and p38 MAPK are required for LPS-induced autophagy
(A) RAW264.7 cells, stably expressing GFP-LC3, were transfected with control siRNA or siRNA specific for RIP1 for 32 h, followed by LPS treatment (100 ng/ml) for 16 h. Upper panel- Western analysis of cell lysates with antibodies against RIP1 or β-actin. Lower panel- Quantitation analysis of the percentage of cells with GFP-LC3-positive autophagosomes. (B) RAW264.7 cells, stably expressing GFP-LC3, were incubated for 16 h in the absence (Control) or in the presence of LPS+vehicle (DMSO), LPS+JNK inhibitor (20 μM), or LPS+p38 inhibitor (20 μM). Quantitation of percentage of cells with GFP-LC3 positive autophagosomes is shown. Data in A-B represent means±SEM of three independent experiments. * and ** denote p < 0.05 and p < 0.001, respectively, compared to control.
Figure 5
Figure 5. Inhibition of PI3-kinase class III activity blocks LPS-induced autophagy
(A) RAW264.7 cells were incubated for 16 h in the absence (control), or presence of LPS, LPS plus 3MA (5 mM) or LPS plus Wortmannin (Wm, 100 nM). (B) RAW264.7 cells stably expressing GFP-LC3 were subjected to the same conditions as in (A). Cells were fixed, stained with DAPI to visualize the nuclei (blue). (C) RAW264.7 cells stably expressing a dominant negative (DN) mutant of VPS34 were incubated with LPS for 16 h in parallel with RAW264.7 cells incubated with or without LPS. Autophagic vacuoles were stained in fixed cells using MDC (blue). Deconvolution microscopy images are shown. Scale bar, 10 μm. Graphs represent quantitation analysis of the number of MDC-positive autophagosomes per cell (A and C) or the percentage of cells with GFP-LC3-positive autophagosomes (B). Data represent mean ±SEM of three independent experiments. * and ** denote p< 0.05 and p< 0.001, respectively, when compared to control condition.
Figure 6
Figure 6. LPS-induced autophagy promotes the co-localization of mycobacterial phagosomes with the autophagosomes
(A) RAW264.7 cells were infected with PKH-26-stained Mycobacterium tuberculosis H37Rv (Mt, red) for 1 hr. Following phagocytosis, cells were incubated in the presence or absence of LPS for 16 hr. Cells were fixed and autophagic vacuoles were stained using Monodansylcadaverine (MDC, blue). The colocalization of Mt and the MDC-positive autophagosomes is represented in the merge panels by the pink color and quantitated in the graph in the lower panel (mean±SEM, n=2). (B) Ultrastructural analysis of Mycobacterium tuberculosis localization by transmission electron microscopy using RAW264.7 cells subjected to experiments as described in (A). In the absence of LPS (control), Mt bacilli were found inside typical single-membrane mycobacterial phagosome compartment, indicated by black arrows in images 1 and 2. By contrast, in the presence of LPS, Mt bacilli were found in typical double-membrane autophagosomes (images 3 and 4). Potential fusion events between mycobacterial phagosome and autophagosome were observed (image 5). Image 6 illustrates the presence of onion-like multilamellar structures containing mycobacteria. Black arrows, outer membranes; white arrows, internal membranes; double black arrows, onion-like multilamellar structures; white asterisks, Mycobacterium tuberculosis. Graph represents the quantitation of 100 internalized mycobacteria per experimental condition.
Figure 7
Figure 7. p38 MAPK inhibition blocks LPS-induced co-localization of Mycobacterium tuberculosis with autophagosomes
RAW264.7 cells stably expressing GFP-LC3 were infected with Mycobacterium tuberculosis expressing red fluorescent protein (RFP) 1 h prior to a 30 min incubation with p38 MAPK inhibitor or vehicle (DMSO) followed by further incubation for 16 h in the presence or absence of LPS. Upper panel: representative fluorescence images. Lower panel: Quantitation of percentage of colocalization of Mycobacterium tuberculosis with GFP-LC3-positive autophagosomes GFP-LC3-positive autophagosomes. Graph represents the quantitation of 100 internalized mycobacteria per experimental condition. Data denote means ± SEM from two independent experiments. Scale bar, 10 μm. *denotes p< 0.05, when compared to control condition.

References

    1. Levine B, Klionsky DJ. Development by self-digestion: molecular mechanisms and biological functions of autophagy. Dev Cell. 2004;6:463–477. - PubMed
    1. Levine B. Eating oneself and uninvited guest: autophagy-related pathways in cellular defense. Cell. 2005;120:159–162. - PubMed
    1. Kirkegaard K, Taylor MP, Jackson WT. Cellular Autophagy: surrender, avoidance and subversion by microorganisms. Nat Rev Microbiol. 2004;2:301–314. - PMC - PubMed
    1. Nakagawa I, Amano A, Mizushima N, Yamamoto A, Yamaguchi H, Kamimoto T, Nara A, Funao J, Nakata M, Tsuda K, et al. Autophagy defends cells against invading group A Streptococcus. Science. 2004;306:1037–1040. - PubMed
    1. Ogawa M, Yoshimori T, Suzuki T, Sagara H, Mizushima N, Sasakawa C. Escape of intracellular Shigella from autophagy. Science. 2005;307:727–731. - PubMed

Publication types

Cite

AltStyle によって変換されたページ (->オリジナル) /