The global nitrogen cycle in the twenty-first century
Lucy J Sheppard
Bruna Grizzetti
James N Galloway
Peter Vitousek
Allison Leach
Alexander F Bouwman
Klaus Butterbach-Bahl
Frank Dentener
David Stevenson
Marcus Amann
Maren Voss
e-mail: dfo@ceh.ac.uk
One contribution of 15 to a Discussion Meeting Issue ‘The global nitrogen cycle in the twenty-first century’.
Abstract
Global nitrogen fixation contributes 413 Tg of reactive nitrogen (Nr) to terrestrial and marine ecosystems annually of which anthropogenic activities are responsible for half, 210 Tg N. The majority of the transformations of anthropogenic Nr are on land (240 Tg N yr−1) within soils and vegetation where reduced Nr contributes most of the input through the use of fertilizer nitrogen in agriculture. Leakages from the use of fertilizer Nr contribute to nitrate (NO3−) in drainage waters from agricultural land and emissions of trace Nr compounds to the atmosphere. Emissions, mainly of ammonia (NH3) from land together with combustion related emissions of nitrogen oxides (NOx), contribute 100 Tg N yr−1 to the atmosphere, which are transported between countries and processed within the atmosphere, generating secondary pollutants, including ozone and other photochemical oxidants and aerosols, especially ammonium nitrate (NH4NO3) and ammonium sulfate (NH4)2SO4. Leaching and riverine transport of NO3 contribute 40–70 Tg N yr−1 to coastal waters and the open ocean, which together with the 30 Tg input to oceans from atmospheric deposition combine with marine biological nitrogen fixation (140 Tg N yr−1) to double the ocean processing of Nr. Some of the marine Nr is buried in sediments, the remainder being denitrified back to the atmosphere as N2 or N2O. The marine processing is of a similar magnitude to that in terrestrial soils and vegetation, but has a larger fraction of natural origin. The lifetime of Nr in the atmosphere, with the exception of N2O, is only a few weeks, while in terrestrial ecosystems, with the exception of peatlands (where it can be 102–103 years), the lifetime is a few decades. In the ocean, the lifetime of Nr is less well known but seems to be longer than in terrestrial ecosystems and may represent an important long-term source of N2O that will respond very slowly to control measures on the sources of Nr from which it is produced.
Keywords: nitrogen fixation, denitrification, emissions, deposition, global budgets
1. Introduction
The global nitrogen cycle is central to the biogeochemistry of the Earth, with large natural flows of nitrogen from the atmosphere into terrestrial and marine ecosystems through biological nitrogen fixation (BNF), in which the largely un-reactive molecular nitrogen is reduced to ammonium compounds. The fixed nitrogen is subsequently transformed into a wide range of amino acids and oxidized compounds by micro-organisms, and finally returned to the atmosphere as molecular nitrogen through microbial denitrification in soils, fresh and marine waters and sediments [1]. The initial fixation steps generate compounds containing reactive nitrogen (Nr, which includes NH3, NH4, NO, NO2, HNO3, N2O, HONO, PAN and other organic N compounds) which, in addition to their role in biological and ecosystem function in terrestrial and marine ecosystems, also become widely distributed in the atmosphere and cryosphere as described in papers within this issue. The presence of Nr in these components of the Earth system provides a tracer of the biogeochemical cascade of Nr through the environment as discussed by Galloway et al. [2]. In the atmosphere, NOx plays a key role in the photochemical production of ozone and other key oxidants and radical species [3] and is closely coupled to the oxidizing capacity of the atmosphere [4]. Similarly, the emission of N2O following denitrification plays a key role in the radiative balance of the Earth and in the chemistry of the ozone layer in the stratosphere, where N2O is destroyed by photolysis [3].
In the absence of human influences, BNF and the production of NOx by lightning would be the only sources of new Nr in the environment.
The supply of Nr is essential for all life forms, and increases in nitrogen supply have been exploited in agriculture to increase the yield of crops and provide food for the growing global human population. It has been estimated that almost half of the human population at the beginning of the twenty-first century depends on fertilizer N for their food [5]. The nitrogen applied in agriculture is derived from atmospheric sources, but unlike the natural process of N fixation, most agricultural N is fixed industrially by the Haber–Bosch process [6], the remainder by nitrogen-fixing crops [7]. Nitrogen fixation by the Haber–Bosch process also provides Nr for other industrial applications, including explosives. Overall, the fixation of nitrogen through Haber–Bosch (120 Tg N yr−1) in 2010 was double the natural terrestrial sources of Nr (63 Tg N yr−1). Atmospheric nitrogen is also fixed unintentionally through human activities, especially during the combustion of fossil fuels by internal combustion engines, and industrial activity, including electricity production.
The overall magnitude of anthropogenic relative to natural sources of fixed nitrogen (210 Tg N yr−1 anthropogenic and 203 Tg N yr−1 natural) is so large it has doubled the global cycling of nitrogen over the last century. As nitrogen is a major nutrient, changes in its supply influence the productivity of ecosystems and change the competition between species and biological diversity, [8]. Nitrogen compounds as precursors of tropospheric ozone [9] and atmospheric particulate material [10] also degrade air quality. Their effects include increases in human mortality [11], effects on terrestrial ecosystems [12,13] and contribute to the radiative forcing of global and regional climate [4].
There are therefore important consequences of the human modification of the global nitrogen cycle, with benefits in food production and costs due to impacts on human health, biodiversity loss and climate [8].
Knowledge of the global nitrogen cycle is incomplete, but has developed rapidly over the last two decades, with many new measurements and improved instrumentation, models and process understanding. Galloway et al. [14] documents a chronology in the development of the science and shows major changes in understanding as knowledge has accumulated and the range of processes and compounds involved has expanded.
This paper describes the global nitrogen cycle at the beginning of the twenty-first century, and quantifies each of the major terms in the global budget, separating where possible the natural fluxes from those created by anthropogenic activity. In this way, the contemporary magnitudes of natural and anthropogenic contributions are identified and contrasted. The very different sources and chemical properties of reduced and oxidized forms of nitrogen are also separated, to illustrate their relative magnitudes.
The overview presents the major fluxes between terrestrial and marine ecosystems and the atmosphere. The detailed descriptions of Nr processing within the atmosphere and terrestrial and marine ecosystems are provided by companion papers in this issue. The individual papers have been written independently and where possible cross references are made to the common issues, processes and fluxes. The fluxes used in this global summary are largely those deduced within each of the sectors (terrestrial, marine, etc.) presented in the companion papers.
2. Sources of fixed nitrogen
(a). Biological fixation
(i). Terrestrial ecosystems
BNF provides an important reference when quantifying the importance of human inputs to the global nitrogen cycle, as this is the primary non-anthropogenic input of Nr [15]. The quantity from lightning, discussed later, is over an order of magnitude smaller than any of the estimates of BNF, albeit of large importance for the formation of ozone in and the maintenance of the oxidation capacity of the global atmosphere. The process of BNF was identified in the late nineteenth century and has since become a focus of ecological interest. There remain important limitations in understanding, including why, with such a widespread capability in ecosystems to fix atmospheric N2, organisms do not fix more N, when the benefits would provide advantages over competitor organisms that lack a nitrogen-fixing capability. For many ecosystems, the availability of Nr in soils clearly down-regulates BNF, so perhaps the widespread application of Nr on farmland and deposition to semi-natural land has decreased non-agricultural BNF (as assumed in [1]). Current knowledge of processes and controls has not provided unambiguous answers to these questions. The review in this issue by Vitousek et al. [16] provides an estimate of annual pre-industrial BNF in terrestrial ecosystems of 58 Tg N, within a range of 40–100 Tg, and a discussion of current understanding and limitations. The uncertainty range is large and reflects the difficulty in estimating the component terms. The value deduced by Vitousek et al. [16] is smaller than many published estimates, especially earlier values suggesting pre-industrial BNF in the range 100–290 Tg N yr−1. However, this new calculation is based on estimates of hydrological losses of nitrogen from terrestrial systems and the fraction of nitrogen denitrified in streams and rivers may be overestimated.
(ii). Marine ecosystems
The nitrogen cycle in the oceans including BNF and denitrification is reviewed by Voss et al. [17]. Estimates of both terms suggest either an excess of denitrification over BNF or an approximate balance of the two [18]. However, uncertainties in the individual terms preclude a clear consensus. The underpinning control mechanism over the balance between BNF and denitrification at large scales has not been demonstrated, but phosphorus and iron availability may be important contributors. Covering three quarters of the Earth's surface, oceans clearly dominate the surface area and even relatively small fluxes per unit area have the potential to make a substantial contribution to total N fluxes between the atmospheric N2 reservoir and marine Nr. One of the key uncertainties in the rates of marine BNF is spatial variability, since these are coupled to the supply of other nutrients required for the processes, especially phosphorus and iron whose supply is spatially variable [19]. Larger rates of BNF have been suggested for the Atlantic than the Pacific oceans due to greater nutrient supply [17].
Global marine BNF has been estimated at 125 Tg N annually [20], with a suggested range of 60–200 Tg N [21]. Other recent estimates of marine BNF include values of 140 Tg N yr−1 from Canfield et al. [22] and 145 Tg N yr−1 from Galloway et al. [1]. It is unclear from the papers how independent the estimates are and while there are substantial sets of measurements, these do not appear to be systematic in covering the spatial and temporal scales needed to provide rigorous estimates of variability.
Here, the value for marine BNF argued by Voss [17] of 140 Tg N yr−1 (±50) has been adopted in the global budget.
(b). Lightning
In addition to BNF, nitrogen is also fixed naturally as NOx by lightning, which introduces reactive N to relatively remote regions of the troposphere.
The process is has been investigated using direct measurements and supported by satellite remote sensing of lightning activity. Global production has been estimated using available data and models, but with substantial uncertainties in part due to difficulties in up-scaling, by Brasseur et al. [23], who also consider possible effects of climate change on rates of NOx production from lightning. These authors calculate an increase in NOx production with increasing global temperature in the range 3–12% per °K. Estimates of the overall global source strength vary from 2 to 10 Tg N yr−1 [24,25], with the more recent values closer to 5 Tg N annually. For this review a value of 5 Tg N yr−1 has been adopted.
(c). Global natural sources of reactive nitrogen
The global natural sources of Nr total 203 Tg N (±50 Tg N yr−1), comprising approximately one-third from terrestrial ecosystems and two-thirds from marine ecosystems, with just 2.4 per cent from lightning (table 1). The uncertainty in each of the estimated components is very large, reflecting the difficulty in up-scaling from the available data and the lack of global scale measurements to constrain the values. The marine fixation is the largest contributor to BNF but the factor of two difference between marine and terrestrial is larger than many earlier estimates due to the smaller estimate of terrestrial BNF.
Table 1.
Global nitrogen fixation prior to human influence on agricultural BNF and before the industrial revolution.
(d). Anthropogenic nitrogen fixation
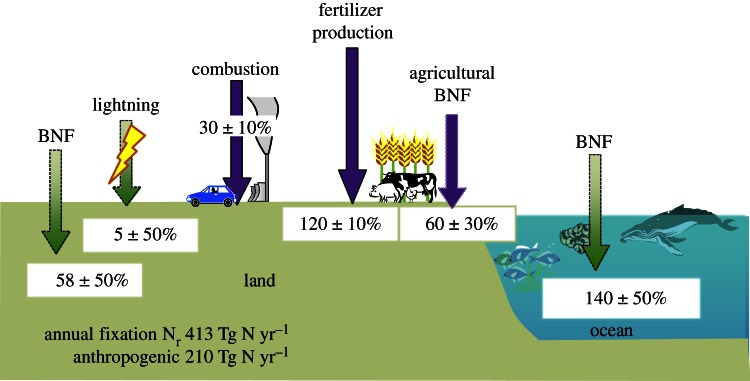
Anthropogenic fixation of nitrogen compounds, while uncertain, is better known than natural fixation, in part because the source sectors have been subject to more extensive measurements and have also been subject to greater scientific scrutiny, with regular monitoring of some large industrial sources. The gases created are the oxidized nitrogen compounds NO and NO2 from transport and industry, biomass combustion and reduced nitrogen as NH3 from the Haber–Bosch process (figure 1).
Figure 1.
Global nitrogen fixation, natural and anthropogenic in both oxidized and reduced forms through combustion, biological fixation, lightning and fertilizer and industrial production through the Haber–Bosch process for 2010. The arrows indicate a transfer from the atmospheric N2 reservoir to terrestrial and marine ecosystems, regardless of the subsequent fate of the Nr. Green arrows represent natural sources, purple arrows represent anthropogenic sources.
Organic nitrogen compounds, for example as amines, are widely present in the environment and the quantities may be substantial, as discussed by Cape et al. [26] and Jickells et al. [27]. However, there is no evidence that these compounds represent additional Nr, which is therefore derived from the natural or anthropogenic BNF or industrial sources of NH3 or NOx. The compounds and processes involved in emission of organic nitrogen and their fluxes into the atmosphere are not known in sufficient detail to enable the up-scaling for regional or global estimates of their source strength. Thus an important contribution to anthropogenic emissions of Nr may be missing from the global Nr budgets constructed to date, including the one presented here, but these compounds are unlikely to represent additional primary sources of Nr.
(i). Biological nitrogen fixation in cropland
Nitrogen-fixing agricultural crops also contribute substantial quantities of Nr to soils. In a recent detailed review of agricultural BNF, Herridge et al. [28] compiled data from direct measurements of BNF from a range of agricultural systems globally and up-scaled annual nitrogen fixation rates using land-use and cropping data to calculate a global total. The current global BNF from agricultural crops and grazed savannahs estimated by Herridge is 50–70 Tg N yr−1. For the purpose of summarizing the data, a central value of 60 Tg N yr−1 as the global annual Nr flux for BNF in cropland has been used in this review. The value of BNF for cropland is very close to the pre-industrial BNF and is indistinguishable within the current range of uncertainty.
It is helpful to separate the oxidized and reduced sources of Nr, as these are produced by very different sources and have effects and pathways through the environment which also differ.
(ii). Oxidized nitrogen
The main process creating oxidized Nr compounds is combustion within internal combustion engines and industrial power plants, especially for electricity supply. It is important to distinguish between the creation of Nr and emission to the atmosphere. The focus in this section is on the creation of Nr but the subject of most research in this field has been on emissions to the atmosphere, as this is the driver of many of the environmental issues involving NOx. The compounds generated are mainly NO and NO2, which arise from oxidation of atmospheric N2, and there is an additional contribution from nitrogen compounds in the fuel, derived from sequestration at the time the organic deposits were laid down [3]. Biomass burning represents an important global contribution of Nr to the atmosphere, but this is primarily from nitrogen in the fuel and does not represent new Nr fixation. Emissions of NOx have been extensively measured both directly from sources and also derived from satellite remote sensing to estimate global biomass emissions [29].
Emissions of nitric oxide (NO) from soils also contribute significantly to atmospheric emissions, but this is not an additional source of Nr as it results from the microbial transformations of existing Nr in soil, through nitrification and denitrification [30,31]. The processes leading to soil emissions are discussed by Butterbach-Bahl et al. [32] and Pilegaard [33]; while emission rates per unit land area are small (5–50 ng NO-N m−2 s−1) relative to combustion sources, the emissions occur over large areas of the global agricultural landscapes.
Recent reviews of global emissions show a surprising agreement in the overall magnitude of NOx emissions but larger differences in specific source contributions, as discussed by Granier et al. [34] and Isaksen et al. [4]. Estimates of global NOx production and emissions from van Vuuren et al. [35] show values for the year 2000 of approximately 40 Tg N yr−1 of which 30 Tg N yr−1 is new Nr, the remainder being Nr in fuel and in biomass. The 40 Tg N total annual emission comprises 30 Tg N from fossil fuel combustion, 5 Tg N from biomass combustion and 5 Tg N from soil NO emissions. Control measures on emissions, despite industrial development in parts of Asia and Africa are assumed to reduce emissions by the middle of the twenty-first century to approximately 30 Tg N yr−1, but with large uncertainty.
(iii). Reduced nitrogen
Anthropogenic fixation of reduced nitrogen (NH3) is through nitrogen-fixing crops and the main source through the Haber–Bosch process, where H2 and N2 are combined at high temperatures and pressures in the presence of catalyst [5]. The process was developed during the early years of the twentieth century and by the first decade of the twenty-first century is producing 120 Tg N as NH3 annually, of which 80 per cent is used as agricultural fertilizer and 20 per cent as feedstock for industrial processes [36]. The fate of nitrogen used in crop production varies, with only 17 per cent consumed by humans in crops, dairy and meat products, the remainder being lost to the soils, freshwaters and the atmosphere [37]. In the longer term (decades to centuries), most of the Nr is returned to the atmosphere as N2 following denitrification, but the lifetime in different reservoirs en route back to the atmosphere allows opportunities for transport into freshwaters or the atmosphere in reactive form. Some of the crop Nr applied as fertilizer is emitted to the atmosphere as NH3 depending on the relative balance between ambient NH3 concentrations and the equilibrium concentration with the NH4+ concentration within intercellular fluids [38]. The annual total production through the Haber–Bosch process of 120 Tg N as NH3 represents the largest single contribution to Nr formation through anthropogenic activity. The use of nitrogen-fixing crops in agriculture contributes an additional 60 Tg N annually [28], which enters the crop and soil cycling of Nr (figure 2). The total anthropogenic production of Nr in reduced form is therefore 180 (±20) Tg N annually.
Figure 2.
The processing and fluxes of reactive nitrogen in terrestrial and marine systems and in the atmosphere (Tg N yr−1), showing the dominant forms of the Nr in the exchanges and the magnitude of the boundary fluxes, and approximate lifetimes, integrated over global scales.
The total fixation of atmospheric N2 by natural and anthropogenic activities at the beginning of the twentieth century is therefore 413 Tg N of which approximately half results directly from human activity. The relative proportions of reduced and oxidized nitrogen within the anthropogenic component is 85 per cent and 15 per cent, respectively, revealing the dominant role of reduced Nr and the Haber–Bosch process in the budget of emissions. The components of global Nr production are summarized in figure 1.
3. Trends in Nr emissions during the twenty-first century
Emissions of Nr to the atmosphere are a key driver of atmospheric chemistry and composition [10]. Estimates of emissions of Nr compounds through the twenty-first century are provided by van Vuuren et al. [35] from a range of scenarios, including the IPCC-SRES and the RCP projections for the 4th IPCC assessments [39]. Emissions of approximately 40 Tg N annually of NOx continue through the period 2000–2040, and then decline through to 30 Tg N yr−1 according to the RCP scenarios by the end of the century, with a gradual increase in uncertainty with time such that the envelope containing the 25th and 75th percentiles stretches from 15 Tg N yr−1 to 70 Tg N yr−1 by 2100. The future emissions of NOx strongly depend on the assumptions on how activities, especially energy and transport use will develop, and to what extent emissions will be abated by air pollution controls.
For reduced nitrogen, emissions to the atmosphere increase from 60 Tg N yr−1 in 2000 to between 70 and 80 Tg N yr−1 by 2100, mainly depending on the need for food and the nitrogen fertilizer required. These scenarios, while uncertain, are partly based on the assumption that as society develops, gradually emissions of NOx to the atmosphere are controlled, and while this has been the case over the last few decades, it is a simple assumption that may not be correct for the future. This is also a period in which global climate is projected to change, with substantial warming, averaging between 2 and 4 °K relative to pre-industrial times by 2100 [39]. Changes in temperature of this magnitude will directly influence the surface to atmosphere exchange of many trace gases, and NH3 in particular, the emissions of which are strongly coupled to the temperature of vegetation [40]. The magnitude of increases in NH3 emissions as a consequence of changes in climate is addressed by Sutton et al. [41], and might reach 130 Tg NH3-N yr−1 by 2100.
Emissions to the atmosphere of Nr from anthropogenic activities seem destined to increase, driven by the dominant term, the emissions of NH3 from agriculture. The global fluxes of Nr shown in figures 1, 2 and 3 are listed in table 2, with their author attributions.
Figure 3.
The global atmospheric processing of reactive nitrogen, illustrating the main sources, the main chemical pathways and products and the magnitudes of the fluxes (units Tg yr−1). The emission flux values in black are the total fluxes while the red values indicate the anthropogenic contribution.
Table 2.
A summary of global fluxes of Nr and literature sources.
| global nitrogen fluxes | Tg N yr−1 | references |
|---|---|---|
| industrial production (fertilizer 100, chemical industry 20) | 120 | [36,42] |
| N2 fixation natural ecosystems | 58 | [16] |
| N2 fixation by oceans | 140 | [17] |
| N2 fixation by agricultural crops | 60 | [28] |
| combustion NOx emissions | 40 | [35] |
| NO emissions from soils | 5 | [33,43] |
| N2O emissions from soils | 13 | [44] |
| lightning | 5 | [24,25] |
| NH3 emissions from terrestrial ecosystems into the atmosphere | 60 | [41] |
| wet and dry deposition of oxidized nitrogen to terrestrial surfaces | 70 | [45,21] |
| wet and dry deposition of oxidized to oceans | 30 | [45,21] |
| NH3 emissions from oceans (and volcanoes) to atmosphere | 9 | [42,39,21] |
| N2O emissions from the oceans to atmosphere | 5.5 | [46] |
| denitrification to N2 in oceans | 100–280 | [17,47,21] |
| Nr burial in oceans | 20 | [17] |
4. Processing and distributing Nr through the Earth system
The Nr fixed by natural processes or anthropogenic activity is processed chemically in the atmosphere and largely by microbial and plant biochemistry in terrestrial and marine environments. The products of the chemical processing include a wide range of inorganic and organic compounds. The relative magnitudes of the quantities of Nr cycling within each of these environments are shown in figure 2. This simple representation shows the terrestrial component to be responsible for processing of 240 Tg N in its different forms, while 230 Tg N yr−1 is processed in the oceans and approximately 100 Tg N yr−1 is processed in the atmosphere, ignoring the fluxes into and out of the much larger atmospheric N2 reservoir. Also shown in figure 2 is a rough estimate of the residence time of the Nr in each of these environments to show that the atmospheric residence time is short relative to marine and terrestrial compartments, and that even in the case of terrestrial environments (except peatlands), the average lifetime of Nr is only a few decades. Such averaging over the global terrestrial biosphere is potentially misleading as there are long-lived reservoirs, such as organic matter in peatlands and Nr in ice sheets and in deserts and aquifers. The Nr generated through BNF in terrestrial and marine ecosystems is processed by plant metabolism and microbial activity and converted into plant and microbial protein. The vegetation bound Nr in agricultural crops is either used directly as food for human consumption or fed to livestock and converted, rather inefficiently, to protein for human consumption. The conversions and transfers from initial fixation through the food chain all present opportunities for leakages to ground water or the atmosphere.
The readily available inorganic Nr in soils, if not sequestered by vegetation is transformed through nitrification or denitrification to gaseous forms (NO, N2O or N2) depending on soil physical conditions and oxidation state [31]. The fluxes from soil to the atmosphere, soil water and rivers transport the Nr compounds over a range of distances, depending on subsequent transformations, as illustrated in figure 2 and described in greater detail in the companion papers in this issue.
(a). The nitrogen cascade
The transfer of Nr from soils to atmosphere and to freshwaters has a wider application in considering the leakages of Nr from transformations in soils, vegetation and water. Galloway et al. [2] introduced the nitrogen cascade concept to illustrate the many inter-conversions and leakages of Nr occurring between the original fixation step and denitrification back to the atmosphere as N2. It is helpful to take an example describing the fate of a freshly produced NH3 molecule to illustrate the point: consider a nitrogen atom converted to an NH3 molecule in the Haber–Bosch process, applied as fertilizer to soil and transformed many times before finally being returned to the atmosphere as N2. A possible sequence of transformations is illustrated in table 3, with an indication of the environmental effects at each stage.
Table 3.
Illustrating the nitrogen cascade: a possible life cycle of a nitrogen atom following fixation in the Haber–Bosch process to NH3 and its pathway through terrestrial and marine ecosystems and the atmosphere before returning to the atmospheric N2 reservoir. The single N atom contributes en route to eutrophication and acidification of terrestrial and marine ecosystems, and to human health and climate effects.
| transformation | pathway | environmental effect |
|---|---|---|
| N2 fixation: Haber–Bosch process N2 → NH3 | industry | energy intensive process, production of CO2 plus all the consequences of the Nr as it cascades through soils, the atmosphere and aqueous phases |
| N fertilizer on crops | agricultural lands | provision of food for human consumption |
| NH4 nitrified to → NO3 NO in soil → atmosphere oxidation of NO → NO2 → HNO3 |
NO emission from soil to atmosphere and ozone production during volatile organic compound degradation | ozone effects on vegetation or human health [48,49] |
| aerosol formation, HNO3 → NO3 | in atmosphere | planetary albedo, human health [50] |
| wet + dry deposition NO3 to soil → vegetation NO3 → R-NH2 | removal from atmosphere and transfer to plant biomass | eutrophication, acidification [51] |
| consumption by herbivores: excreted as urea R-NH2 → CO(NH2)2 | plant biomass → animal protein → excreted and returned to soil | eutrophication [51] |
| urea converted to NH3 in soil and released to atmosphere | soil to atmosphere flux of NH3 | eutrophication |
| NH3/NH4 uptake by vegetation | removal from atmosphere by dry deposition to vegetation | eutrophication |
| decomposition R-NH3 → NH4 | vegetation to soil | eutrophication |
| NH4 nitrified to NO3 transferred to river/estuary/open ocean | soil to ground water → river → ocean | eutrophication |
| ocean uptake in phyto/zooplankton | shelf seas to open ocean | eutrophication |
| denitrification in ocean sediments NO3 → N2 | returns to atmosphere as N2 and N2O | climate change |
The wide range of issues and processes in which nitrogen is involved are very seldom integrated at a global scale. Instead, the science is described within components such as the oceans, atmosphere or terrestrial ecosystems, as in the companion papers. The issues within each and the approaches to describe and investigate them are different. The following three sections outline approaches and issues for Nr in the atmosphere and terrestrial and marine ecosystems.
(b). Atmospheric processing of Nr
(i). Application of chemistry transport models
Emissions of NOx to the atmosphere from anthropogenic and natural processes have been a focus of interest as these compounds play a major role in atmospheric chemistry, especially of photochemical oxidants such as ozone (figure 1). The chemical processing has been simulated within chemistry transport models (CTM) to quantify transport transformation and deposition at regional and global scales. Early models of the global cycles of oxidized and reduced nitrogen (NOy and NHx) were treated separately [52]. Currently, while almost all global atmospheric chemistry models include a representation of NOy chemistry, few models include reduced nitrogen (NHx). In a recent model intercomparison [45], 23 global models included NOy, while only seven included NHx. However, increasingly, models now include combined aerosol and photochemistry descriptions, as reviewed by Fiore et al. [53].
The first attempts to model the global NHx cycle were based on a simplified, empirical approach that assumed a limited uptake of NH3 according to (NHx)1.5H0.5SO4. More recent models describe aerosol equilibrium using equilibrium modules.
The resolution of global models currently ranges from 0.5° ×ばつ 0.5° to 4° ×ばつ 5° latitude–longitude and is expected to increase to 0.25° ×ばつ 0.25° in the coming years. Also the spatial domain and resolution of regional models has been steadily improving typically from 36 km to 12 km grid sizes, and higher resolutions for limited periods. As we argue below high resolution is important to accurately describe deposition, especially over complex terrain.
(ii). Dry and wet removal
Realistic descriptions of wet and dry deposition and thorough evaluation with high-quality measurements remain a major weakness of global modelling of the atmospheric Nr cycle. Rain formation, as a part of the hydrological cycle, is one of the more difficult parameters in global weather forecasting, and the removal of pollutants by rain formation in clouds and scavenging below clouds is even more uncertain. Wet removal is especially uncertain in tropical regions, where rainfall often occurs on sub-grid model scales in convective storms and in the mid-latitudes over mountains where orographic wet scavenging processes operate at sub-grid scales for these models [54]. The description of dry deposition often follows simplistic deposition velocity schemes [55], coupled to a land-use database and model generated meteorology. Such approaches are some decades behind current understanding of processes for trace gases generally and nitrogen compounds in particular [56]. In practice, some components of Nr are both emitted and deposited onto terrestrial surfaces, a process referred to as bidirectional exchange. The direction of the flux is determined by the relative concentrations in the vegetation and above canopy air according to a compensation point [38]. At present, global CTMs do not consider interactive exchange with nitrogen pools in vegetation and soils. Moreover, the lack of routine flux measurements of reactive nitrogen compounds precludes validation of modelled dry deposition with field data at any more than three or four locations.
(iii). Uncertainties and constraints on global atmospheric budgets
The missing processes in the formulation of global atmospheric transport models include: sub-grid deposition; incomplete mixing on sub-grid scales (consider, e.g., farm scale NH3 emissions and regional sulfate plumes), and emissions from canopy and oceans. To what extent, then, can we trust the outputs of global models for global deposition? Some constraints are offered by recent satellite observations. For example, NO2 observations from Sciamachy instruments [57] provide constraints on NOx emissions, and thus to some extent also on deposition. Underestimates of NOx emissions over China were reported by Van Noije et al. [58]. Very recent NH3 satellite observations indicate in some cases missing hot spots of NH3 emissions [59] but have not so far been used to constrain the global NH3 cycle.
The global models cannot provide much of the regional deposition detail; nevertheless, there was a recent comparison by Dentener et al. [45] of 21 global models with wet deposition measurements in North America and Europe. They demonstrate reasonable performance in southeast Asia, but problems in Africa, South Asia and South America. A lack of high-quality data in the latter regions still precludes clear conclusions on model performance with regard to deposition. Mass conservation requires that global emissions equal global deposition; until higher accuracy measurements with sufficient spatial coverage become available, the global atmospheric nitrogen cycle will be associated with uncertainties in the order of 30–50%.
The reactive gases are processed rapidly and lead to the formation of O3 and other photochemical oxidants and secondary inorganic and organic aerosols [9] during the photochemical degradation of volatile organic compounds. The NH3 is either dry deposited back to the surface or incorporated in aerosol, either as NH4NO3 or, if SO2 is present in significant quantities, as (NH4)2SO4. The lifetime of these short-lived compounds is typically a day or two, being longer as aerosol, which relies on wet scavenging for the majority of the removal process. The models are able to capture the global distribution of ozone in the troposphere at the surface quite well [9]. However, at regional scales there remain considerable problems reproducing the trends in surface concentration changes through the last few decades [60].
The atmospheric processing of reduced nitrogen compounds has received much less attention than oxidized nitrogen, but is now incorporated in many regional [61,62] and global models [45]. Projected trends in emissions of NH3 make this the dominant component of emissions through this century, and one which is likely to increase with temperature, owing to the coupling between temperature and the gas and liquid phase partitioning [63].
Emissions of N2O from soil during denitrification [64,65] have a longer atmospheric lifetime at approximately 100 years, relying on photolysis in the stratosphere for its removal.
The net flow of Nr from the land into the oceans and the atmosphere is unsurprising given the mobility of Nr in soil water and transfer to the oceans by rivers [66] and the advection of the atmospheric Nr by wind over coastlines. There is also transfer within the terrestrial landscape from the Nr hot spots to areas with small Nr inputs from farming and industry. These include large areas of semi-natural land (e.g. heathlands, forest and mountains) but also include small areas embedded within intensively used parts of the landscape such as nature reserves or unmanaged land surrounded by industrial areas or farmland. These are the components of the landscape showing some of the largest effects of Nr deposition, including widespread changes in flora or the emission of trace Nr species [67,68].
(c). Terrestrial processing of Nr
Most of the anthropogenic perturbation of the nitrogen cycle is driven by activity on land, both through the use of Nr in agriculture and through industry, electricity generation and transport. Although the initial steps in much of the industrial and transport Nr production lead directly to emissions to the atmosphere, the relatively short residence times of oxidized Nr compounds lead to rapid return of NOy and NHx to the Earth's surface as deposition. The geographical distribution of Nr source areas leads to two-thirds of global atmospheric Nr inputs to terrestrial surfaces and one-third onto marine surfaces [1] (figure 2).
To date, the most detailed assessment of terrestrial processing and fluxes of Nr on a regional basis has been provided within the European Nitrogen Assessment (ENA) [69]. Assessments for other regions and the global scale have yet to be completed. Earlier analyses by Galloway et al. [1] provide estimates of the global transformations and flow of Nr through terrestrial ecosystems and into the atmosphere and oceans. These two syntheses are broadly consistent in showing the dominant role of terrestrial processing of Nr (figure 4).
Figure 4.
The nitrogen cycle within the EU-27 showing natural fluxes (Tg N) in green, (intentional) anthropogenic fluxes as blue and (unintentional) as orange adapted from the ENA [69]. The terrestrial component of the cycle is delineated by the dotted ellipse.
The analysis within the ENA allows the relative scales of the different activities to be compared. The cycling of Nr within agriculture through fertilizer inputs to cropland and the flow of Nr through livestock and back into soils reveals the central role of processes, with soils as the principle location of Nr transformations and ultimately the main site of denitrification back to N2. If we fully understood these processes globally and knew the magnitude of the fluxes and their spatial distribution globally, the uncertainties in global budgets would be greatly reduced. Simply ranking the magnitudes of the fluxes in the European N cycle by size shows that of the 35 fluxes quantified in figure 4, fluxes from or to soils comprise the top 15 and compromise most of the Nr processing within Europe. The processing and leaching of Nr in catchments and the export to coastal seas are described by Howarth et al. [70] and Billen et al. [66]. The long-term trends in nitrate in the Thames in the UK (between 1868 and 2008) reveal the magnitude of the change in countries that industrialized early [71].
(d). Processing Nr in the oceans
The cycling and processing of Nr within the oceans has received much less attention, but recent reviews have identified the major components and issues [17,21,72]. BNF in oceans is a very large component at 140 Tg N annually, among the largest in the global budget (figure 2), and is subject to more uncertainty than most of the terrestrial terms owing to the lack of measurements. The net transfer of Nr to oceans from terrestrial systems is processed (figure 5) and some is buried in organic sediments while the remainder is denitrified and returned to the atmosphere as either N2 or N2O. The fraction of the Nr returned to the atmosphere as N2O is spatially very variable, and quantifying the global N2O source from ocean sources, while subject to considerable uncertainty, is a substantial term, estimated by Duce et al. [21] to be 5.5 Tg N yr−1 as N2O, and represents approximately 30 per cent of the emission flux of N2O, from the ocean [17]. A source strength of this magnitude may offset as much as two-thirds of the enhancement of the ocean sink for CO2 owing to nitrogen fertilization of the oceans [21].
Figure 5.
A simplified schematic of nitrogen cycling in the global oceans (adapted and simplified from [17]). The fluxes are as detailed in the text to be consistent with figure 2.
The global flow of N in oceans is coupled to the wider circulation patterns, and especially the ocean conveyor system transporting solutes southwards at the ocean floor in the Atlantic ocean towards the Antarctic circumpolar current and from there northwards into the Indian and Pacific oceans. The timescales of transport are long relative to other timescales of Nr processing, with Atlantic water residence times of approximately 180 years, exceeding the time since industrial contributions to the global nitrogen cycle began. Thus, the ocean transport timescales are long relative to the processing times in the ocean and much longer than atmospheric transport or land to ocean transport timescales, by several orders of magnitude. A consequence of these timescales is large regional and vertical variability in concentrations of Nr in oceans. Peak values occur in the coastal zones, which are strongly influenced by terrestrial outflow, and at the larger scale the peak values occur in polar and bottom water and minimum values occur in tropical surface waters, where available Nr is quickly assimilated. A consequence of the large spatial variability, including the coastal zones, is that hot spots of accumulation and processing are an important feature, resulting in substantial emissions of N2O from relatively small areas of the ocean, which have not been measured.
(e). Fate and residence time of Nr in the atmosphere, and terrestrial and marine ecosystems
The ultimate fate of Nr fixed naturally and from human activity is as N2 returned to the atmosphere. However, during the pathway from production of Nr to its ultimate fate, it presents the potential for effects on terrestrial ecosystems, human health and climate [8], as illustrated in table 2. The effects occur in part through sequestration in biomass, the largest storage term in the global processing of Nr. There are also much smaller but potentially significant stores of Nr in inorganic form in aquifers, ice sheets and peatland, all of which have residence times of century to millennia. In this section, these residence times are briefly discussed to indicate probable timescales for recovery from effects of human modification of the global nitrogen cycle.
(i). Atmosphere
The highly reactive compounds (NO, NO2, HNO3, NH3 and aerosol NH4 and NO3) have atmospheric lifetimes ranging from a few hours (NH3 and HNO3) to aerosols, which have lifetimes owing to removal by precipitation of a few days to a week. The greenhouse gas N2O has an atmospheric lifetime of approximately 100 years and relies on photolysis in the stratosphere for oxidation to NO before it can be scavenged from the atmosphere by wet and dry deposition. Thus, except for effects of N2O, reduction in emissions of Nr to the atmosphere would lead to a rapid reduction in most compounds in air and effects on climate and human health would cease after a period of a few weeks.
(ii). Terrestrial ecosystems
In terrestrial ecosystems, the additional Nr leads to enhanced quantities of Nr cycling between vegetation and the soil, with the main removal process being leaching as NO3 to ground water and denitrification as N2 back to the atmosphere. Plant and soil communities have evolved to sequester and recycle Nr as it is an essential and often limiting nutrient [73]. In tropical ecosystems, Nr is rapidly cycled, maintaining small pools of inorganic Nr in soil. Except for peatlands that store carbon and nitrogen for millennia, the majority of temperate and tropical ecosystems cycle the organic matter and nitrogen sufficiently quickly and a pulse of additional Nr is lost through denitrification and fire over a few decades. Thus, it appears that terrestrial ecosystems would recover from excess Nr inputs over a period of less than a century, and probably a few decades, following a reduction in Nr input. The species composition of the post-recovery ecosystems, however, may differ substantially from the composition prior to enhanced nitrogen deposition. In some semi-natural ecosystems, active management has been used to remove Nr from top soils, to restore low fertility plant communities and accelerate the recovery process [74].
Regional changes in biodiversity as a consequence of Nr deposition have been observed across Europe [12,51], and it is likely that the other major regions of enhanced Nr deposition will show similar trends. The primary productivity of these ecosystems may also be changing as many semi-natural ecosystems are nitrogen limited. The additional biomass sequestered as a consequence of the Nr deposition has been estimated for forests [75,76]. These studies consistently show that forests in areas of enhanced Nr deposition have been growing more rapidly in recent decades, an effect that has been shown to be a consequence of Nr deposition rather than changes in climate or forestry practice [76]. To date, the data from long-term Nr addition field experiments show increases in productivity and nitrogen enrichment of vegetation and surface soils [73]. In contrast to the networks of flux monitoring stations for terrestrial carbon exchange, there are no systematic measurements of nitrogen sequestration in terrestrial ecosystems, even though the sequestration of Nr is one of the driving variables for carbon sequestration [76]. Carbon sequestration in terrestrial ecosystems is clearly coupled to nutrient supply, especially of nitrogen and phosphorus [73,77].
(iii). Marine ecosystems
As with terrestrial ecosystems, there are no systematic measurements of nitrogen sequestration in the oceans and, again, carbon sequestration is clearly coupled to nutrient supply. The timescales of transport and Nr sequestration in the ocean are substantially longer than those in the atmosphere and in the majority of terrestrial ecosystems. Furthermore, the anoxic bottom waters are accumulating Nr, estimated by Galloway et al. [1] to be approximately 4 Tg N yr−1 and from which N2O is generated, which may represent an important long-term global problem. Thus, marine Nr reservoirs may prove to be more important in the longer term, as terrestrial and atmospheric reservoirs appear to recover more rapidly.
(f). Nitrogen sequestration
The global sequestration of Nr has been quantified using ecosystem models as described by Zaehle [78], who estimated terrestrial Nr sequestion of 27 Tg N yr−1 between 2001 and 2012. This may be compared with a rough estimate made using the annual terrestrial global C sequestration [79] and Churkina et al. [80], assuming a C/N ratio. Adopting this very simplistic approach for a C/N ratio of 30, terrestrial N sequestration would be 75 Tg N yr−1 and would vary between 50 and 100 Tg N for C/N ratios between 25 and 50, effectively spanning the range of observed C/N values, and similar to the value of 60 Tg N estimated by Galloway et al. [1] and significantly larger than the estimate by Zaehle [78].
The quantity of Nr sequestered in ice is discussed by Wolff [81] and estimated at 260 Tg N. Although this quantity may seem large, it represents accumulation over a very long time and the annual inputs are small.
5. Closing remarks
The global nitrogen cycle has been greatly modified by human activity, and among the key biogeochemical cycles on which ecosystems depend for their sustainability the nitrogen cycle is the most perturbed on the planet. Many components of the global budget have been quantified over the last 20 years, and the contrast between knowledge of the major fluxes in 1982 [82] and the descriptions of Nr cycling in ocean and terrestrial ecosystems and the atmosphere presented in this issue are striking. However, many fluxes are subject to large uncertainties and require extensive measurements to constrain the current range of values, a conclusion similar to that reached by Stewart [83] following the discussion meeting on the nitrogen cycle in 1981.
The consequences of human intervention in the nitrogen cycle include the obvious benefits for food security with approximately half of the global human population dependent on the increased yields of agricultural crops owing to fertilizer nitrogen usage, and substantially enhanced carbon sequestration resulting from Nr deposition to forests and other semi-natural terrestrial ecosystems [76]. The negative consequences of human fixation of nitrogen are also substantial and include the Nr contribution to effects of aerosols and ozone on human health [84], terrestrial ecosystem losses in biodiversity owing to Nr deposition at regional scales [85] and effects of Nr on climate described by Erisman et al. [8]. The effects on terrestrial ecosystems and the atmosphere have been subject to much more control than effects in marine ecosystems, which are the destination for a substantial fraction of Nr applied to terrestrial ecosystems. The transfer of 80–100 Tg Nr from land to oceans annually represents approximately half of anthropogenic emissions and comprises 50–70 Tg N leached from land to the ocean in freshwaters and the deposition of an additional 30 Tg N from the atmosphere on oceans. There are very few control measures in place to reduce the transfer of Nr to oceans and no international measures to regulate the overall effects of perturbation of the nitrogen cycle by human activity.
The Malthusian concept of food security being compromised by population growth has an interesting resonance in the context of the human influence on the nitrogen cycle. The problem of growing sufficient food to date has been largely solved by agricultural science, and the supply of nitrogen as fertilizer from the Haber–Bosch process has been a substantial contributor to increased productivity. However, the amounts of nitrogen applied have not been sufficiently constrained to prevent widespread leakage to freshwaters and the atmosphere, with consequent effects on human health, biodiversity and climate. The Nr injected into the environment from industry and transport, largely combustion sources, further increases the scale and range of effects. The irony here is that the societal needs for use of Nr for food have been satisfied by inefficient nitrogen use in agriculture, compromising other ecosystem services. To date, there has been much more effective regulation of Nr from combustion and transport sectors than Nr use in agriculture. Many of the accumulated effects of Nr are not attributable to any specific country or region, and the oceans may represent an important long-term problem as the marine Nr store gradually releases N2O to the atmosphere.
Acknowledgements
The authors gratefully acknowledge support from the EU research projects ACCENT+, PEGASOS and ECLAIRE for the preparation of this paper. The constructive comments of anonymous reviewers are also appreciated.
References
- 1.Galloway JN, et al. 2004. Nitrogen cycles: past, present, and future. Biogeochemistry 70, 153–226 10.1007/s10533-004-0370-0 (doi:10.1007/s10533-004-0370-0) [DOI] [Google Scholar]
- 2.Galloway JN, Aber JD, Erisman JW, Seitzinger SP, Howarth RW, Cowling EB, Cosby BJ. 2003. The nitrogen cascade. BioScience 53, 341–356 10.1641/0006-3568(2003)053[0341:TNC]2.0.CO;2 (doi:10.1641/0006-3568(2003)053[0341:TNC]2.0.CO;2) [DOI] [Google Scholar]
- 3.Wayne RP. 1991. Chemistry of atmospheres, 2nd edn Oxford, UK: Clarendon Press [Google Scholar]
- 4.Isaksen ISA, et al. 2009. Atmospheric composition change: climate–chemistry interactions. Atmos. Environ. 43, 5138–5192 10.1016/j.atmosenv.200908003 (doi:10.1016/j.atmosenv.200908003) [DOI] [Google Scholar]
- 5.Erisman JW, Sutton MA, Galloway J, Klimont Z, Winiwarter W. 2008. How a century of ammonia synthesis changed the world. Nat. Geosci. 1, 636–639 10.1038/ngeo325 (doi:10.1038/ngeo325) [DOI] [Google Scholar]
- 6.Smil V. 2001. Enriching the earth. Fritz Haber, Carl Bosch, and the transformation of world food production. Cambridge, MA: The MIT Press [Google Scholar]
- 7.Sprent IJ. 1987. The Ecology of the nitrogen cycle. Cambridge, UK: Cambridge University Press [Google Scholar]
- 8.Erisman JW, Galloway JN, Seitzinger S, Bleeker A, Dise NB, Petrescu AMR, Leach AM, de Vries W. 2013. Consequences of human modification of the global nitrogen cycle. Phil. Trans. R. Soc. B 368, 20130116. 10.1098/rstb.2013.0116 (doi:10.1098/rstb.2013.0116) [DOI] [PMC free article] [PubMed] [Google Scholar]
- 9.Stevenson DS, et al. 2006. Multimodel ensemble simulations of present-day and near-future tropospheric ozone. J. Geophys. Res. Atmos. 111 10.1029/2005JD006338 (doi:10.1029/2005JD006338) [DOI] [Google Scholar]
- 10.Monks PS, et al. 2009. Atmospheric composition change: global and regional air quality. Atmos. Environ. 43, 5268–5350 10.1016/j.atmosenv.2009年08月02日1 (doi:10.1016/j.atmosenv.2009年08月02日1) [DOI] [Google Scholar]
- 11.Brunekreef B, Holgate ST. 2002. Air pollution and health. Lancet 360, 1233–1242 10.1016/S0140-6736(02)11274-8 (doi:10.1016/S0140-6736(02)11274-8) [DOI] [PubMed] [Google Scholar]
- 12.Dise NB, et al. 2011. Nitrogen as a threat to European terrestrial biodiversity. In The European nitrogen assessment (eds Sutton MA, Howard CM, Erisman JW, Billen G, Bleeker A, Greenfelt P, Van Grinsven H, Grizzetti B.), pp. 463–494 Cambridge, UK: Cambridge University Press [Google Scholar]
- 13.Van Dingenen R, Dentener FJ, Raes F, Krol MC, Emberson L, Cofala J. 2009. The global impact of ozone on agricultural crop yields under current and future air quality legislation. Atmos. Environ. 43, 604–618 10.1016/j.atmosenv.2008年10月03日3 (doi:10.1016/j.atmosenv.2008年10月03日3) [DOI] [Google Scholar]
- 14.Galloway JN, Leach AM, Bleeker A, Erisman JW. 2013. A chronology of human understanding of the nitrogen cycle. Phil. Trans. R. Soc. B 368, 20130120. 10.1098/rstb.2013.0120 (doi:10.1098/rstb.2013.0120) [DOI] [PMC free article] [PubMed] [Google Scholar]
- 15.Vitousek PM, et al. 2002. Towards an ecological understanding of biological nitrogen fixation. Biogeochemistry 57, 1–45 10.1023/A:1015798428743 (doi:10.1023/A:1015798428743) [DOI] [Google Scholar]
- 16.Vitousek PM, Menge DNL, Reed SC, Cleveland CC. 2013. Biological nitrogen fixation: rates, patterns, and ecological controls in terrestrial ecosystems. Phil. Trans. R. Soc. B 368, 20130119. 10.1098/rstb.2013.0119 (doi:10.1098/rstb.2013.0119) [DOI] [PMC free article] [PubMed] [Google Scholar]
- 17.Voss M, Bange HW, Dippner JW, Middelburg JJ, Montoya JP, Ward B. 2013. The marine nitrogen cycle: recent discoveries, uncertainties and the potential relevance of climate change. Phil. Trans. R. Soc. B 368, 20130121. 10.1098/rstb.2013.0121 (doi:10.1098/rstb.2013.0121) [DOI] [PMC free article] [PubMed] [Google Scholar]
- 18.Gruber N, Galloway JN. 2008. An Earth-system perspective of the global nitrogen cycle. Nature 451, 293–296 10.1038/nature06592 (doi:10.1038/nature06592) [DOI] [PubMed] [Google Scholar]
- 19.Berman-Frank I, Quigg A, Finkel ZV, Irwin AJ, Haramaty L. 2007. Nitrogen-fixation strategies and Fe requirements in cyanobacteria. Limnol. Oceanogr. 52, 2260–2269 10.4319/lo.2007525.2260 (doi:10.4319/lo.2007525.2260) [DOI] [Google Scholar]
- 20.Gruber N, Sarmiento J. 1997. Global patterns of marine nitrogen fixation and denitrification. Glob. Biogeochem. Cycle 11, 235–266 10.1029/97GB00077 (doi:10.1029/97GB00077) [DOI] [Google Scholar]
- 21.Duce RA, et al. 2008. Impacts of atmospheric anthropogenic nitrogen on the open ocean. Science 320, 893–897 10.1126/science.1150369 (doi:10.1126/science.1150369) [DOI] [PubMed] [Google Scholar]
- 22.Canfield DE, Glazer AN, Falkowski PG. 2010. The evolution and future of Earth's nitrogen cycle. Science 330, 192–196 10.1126/science.1186120 (doi:10.1126/science.1186120) [DOI] [PubMed] [Google Scholar]
- 23.Brasseur GP, Schultz M, Granier C, Saunois M, Diehl T, Botzet M, Roeckner E, Walters S. 2006. Impact of climate change on the future chemical composition of the global troposphere. J. Clim. 19, 3932–3951 10.1175/JCLI3832.1 (doi:10.1175/JCLI3832.1) [DOI] [Google Scholar]
- 24.Levy H, Moxim WJ, Kasibhatla PS. 1996. A global three-dimensional time-dependent lightning source of tropospheric NOx. J. Geophys. Res. Atmos. 101, 22 911–22 922 10.1029/96JD02341 (doi:10.1029/96JD02341) [DOI] [Google Scholar]
- 25.Tie XX, Zhang RY, Brasseur G, Lei WF. 2002. Global NOx production by lightning. J. Atmos. Chem. 43, 61–74 10.1023/A:1016145719608 (doi:10.1023/A:1016145719608) [DOI] [Google Scholar]
- 26.Cape JN, Anderson M, Rowland AP, Wilson D. 2004. Organic nitrogen in precipitation across the United Kingdom. Water Air Soil Pollut. Focus 4, 25–35 10.1007/s11267-004-3010-8 (doi:10.1007/s11267-004-3010-8) [DOI] [Google Scholar]
- 27.Jickells T, Baker AR, Cape JN, Cornell SE, Nemitz E. 2013. The cycling of organic nitrogen through the atmosphere. Phil. Trans. R. Soc. B 368, 20130115. 10.1098/rstb.2013.0115 (doi:10.1098/rstb.2013.0115) [DOI] [PMC free article] [PubMed] [Google Scholar]
- 28.Herridge DF, Peoples MB, Boddey RM. 2008. Global inputs of biological nitrogen fixation in agricultural systems. Plant Soil 311, 1–18 10.1007/s11104-008-9668-3 (doi:10.1007/s11104-008-9668-3) [DOI] [Google Scholar]
- 29.Lamarque JF, et al. 2010. Historical (1850–2000) gridded anthropogenic and biomass burning emissions of reactive gases and aerosols: methodology and application. Atmos. Chem. Phys. 10, 7017–7039 10.5194/acp-10-7017-2010 (doi:10.5194/acp-10-7017-2010) [DOI] [Google Scholar]
- 30.Firestone MK, Davidson EA. 1989. Microbial basis of NO and N2O production and consumption in soil. In Exchange of trace gases between terrestrial ecosystems and the atmosphere: report of the Dahlem Workshop on Exchange of Trace Gases between Terrestrial Ecosystems and the Atmosphere, Berlin, Germany 19–24 February 1989 (eds Andreae MO, Schimel DS, Robertson GP.), pp. 7–21 Chichester, UK: John Wiley & Sons. [Google Scholar]
- 31.Skiba U, Smith KA, Fowler D. 1993. Nitrification and denitrification as sources of nitric oxide and nitrous oxide in a sandy loam soil. Soil Biol. Biochem. 25, 1527–1536 10.1016/0038-0717(93)90007-X (doi:10.1016/0038-0717(93)90007-X) [DOI] [Google Scholar]
- 32.Butterbach-Bahl K, Baggs EM, Dannenmann M, Kiese R, Zechmeister-Boltenstern S. 2013. Nitrous oxide emissions from soils: how well do we understand the processes and their controls? Phil. Trans. R. Soc. B 368, 20130122. 10.1098/rstb.2013.0122 (doi:10.1098/rstb.2013.0122) [DOI] [PMC free article] [PubMed] [Google Scholar]
- 33.Pilegaard K. 2013. Processes regulating nitric oxide emissions from soils. Phil. Trans. R. Soc. B 368, 20130126. 10.1098/rstb.2013.0126 (doi:10.1098/rstb.2013.0126) [DOI] [PMC free article] [PubMed] [Google Scholar]
- 34.Granier C, et al. 2011. Evolution of anthropogenic and biomass burning emissions of air pollutants at global and regional scales during the 1980–2010 period. Clim. Change 109, 163–190 10.1007/s10584-011-0154-1 (doi:10.1007/s10584-011-0154-1) [DOI] [Google Scholar]
- 35.van Vuuren DP, Bouwman LF, Smith SJ, Dentener F. 2011. Global Projections for anthropogenic reactive nitrogen emissions to the atmosphere: an assessment of scenarios in the scientific literature. Curr. Opin. Environ. Sustain. 3, 359–369 10.1016/j.cosust.2011年08月01日4 (doi:10.1016/j.cosust.2011年08月01日4) [DOI] [Google Scholar]
- 36.Galloway JN, Townsend AR, Erisman JW, Bekunda M, Cai Z, Freney JR, Martinelli LA, Seitzinger SP, Sutton MA. 2008. Transformation of the nitrogen cycle: recent trends, questions, and potential solutions. Science 320, 889–892 10.1126/science.1136674 (doi:10.1126/science.1136674) [DOI] [PubMed] [Google Scholar]
- 37.Leach AM, Galloway JN, Bleeker A, Erisman JW, Kohn R, Kitzes J. 2012. A nitrogen footprint model to help consumers understand their role in nitrogen losses to the environment. Environ. Dev. 1, 40–66 10.1016/j.envdev.201112005 (doi:10.1016/j.envdev.201112005) [DOI] [Google Scholar]
- 38.Sutton MA, Schjorring JK, Wyers GP. 1995. Plant-atmosphere exchange of ammonia. Phil. Trans. R. Soc. A 351, 261–276 10.1098/rsta.1995.0033 (doi:10.1098/rsta.1995.0033) [DOI] [Google Scholar]
- 39.IPCC 2007. Climate change 2007: the physical science basis. Contribution of Working Group I to the Fourth Assessment Report of the Intergovernmental Panel on Climate Change. Cambridge, UK: Cambridge University Press [Google Scholar]
- 40.Flechard CR, Fowler D. 1998. Atmospheric ammonia at a moorland site. I: the meteorological control of ambient ammonia concentrations and the influence of local sources. Q. J. R. Meteorol. Soc. 124, 733–757 10.1002/qj.49712454705 (doi:10.1002/qj.49712454705) [DOI] [Google Scholar]
- 41.Sutton MA, et al. 2013. Towards a climate-dependent paradigm of ammonia emission and deposition. Phil. Trans. R. Soc. B 368, 20130166. 10.1098/rstb.2013.0166 (doi:10.1098/rstb.2013.0166) [DOI] [PMC free article] [PubMed] [Google Scholar]
- 42.Bouwman L, Goldewijk KK, Van Der Hoek KW, Beusen AHW, Van Vuuren DP, Willems J, Rufino MC, Stehfest E. In press. Exploring global changes in nitrogen and phosphorus cycles in agriculture induced by livestock production over the 1900–2050 period. Proc. Natl Acad. Sci. USA (doi:10.1073/pnas.1012878108) [DOI] [PMC free article] [PubMed] [Google Scholar]
- 43.Ganzeveld LN, Lelieveld J, Dentener FJ, Krol MC, Bouwman AJ, Roelofs GJ. 2002. Global soil-biogenic NOx emissions and the role of canopy processes. J. Geophys. Res. Atmos. 107, 4298. 10.1029/2001JD001289 (doi:10.1029/2001JD001289) [DOI] [Google Scholar]
- 44.Bouwman AF, et al. 2013. Global trends and uncertainties in terrestrial denitrification and N2O emissions. Phil. Trans. R. Soc. B 368, 20130112. 10.1098/rstb.2013.0112 (doi:10.1098/rstb.2013.0112) [DOI] [PMC free article] [PubMed] [Google Scholar]
- 45.Dentener F, et al. 2006. Nitrogen and sulfur deposition on regional and global scales: a multimodel evaluation. Glob. Biogeochem. Cycle 20, GB4003. 10.1029/2005GB002672 (doi:10.1029/2005GB002672) [DOI] [Google Scholar]
- 46.Voss M, et al. 2011. Nitrogen processes in coastal and marine systems. In The European nitrogen assessment (eds Sutton MA, Howard CM, Erisman JW, Billen G, Bleeker A, Greenfelt P, Van Grinsven H, Grizzetti B.), pp. 147–176 Cambridge, UK: Cambridge University Press [Google Scholar]
- 47.Deutsch C, Sarmiento JL, Sigman DM, Gruber N, Dunne JP. 2007. Spatial coupling of nitrogen inputs and losses in the ocean. Nature 445, 163–167 10.1038/nature05392 (doi:10.1038/nature05392) [DOI] [PubMed] [Google Scholar]
- 48.Royal Society 2008. Ground-level ozone in the 21st century: future trends, impacts and policy implications. Science Policy Report 15/08. London, UK: The Royal Society
- 49.Sitch S, Cox PM, Collins WJ, Huntingford C. 2007. Indirect radiative forcing of climate change through ozone effects on the land-carbon sink. Nature 448, 791–794 10.1038/nature06059 (doi:10.1038/nature06059) [DOI] [PubMed] [Google Scholar]
- 50.Shindell D, et al. 2012. Simultaneously mitigating near-term climate change and improving human health and food security. Science 335, 183–189 10.1126/science.1210026 (doi:10.1126/science.1210026) [DOI] [PubMed] [Google Scholar]
- 51.Stevens CJ, et al. 2011. The impact of nitrogen deposition on acid grasslands in the Atlantic region of Europe. Environ. Pollut. 159, 2243–2250 10.1016/j.envpol.2010年11月02日6 (doi:10.1016/j.envpol.2010年11月02日6) [DOI] [PubMed] [Google Scholar]
- 52.Dentener FJ, Crutzen PJ. 1994. A three-dimensional model of the global ammonia cycle. J. Atmos. Chem. 19, 331–369 10.1007/BF00694492 (doi:10.1007/BF00694492) [DOI] [Google Scholar]
- 53.Fiore AM, et al. 2012. Global air quality and climate. Chem. Soc. Rev. 41, 6663–6683 10.1039/c2cs35095e (doi:10.1039/c2cs35095e) [DOI] [PubMed] [Google Scholar]
- 54.Choularton TW, Gay MJ, Jones A, Fowler D, Cape JN, Leith ID. 1988. The influence of altitude on wet deposition comparison between field measurements at Great Dun Fell and the predictions of a seeder–feeder model. Atmos. Environ. 22, 1363–1371 10.1016/0004-6981(88)90161-8 (doi:10.1016/0004-6981(88)90161-8) [DOI] [Google Scholar]
- 55.Wesely ML. 1989. Parameterization of surface resistance to gaseous dry deposition in regional-scale numerical models. Atmos. Environ. 23, 1293–1304 10.1016/0004-6981(89)90153-4 (doi:10.1016/0004-6981(89)90153-4) [DOI] [Google Scholar]
- 56.Fowler D. 2009. Atmospheric composition change: ecosystems–atmosphere interactions. Atmos. Environ. 43, 5193–5267 10.1016/j.atmosenv.2009年07月06日8 (doi:10.1016/j.atmosenv.2009年07月06日8) [DOI] [Google Scholar]
- 57.Richter A, Burrows JP, Nuss H, Granier C, Niemeier U. 2005. Increase in tropospheric nitrogen dioxide over China observed from space. Nature 437, 129–132 10.1038/nature04092 (doi:10.1038/nature04092) [DOI] [PubMed] [Google Scholar]
- 58.Van Noije TPC, et al. 2006. Multi-model ensemble simulations of tropospheric NO2 compared with GOME retrievals for the year 2000. Atmos. Chem. Phys. 6, 2943–2979 10.5194/acp-6-2943-2006 (doi:10.5194/acp-6-2943-2006) [DOI] [Google Scholar]
- 59.Clarisse L, Clerbaux C, Dentener F, Hurtmans D, Coheur PF. 2009. Global ammonia distribution derived from infrared satellite observations. Nat. Geosci. 2, 479–483 10.1038/ngeo551 (doi:10.1038/ngeo551) [DOI] [Google Scholar]
- 60.Wilson RC, Fleming ZL, Monks PS, Clain G, Henne S, Konovalov IB, Szopa S, Menut L. 2012. Have primary emission reduction measures reduced ozone across Europe? An analysis of European rural background ozone trends 1996–2005. Atmos. Chem. Phys. 12, 437–454 10.5194/acp-12-437-2012 (doi:10.5194/acp-12-437-2012) [DOI] [Google Scholar]
- 61.Simpson D, Fagerli H, Hellsten S, Knulst J, Westling O. 2006. Comparison of modeled and monitored deposition fluxes of sulphur and nitrogen to ICP-forest sites in Europe. Biogeosciences 3, 337–355 10.5194/bg-3-337-2006 (doi:10.5194/bg-3-337-2006) [DOI] [Google Scholar]
- 62.Dennis RL, Schwede DB, Bash JO, Pleim JE, Walker JT, Foley KM. 2013. Sensitivity of continental United States atmospheric budgets of oxidized and reduced nitrogen to dry deposition parametrizations. Phil. Trans. R. Soc. B 368, 20130124. 10.1098/rstb.2013.0124 (doi:10.1098/rstb.2013.0124) [DOI] [PMC free article] [PubMed] [Google Scholar]
- 63.Flechard CR, Fowler D, Sutton MA, Cape JN. 1999. A dynamic chemical model of bi-directional ammonia exchange between semi-natural vegetation and the atmosphere. Q. J. R. Meteorol. Soc. 125, 1–33 10.1002/qj.49712555914 (doi:10.1002/qj.49712555914) [DOI] [Google Scholar]
- 64.Skiba U, Pitcairn C, Sheppard LJ, Kennedy V, Fowler D. 2004. The influence of atmospheric N deposition on nitrous oxide and nitric oxide fluxes and soil ammonium and nitrate concentrations. Water Air Soil Pollut. Focus 4, 37–43 10.1007/s11267-005-3011-2 (doi:10.1007/s11267-005-3011-2) [DOI] [Google Scholar]
- 65.Skiba U. 2012. UK emissions of the greenhouse gas nitrous oxide. Phil. Trans. R. Soc B 367, 1175–1185 10.1098/rstb.2011.0356 (doi:10.1098/rstb.2011.0356) [DOI] [PMC free article] [PubMed] [Google Scholar]
- 66.Billen G, Garnier J, Lassaletta L. 2013. The nitrogen cascade from agricultural soils to the sea: modelling nitrogen transfers at regional watershed and global scales . Phil. Trans. R. Soc. B 368, 20130123. 10.1098/rstb.2013.0123 (doi:10.1098/rstb.2013.0123) [DOI] [PMC free article] [PubMed] [Google Scholar]
- 67.Pitcairn CER, Leith ID, Sheppard LJ, Sutton MA, Fowler D, Munro RC, Tang S, Wilson D. 1998. The relationship between nitrogen deposition, species composition and foliar nitrogen concentrations in woodland flora in the vicinity of livestock farms. Environ. Pollut. 102, 41–48 10.1016/S0269-7491(98)80013-4 (doi:10.1016/S0269-7491(98)80013-4) [DOI] [Google Scholar]
- 68.Stevens CJ, et al. 2010. Nitrogen deposition threatens species richness of grasslands across Europe. Environ. Pollut. 158, 2940–2945 10.1016/j.envpol.201006006 (doi:10.1016/j.envpol.201006006) [DOI] [PubMed] [Google Scholar]
- 69.Sutton MA, Howard CM, Erisman JW, Billen G, Bleeker A, Grennfelt P, van Grinsven H, Grizzetti B. 2011. The European Nitrogen Assessment: sources, effects and policy perspectives. Cambridge, UK: Cambridge University Press [Google Scholar]
- 70.Howarth RW, et al. 1996. Nitrogen budgets and riverine N & P fluxes for the drainages to the North Atlantic Ocean: natural and human influences. Biogeochemistry 35, 75–139 10.1007/BF02179825 (doi:10.1007/BF02179825) [DOI] [Google Scholar]
- 71.Howden NJK, Burt TP, Worrall F, Whelan MJ, Bieroza M. 2010. Nitrate concentrations and fluxes in the River Thames over 140 years (1868–2008): are increases reversible? Hydrol. Process. 24, 2657–2662 10.1002/hyp.7835 (doi:10.1002/hyp.7835) [DOI] [Google Scholar]
- 72.Capone DG, Bronk D, Mulholland M, Carpenter EJ. (eds). 2008. Nitrogen in the marine environment, p. 1757 San Diego, CA: Academic Press [Google Scholar]
- 73.Phoenix GK, Booth RE, Leake JR, Read DJ, Grime P, Lee JA. 2003. Effects of enhanced nitrogen deposition and phosphorus limitation on nitrogen budgets of semi-natural grasslands. Glob. Change Biol. 9, 1309–1321 10.1046/j.1365-2486.2003.00660.x (doi:10.1046/j.1365-2486.2003.00660.x) [DOI] [Google Scholar]
- 74.RoTAP 2012. Review of Transboundary Air Pollution: acidification, eutrophication, ground level ozone and heavy metals in the UK. Contract report to the Department for Environment, Food and Rural Affairs. Lancaster, UK: Centre for Ecology & Hydrology [Google Scholar]
- 75.de Vries W, Solberg S, Dobbertin M, Sterba H, Laubhahn D, Reinds GJ, Nabuurs G-J, Gundersen P, Sutton MA. 2008. Ecologically implausible carbon response? Nature 451, E1–E3 10.1038/nature06579 (doi:10.1038/nature06579) [DOI] [PubMed] [Google Scholar]
- 76.de Vries W, et al. 2009. The impact of nitrogen deposition on carbon sequestration by European forests and heathlands. Forest Ecol. Manag. 258, 1814–1823 10.1016/j.foreco.2009年02月03日4 (doi:10.1016/j.foreco.2009年02月03日4) [DOI] [Google Scholar]
- 77.Reay DS, Dentener F, Smith P, Grace J, Feely RA. 2008. Global nitrogen deposition and carbon sinks. Nat. Geosci. 1, 430–437 10.1038/ngeo230 (doi:10.1038/ngeo230) [DOI] [Google Scholar]
- 78.Zaehle S. 2013. Terrestrial nitrogen–carbon cycle interactions at the global scale. Phil. Trans. R. Soc. B 368, 20130125. 10.1098/rstb.2013.0125 (doi:10.1098/rstb.2013.0125) [DOI] [PMC free article] [PubMed] [Google Scholar]
- 79.Heimann M, Reichstein M. 2008. Terrestrial ecosystem carbon dynamics and climate feedbacks. Nature 451, 289–292 10.1038/nature06591 (doi:10.1038/nature06591) [DOI] [PubMed] [Google Scholar]
- 80.Churkina G, et al. 2010. Interactions between nitrogen deposition, land cover conversion, and climate change determine the contemporary carbon balance of Europe. Biogeosciences 7, 2749–2764 10.5194/bg-7-2749-2010 (doi:10.5194/bg-7-2749-2010) [DOI] [Google Scholar]
- 81.Wolff EW. 2013. Ice sheets and nitrogen. Phil. Trans. R. Soc. B 368, 20130127. 10.1098/rstb.2013.0127 (doi:10.1098/rstb.2013.0127) [DOI] [PMC free article] [PubMed] [Google Scholar]
- 82.Stewart WDP, Rosswall T. (eds). 1982. The Nitrogen cycle. Phil. Trans. R. Soc. Lond. B 296, 299–576 [Google Scholar]
- 83.Stewart WDP. 1982. Concluding remarks. Phil. Trans. R. Soc. Lond. B 296, 575–576 10.1098/rstb.1982.0030 (doi:10.1098/rstb.1982.0030) [DOI] [Google Scholar]
- 84.Cohen AJ, et al. 2005. The global burden of disease due to outdoor air pollution. J. Toxicol. Environ. Health A 68, 1301–1307 10.1080/15287390590936166 (doi:10.1080/15287390590936166) [DOI] [PubMed] [Google Scholar]
- 85.Bobbink R, et al. 2010. Global assessment of nitrogen deposition effects on terrestrial plant diversity: a synthesis. Ecol. Appl. 20, 30–59 10.1890/08-1140.1 (doi:10.1890/08-1140.1) [DOI] [PubMed] [Google Scholar]