Sea Ice Index Daily and Monthly Image Viewer
Quick Links
Quick Links
Current data
- Arctic
- Antarctic
- Monthly
- Daily
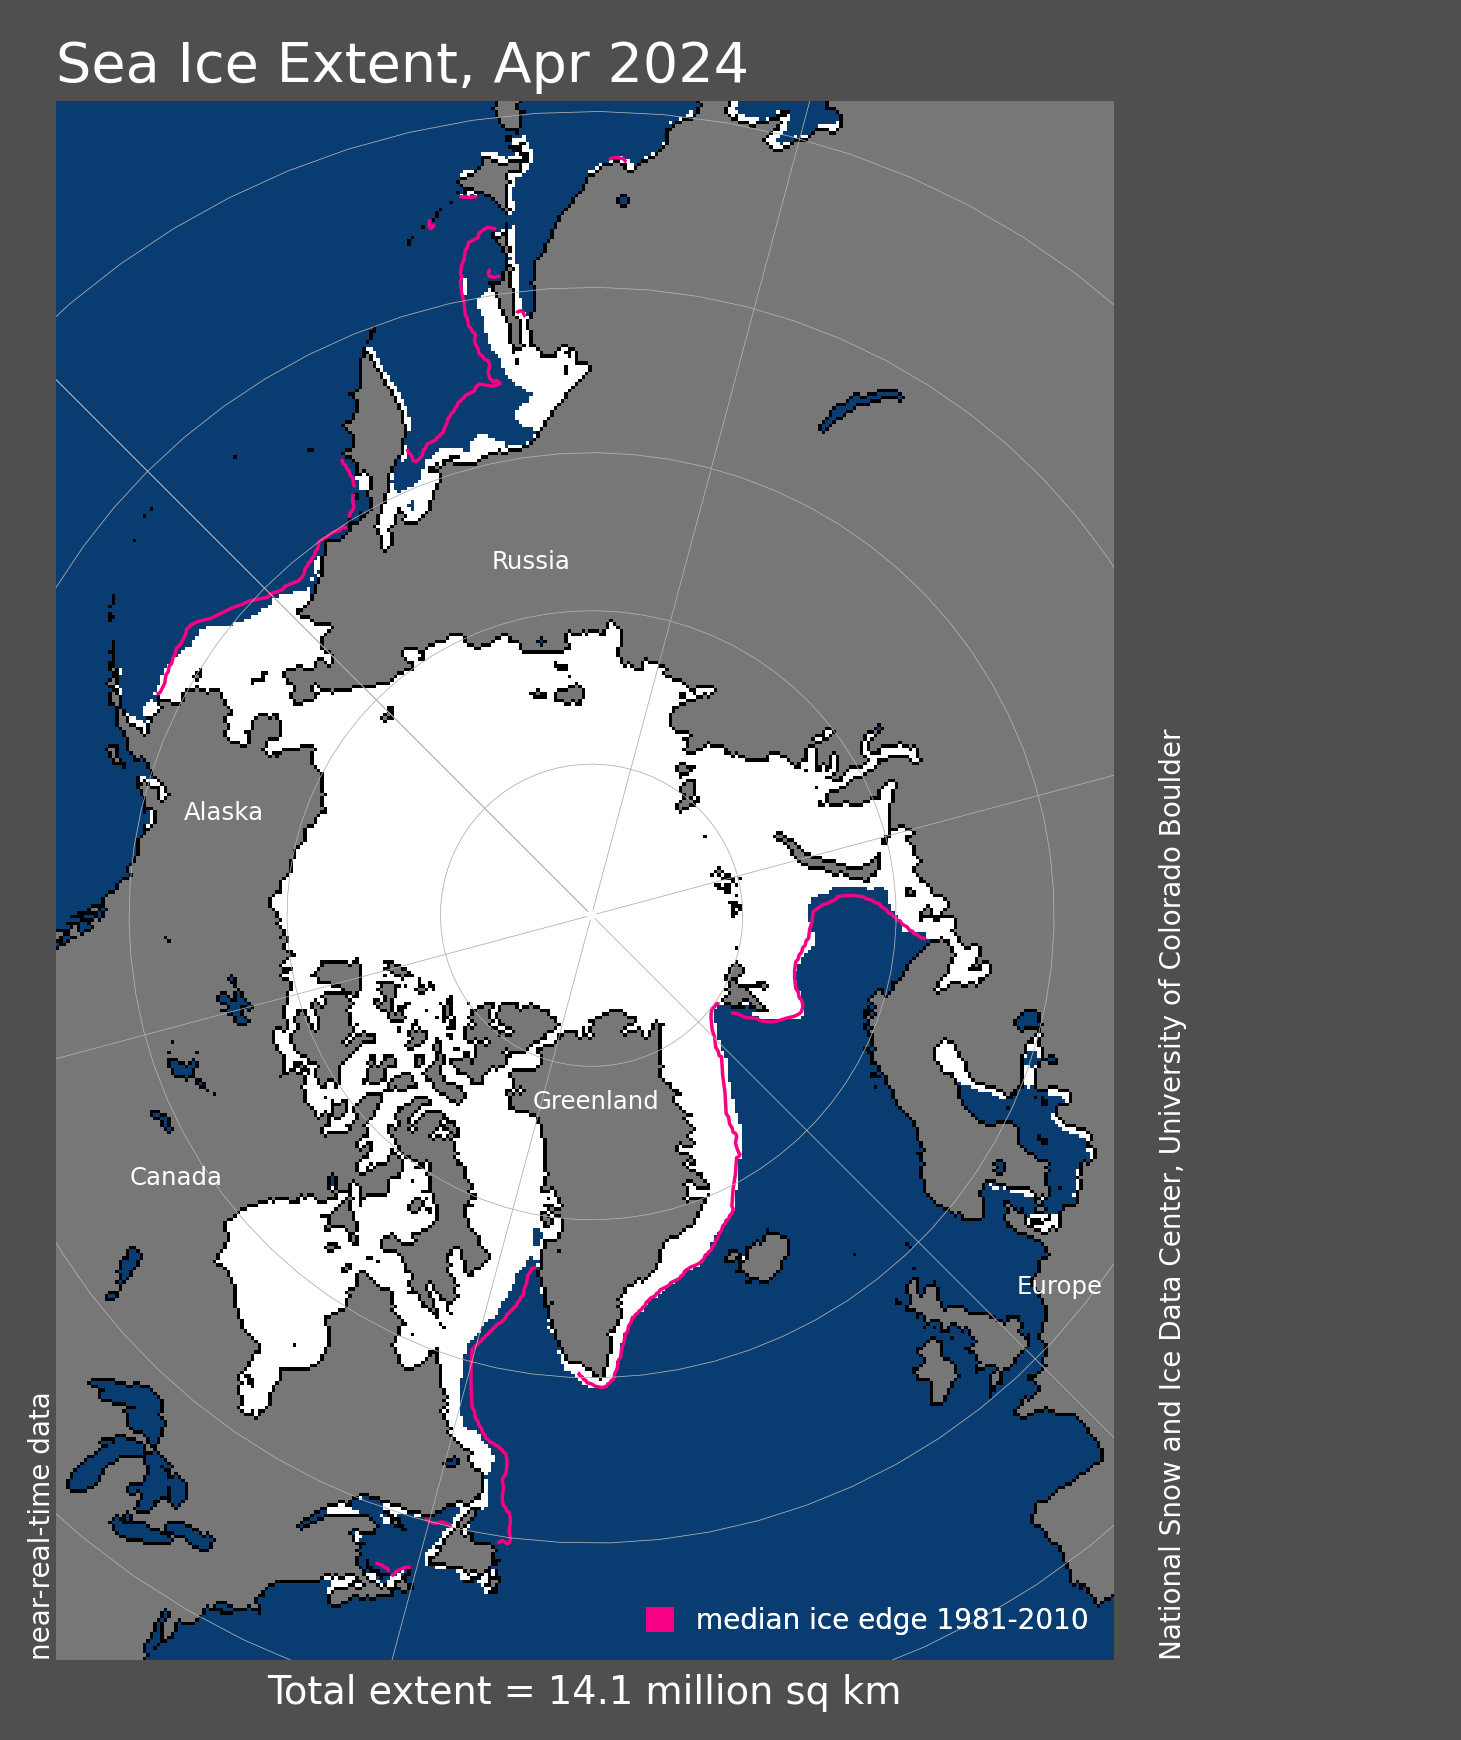
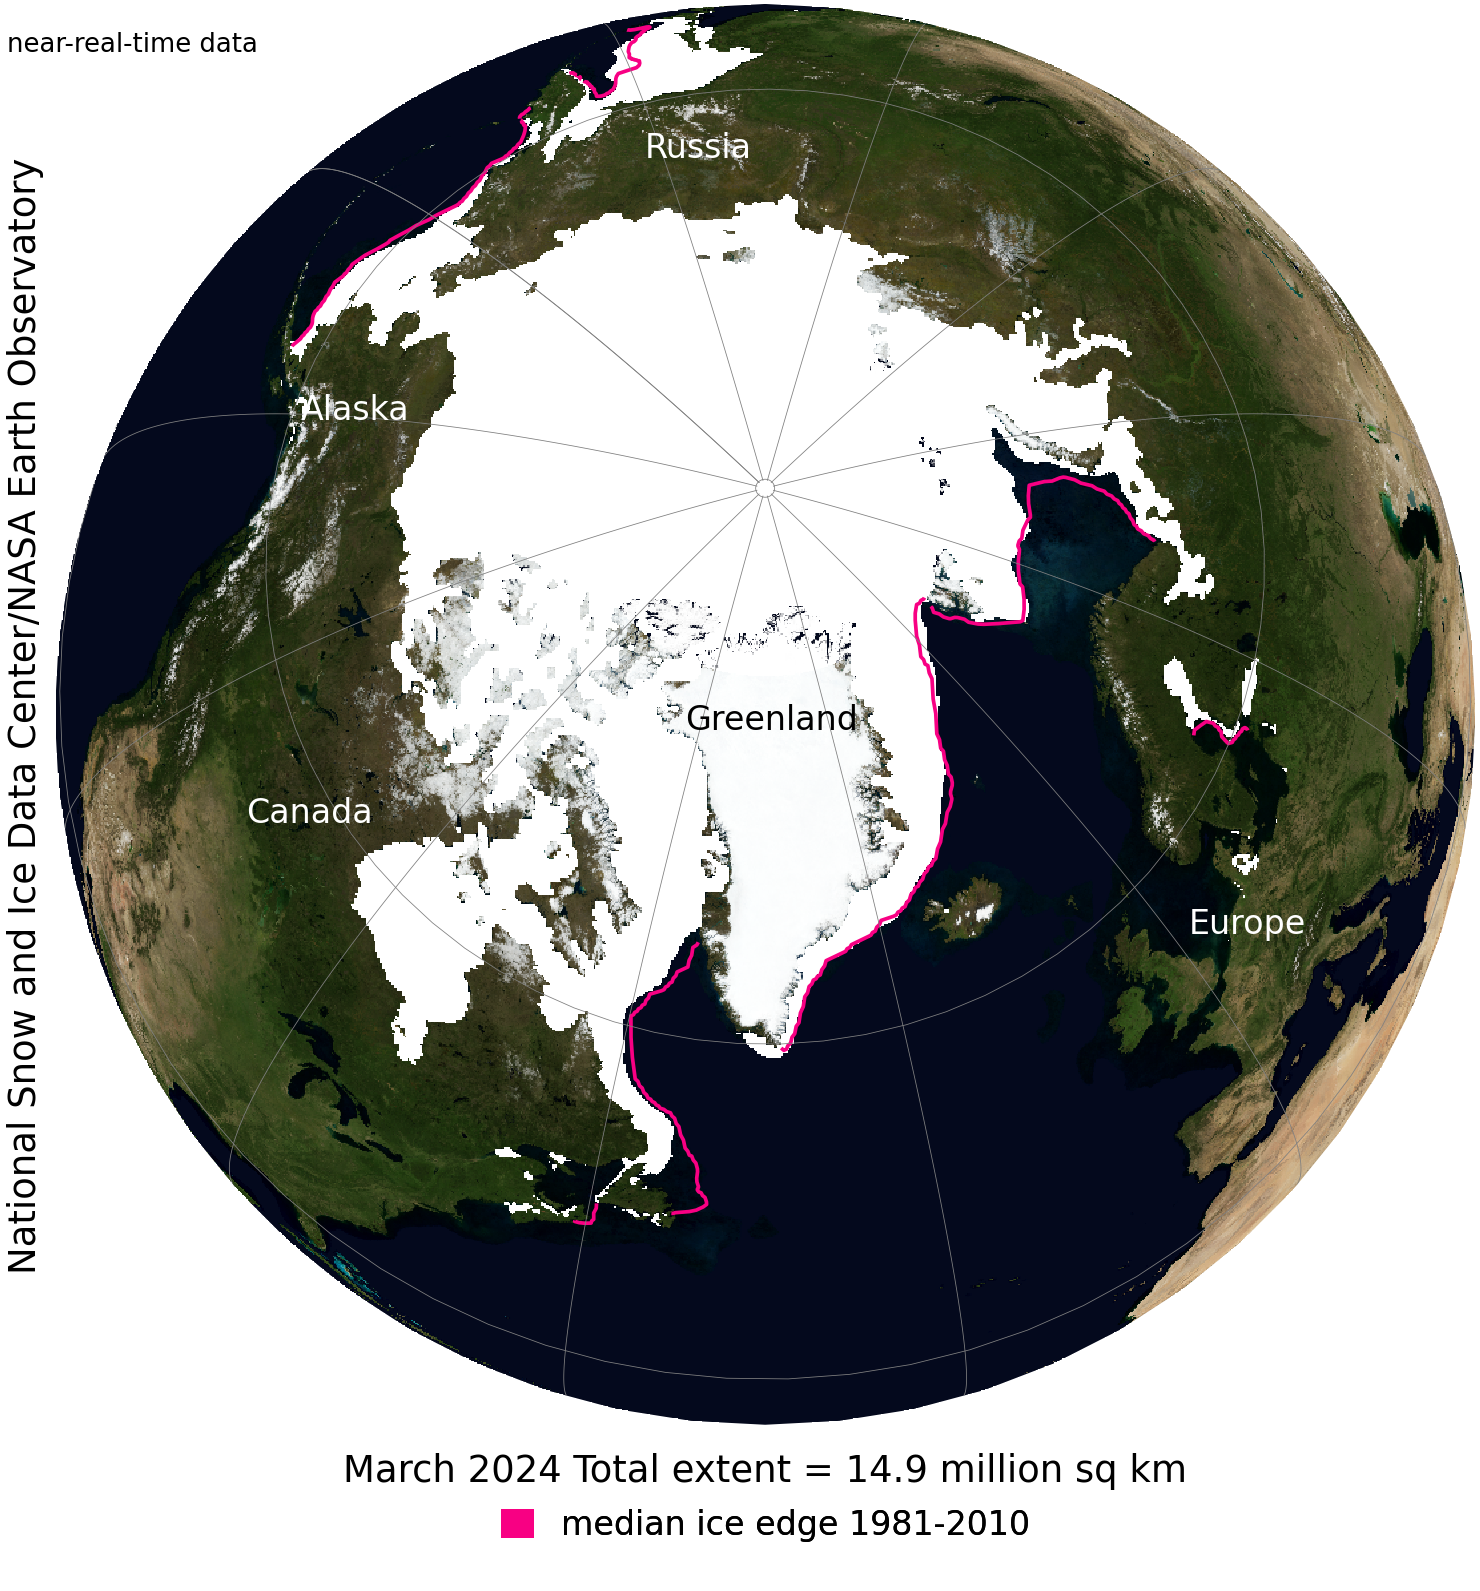
The monthly Sea Ice Index provides a quick look at Arctic-wide changes in sea ice. It is a source for consistently processed ice extent and concentration images and data values since 1979. Monthly images show sea ice extent with an outline of the 30-year (1981-2010) median extent for that month (magenta line). Other monthly images show sea ice concentration and anomalies and trends in concentration.
Monthly Sea Ice Extent Anomaly Graph
More About Monthly Images
Monthly Sea Ice Extent
The monthly extent images show the expanse covered by ice at greater than 15 percent monthly mean concentration for the Arctic and Antarctic. The total extent value is given in the bottom margin. It is derived from passive microwave data. The median line (in pink) shows a typical ice extent for that month, based on data from 1981 through 2010. The area around the North Pole that the satellite does not image is assumed to be covered by ice at more than 15 percent concentration.Monthly Sea Ice Concentration
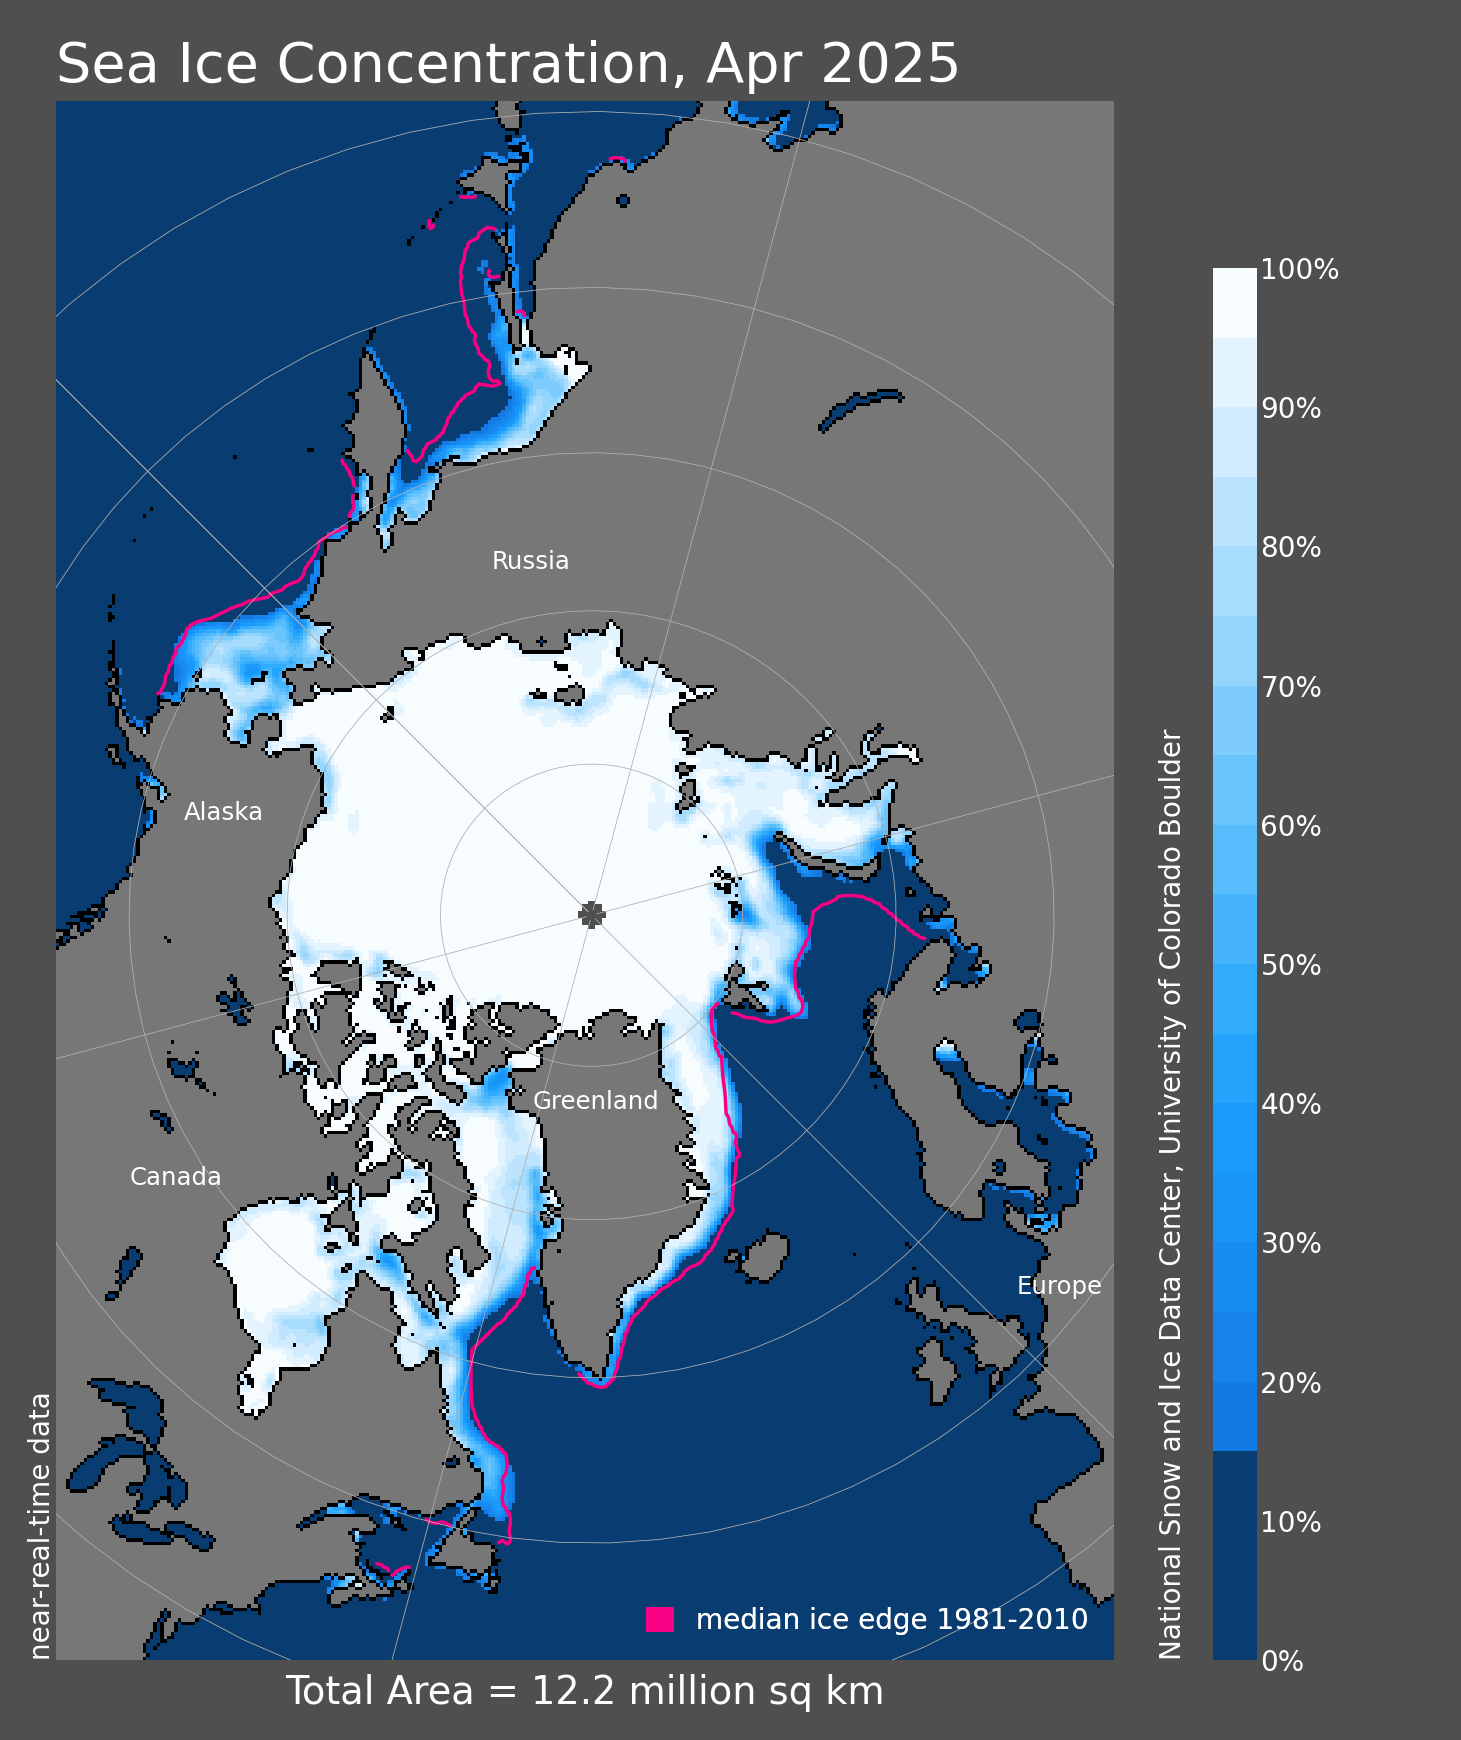
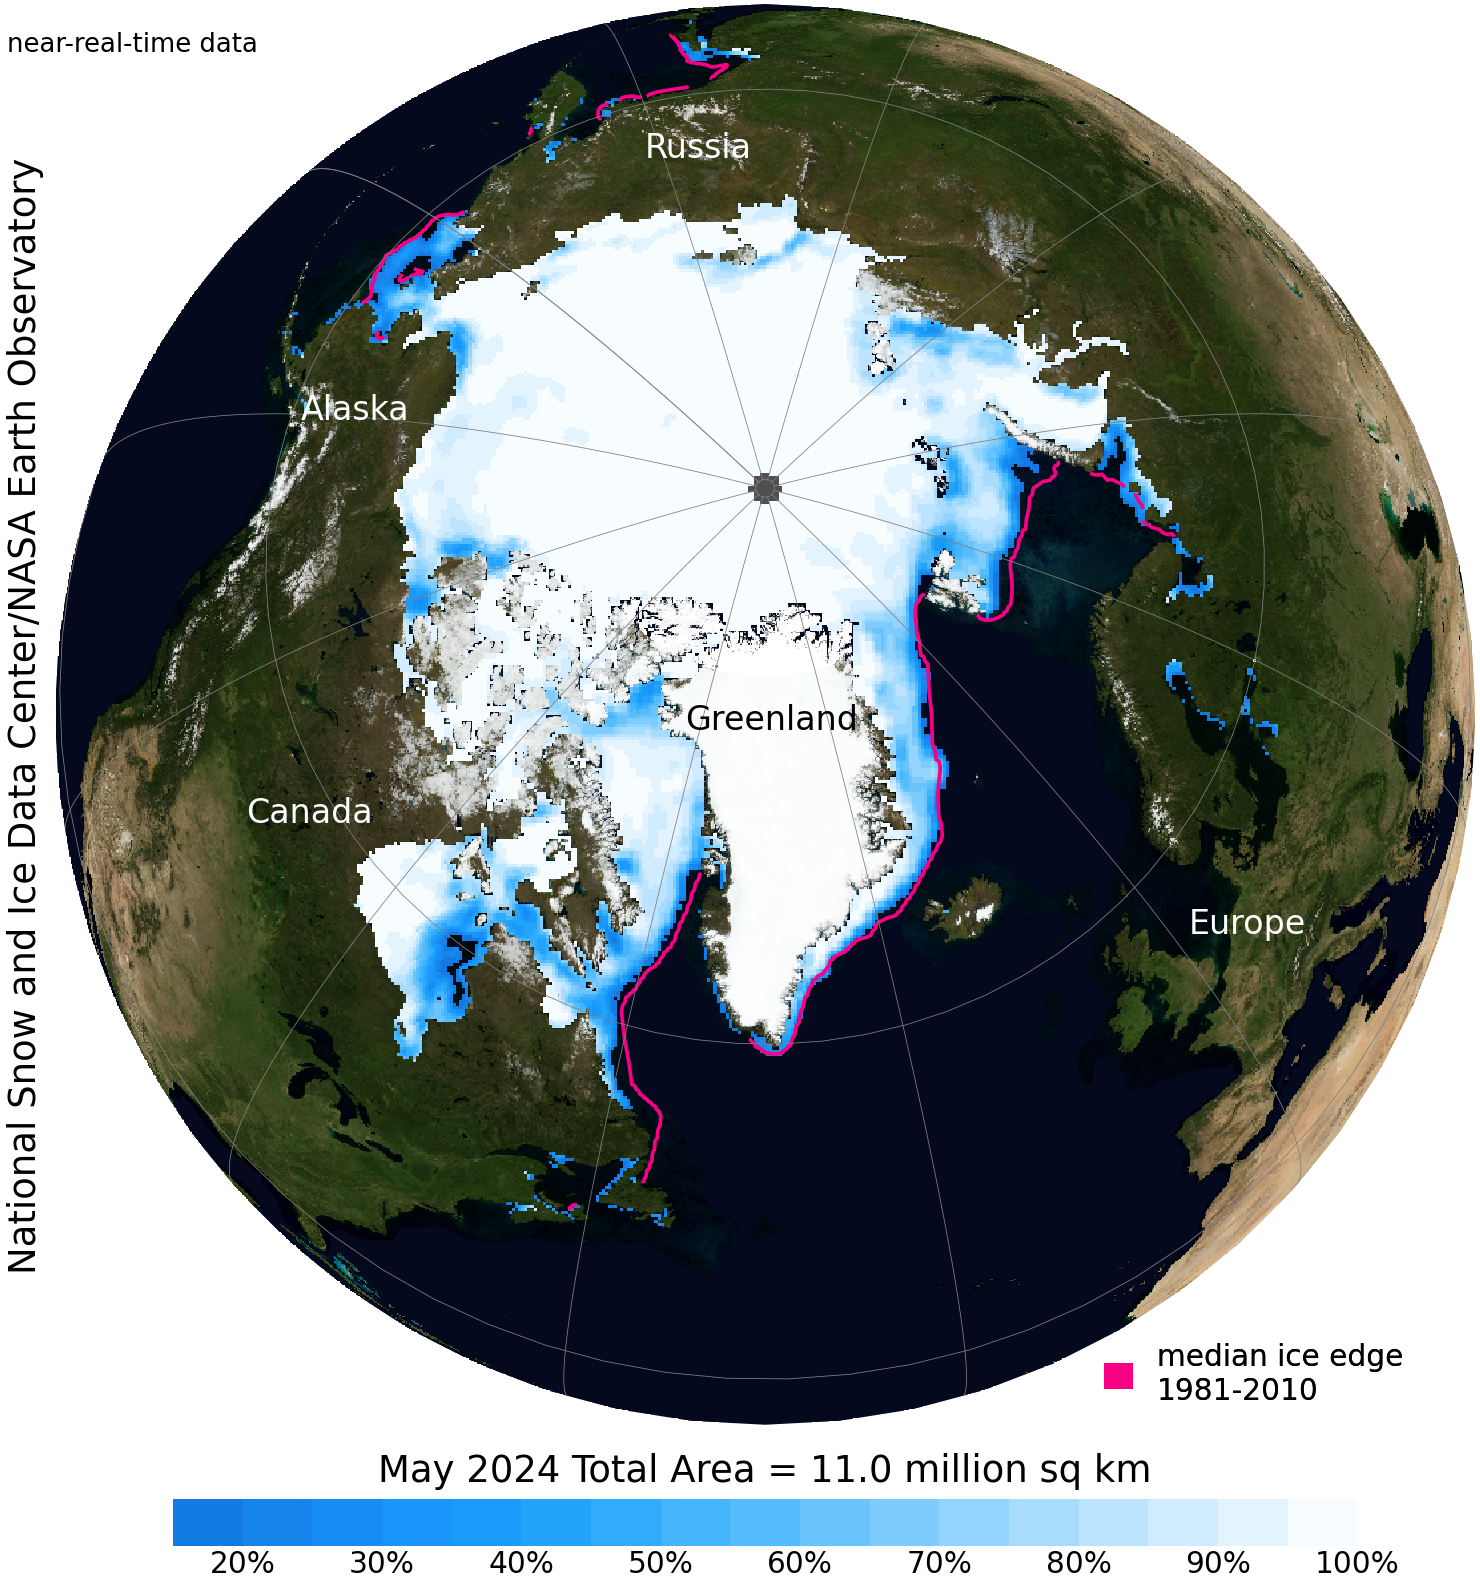
The monthly concentration images show a particular month's ice concentration with each 25 km data cell color-coded in shades of blue to white, where dark blue is zero percent ice (ocean) and white is 100 percent ice. The area around the North Pole that is not imaged by the satellite is left out of the images (dark grey circle).Monthly Sea Ice Concentration Anomaly
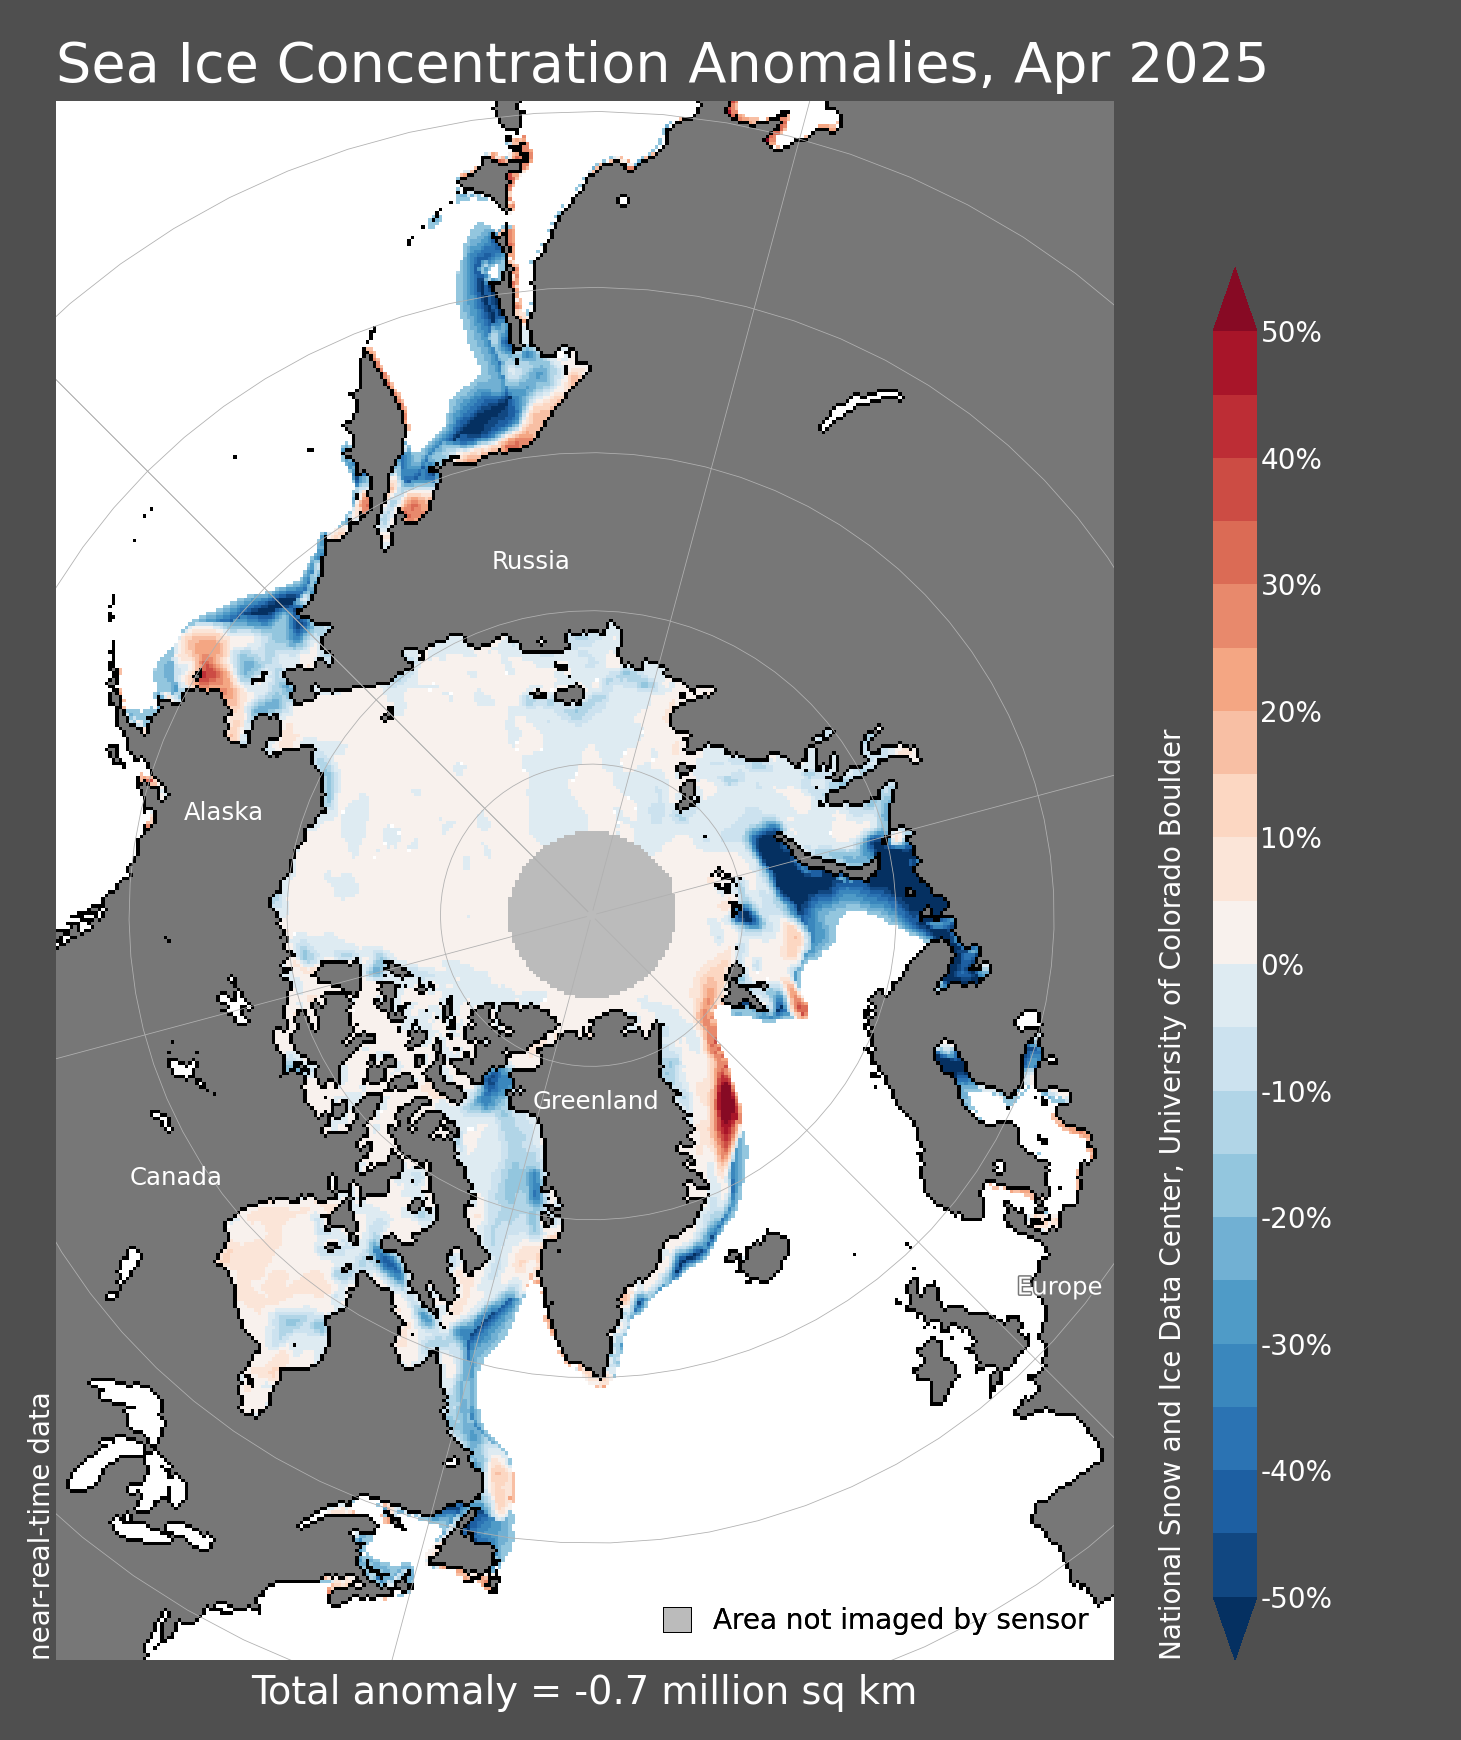
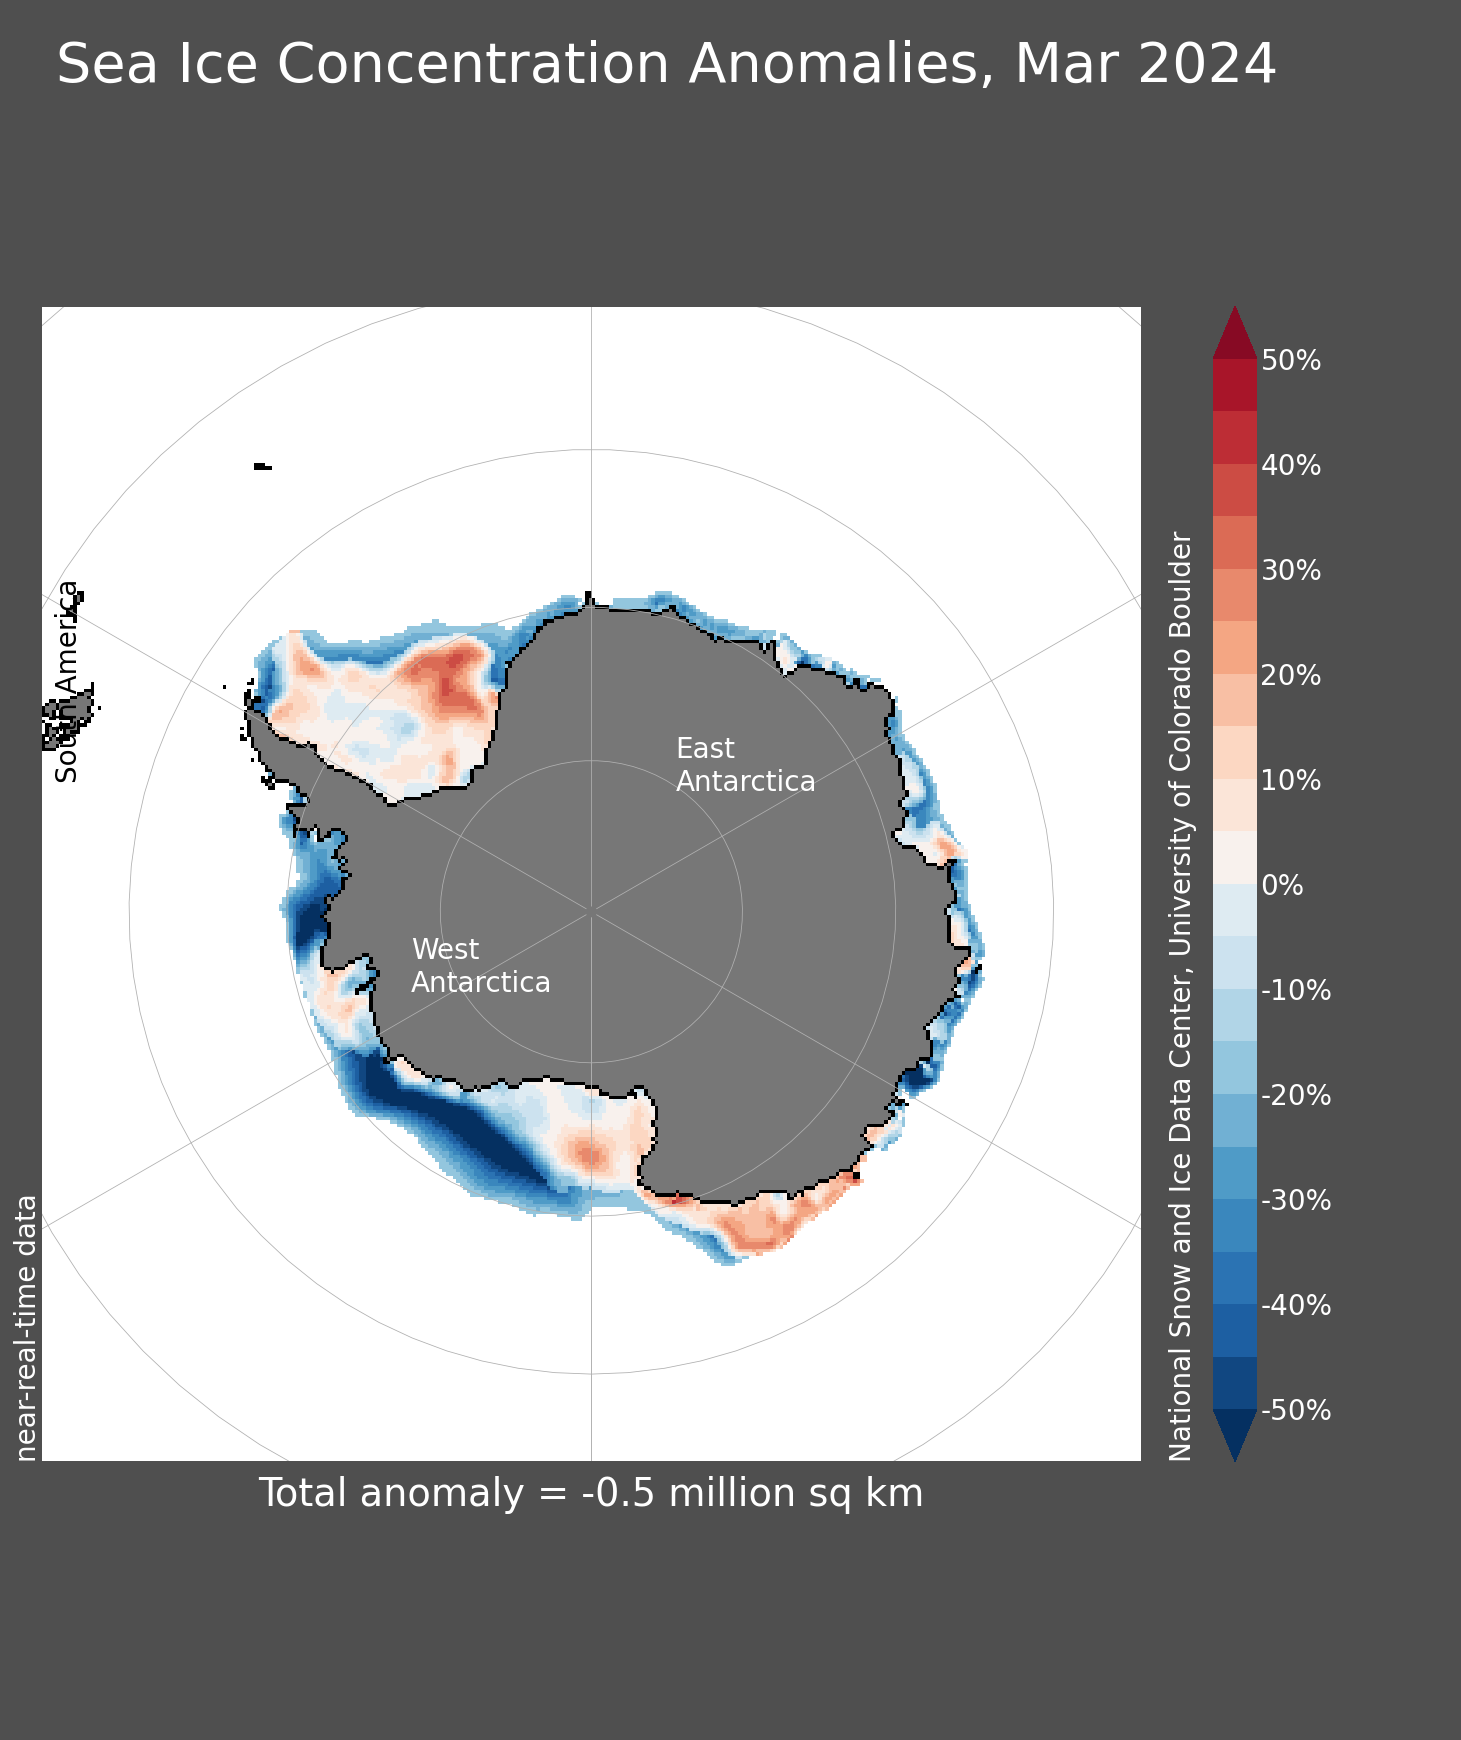
These images of anomalies in ice concentration show, in percent color-coded in shades of blue (negative anomaly) to red (positive anomaly), how much the ice concentration for a month differs from the mean calculated for that month over the 1981 through 2010 time range. The total anomalous area of sea ice for that month is also shown in the bottom margin of the image. The area around the North Pole that is not imaged by the satellite is left out of the images (light grey circle).Monthly Sea Ice Concentration Trend
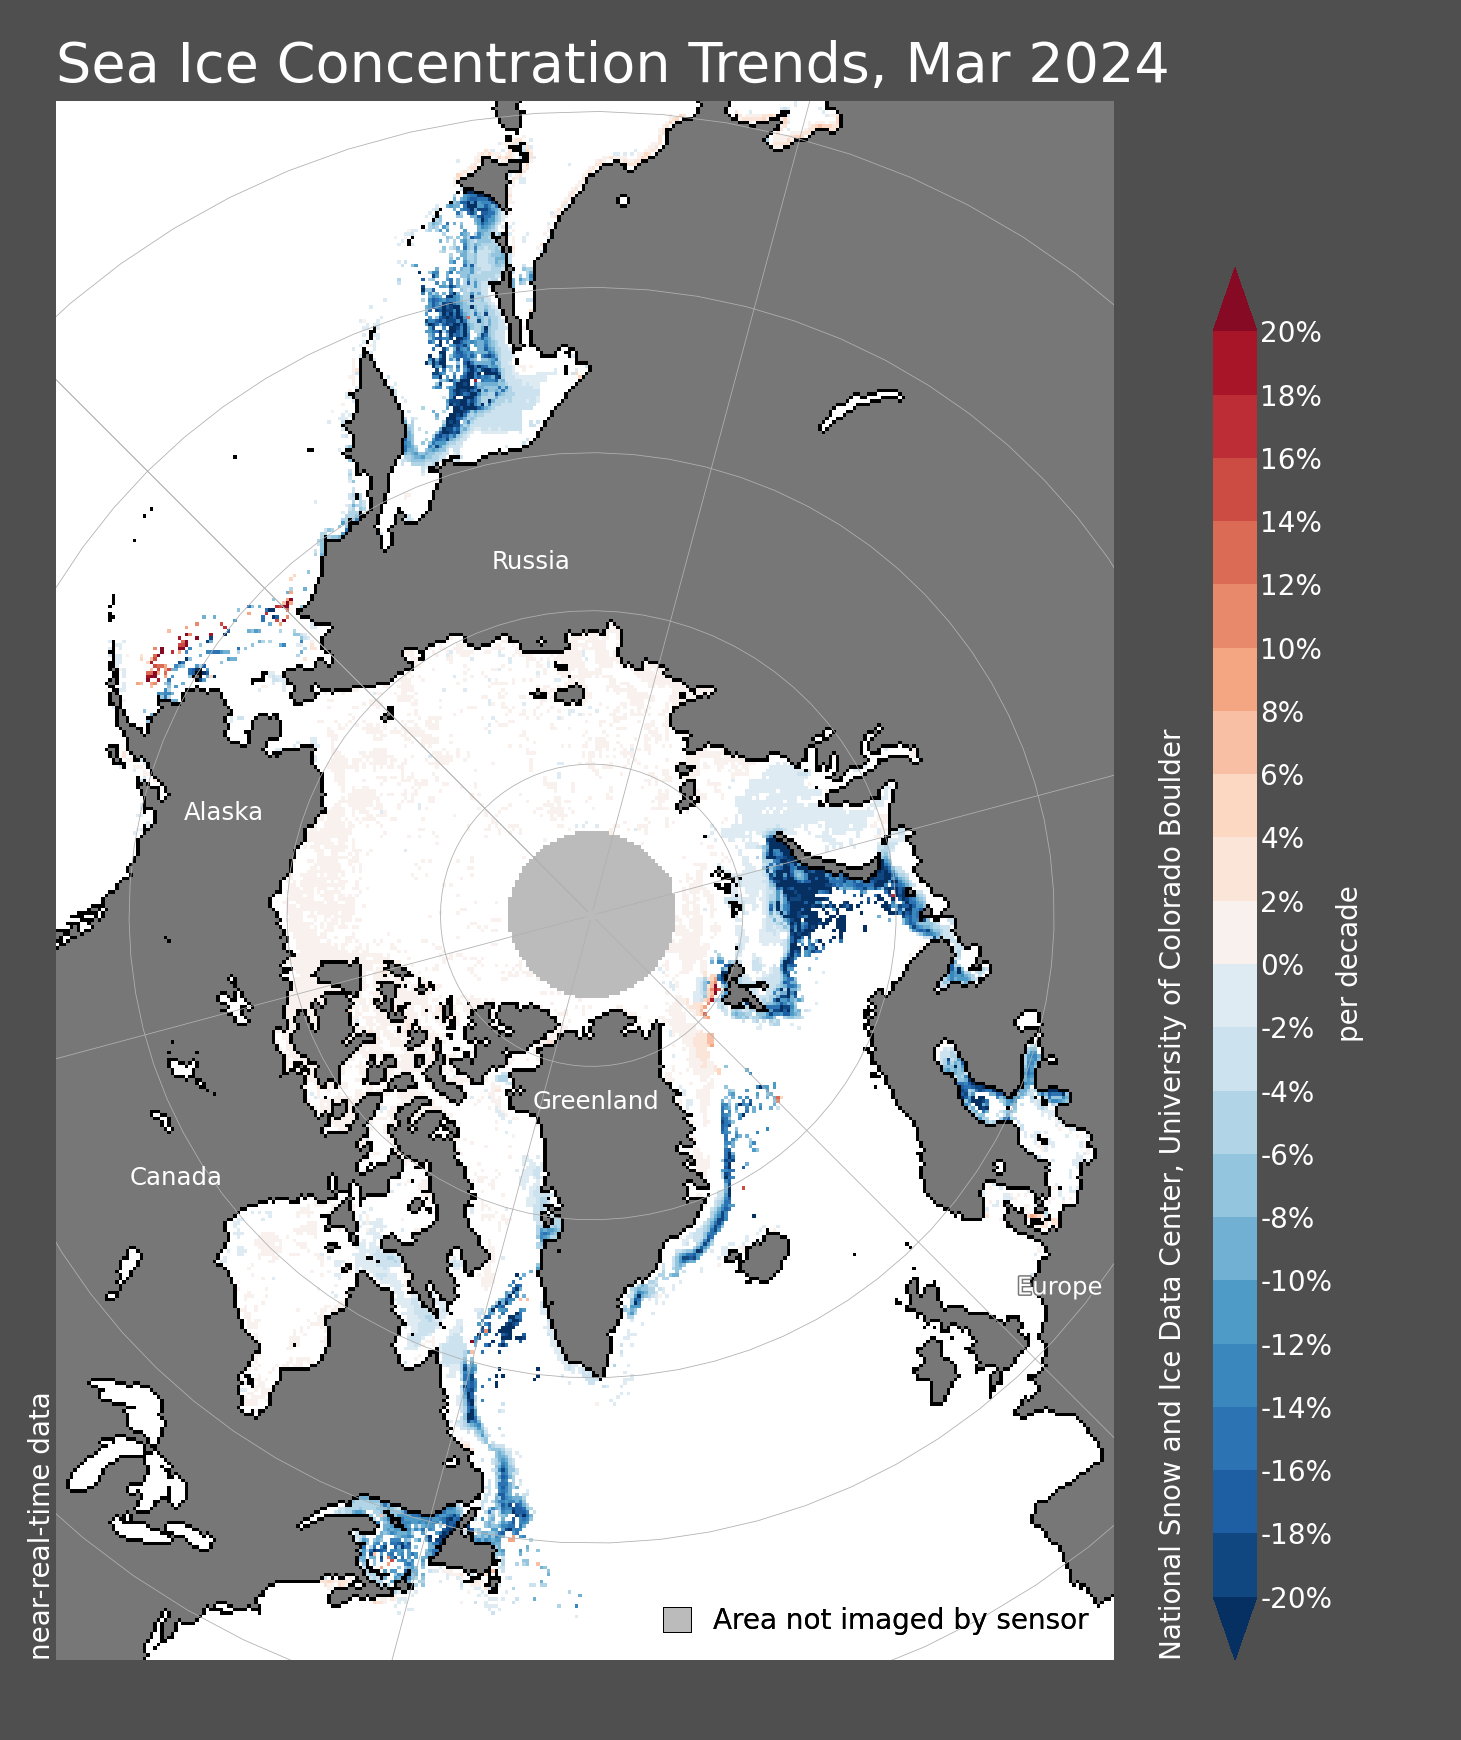
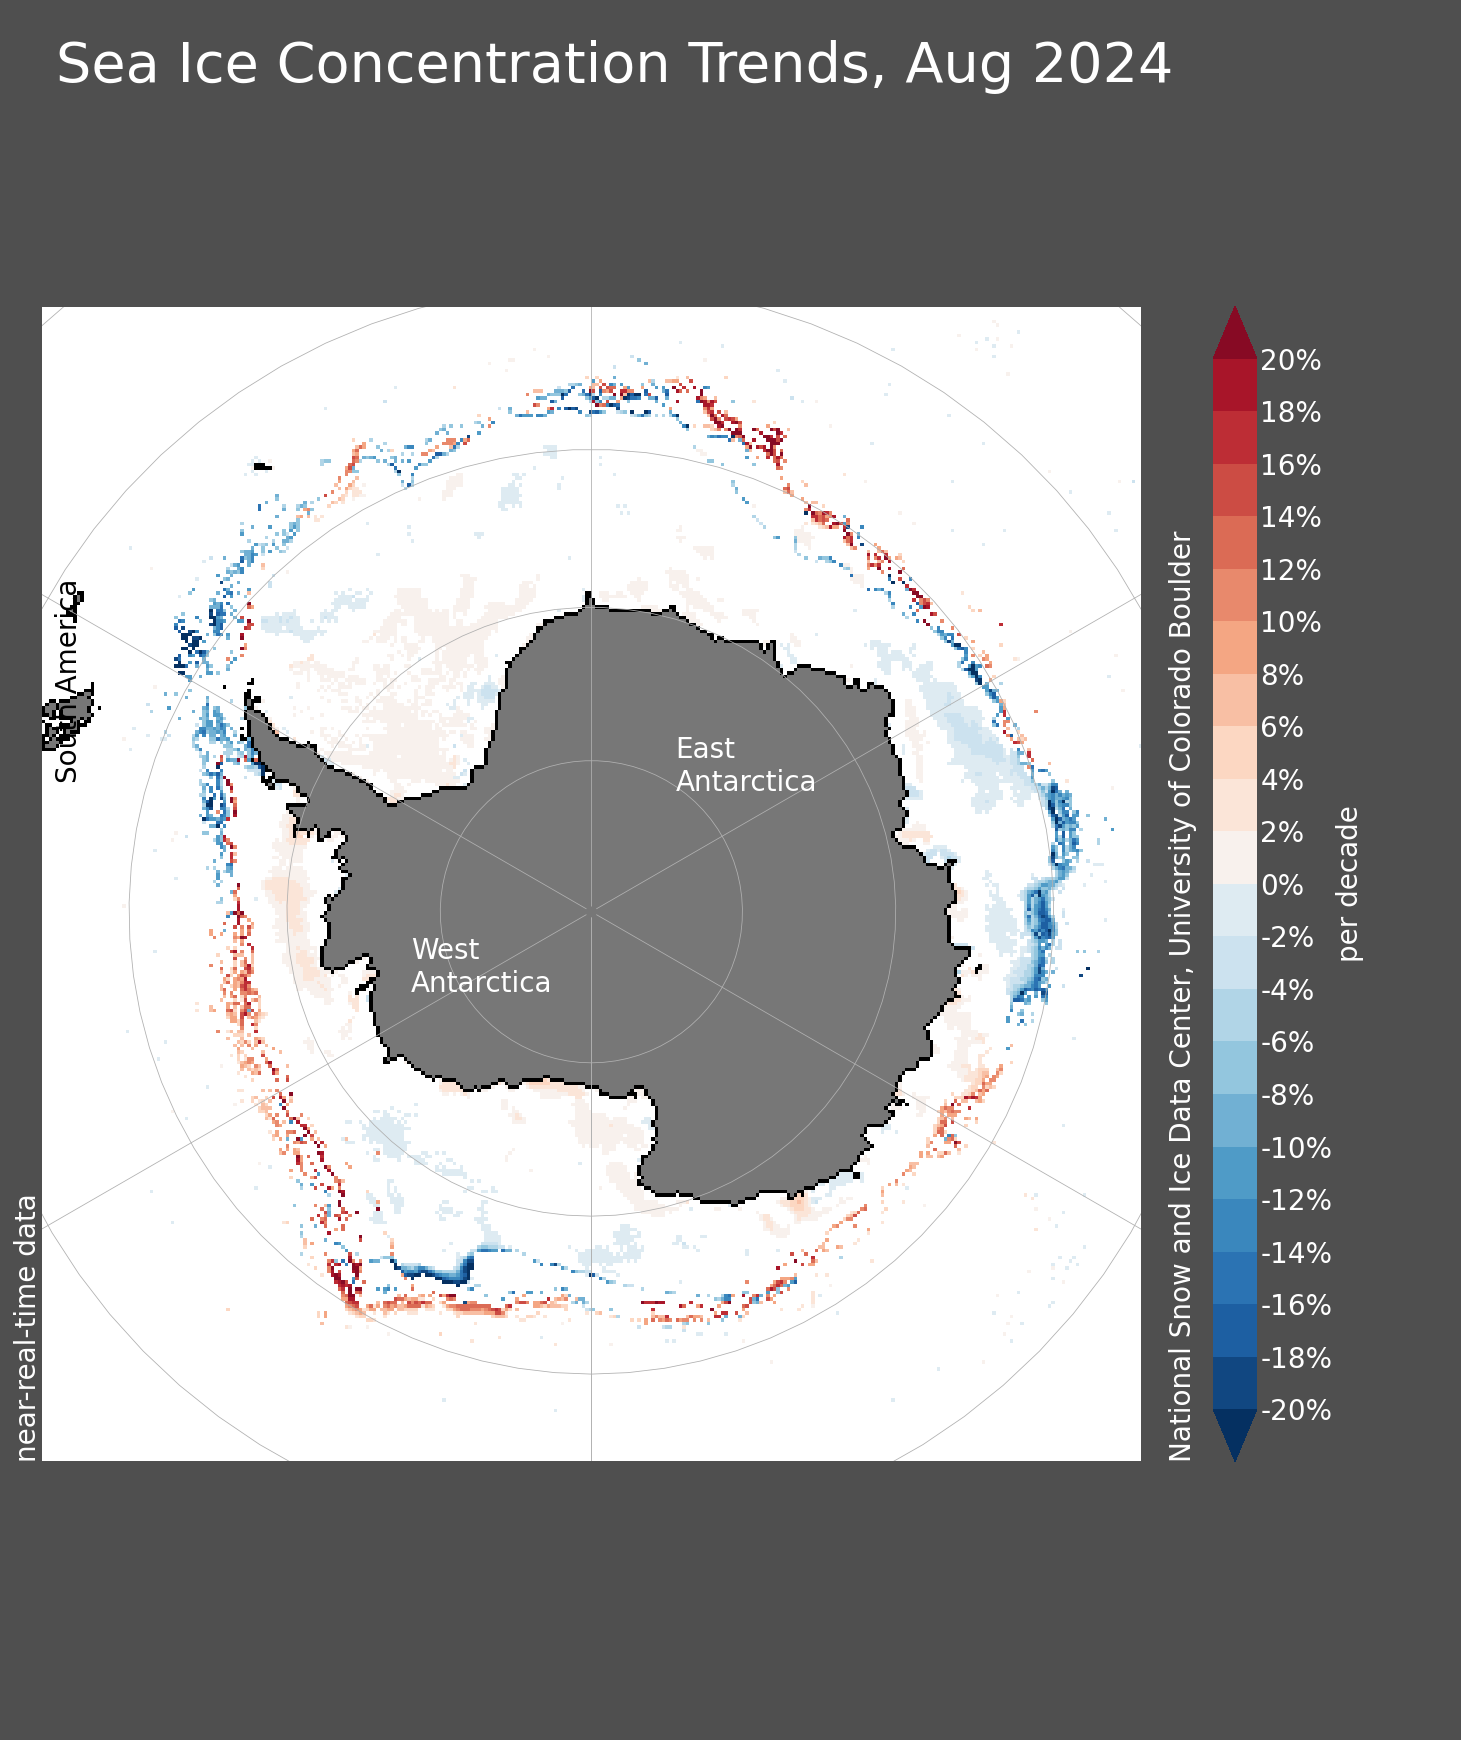
These images of trends in sea ice concentration show if the trend in sea ice concentration at a particular grid cell location is positive or negative and give some indication of its magnitude in percent change per decade color-coded in shades of blue (negative trend) to red (positive trend). The area around the North Pole that is not imaged by the satellite is left out of the images (light grey circle).
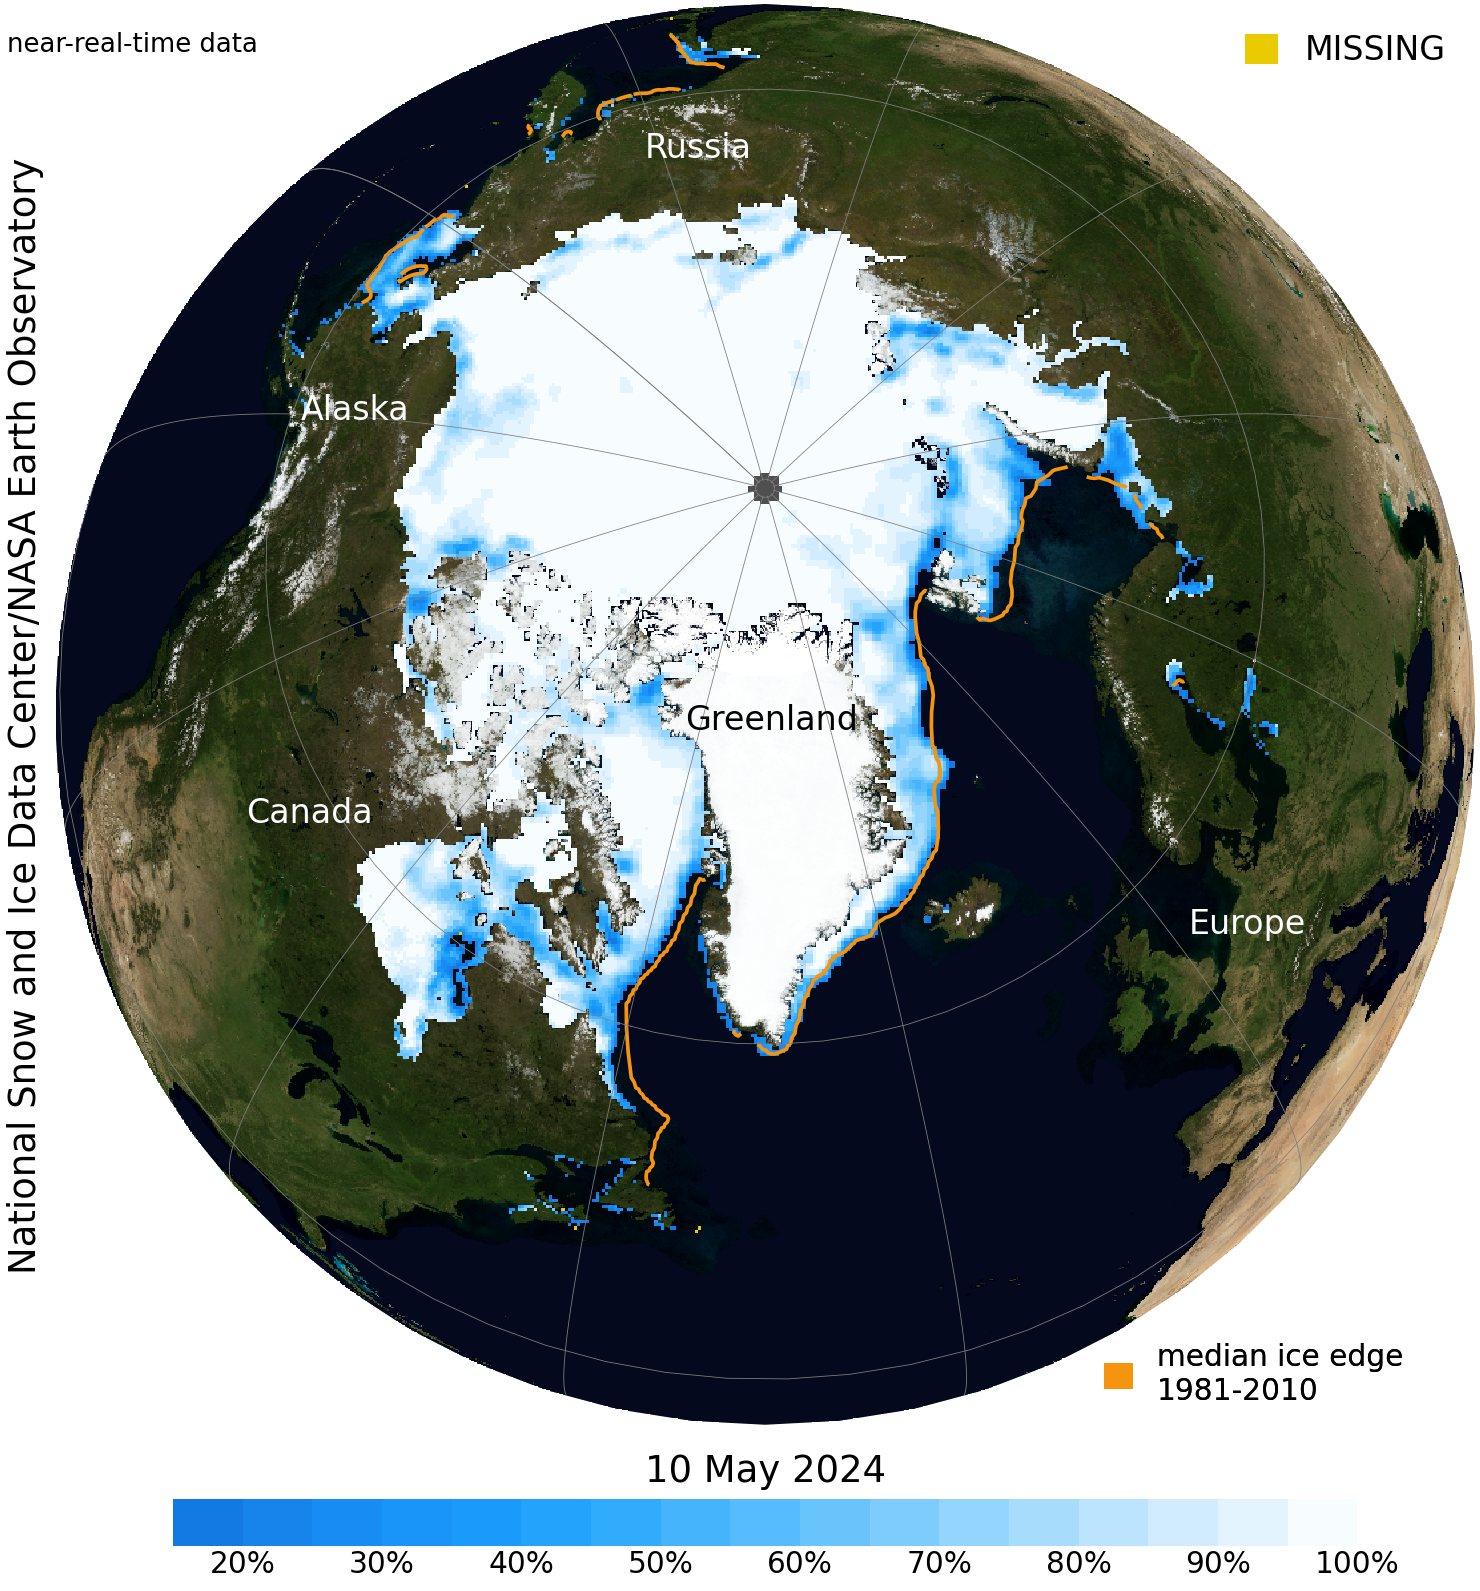
The daily Sea Ice Index provides a quick look at Arctic-wide changes in sea ice. It provides consistently processed daily ice extent and concentration images and data since 1979. Daily extent images show ice extent at concentrations greater than 15% for a given day with an outline of the typical extent for that day based on a 30-year (1981-2010) median (orange line).
Daily Sea Ice Extent Time Series
More About Daily Images
Daily Sea Ice Extent
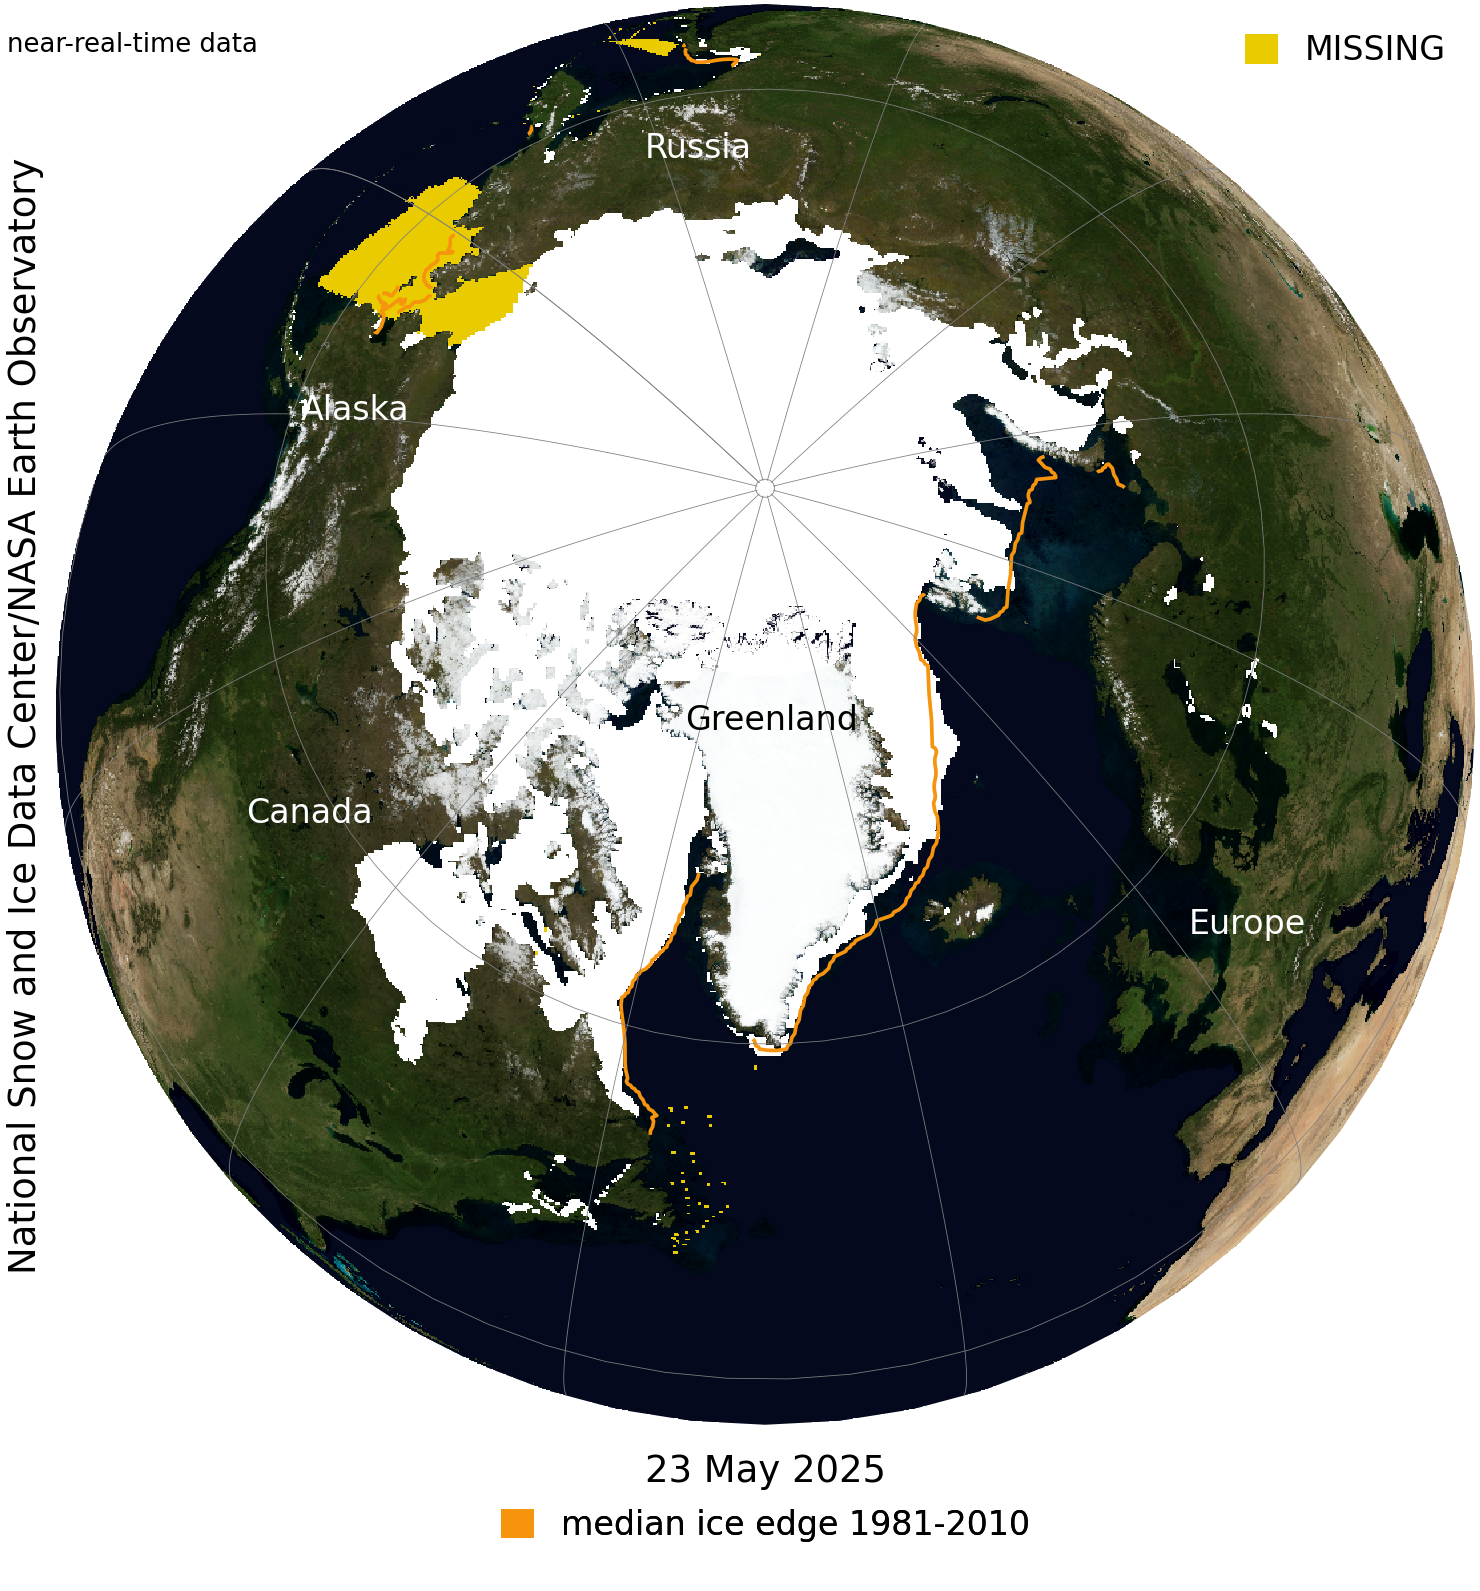
These images show the extent of ocean covered by ice at any concentration greater than 15 percent for a given day. This snapshot of current ice conditions may be missing data (missing data appears as gray dots or areas). The median line (orange in images) shows a typical ice extent for that day based on data from 1981 through 2010. The area around the North Pole that the satellite does not image is assumed to be covered by ice at more than 15 percent concentration.Daily Sea Ice Concentration
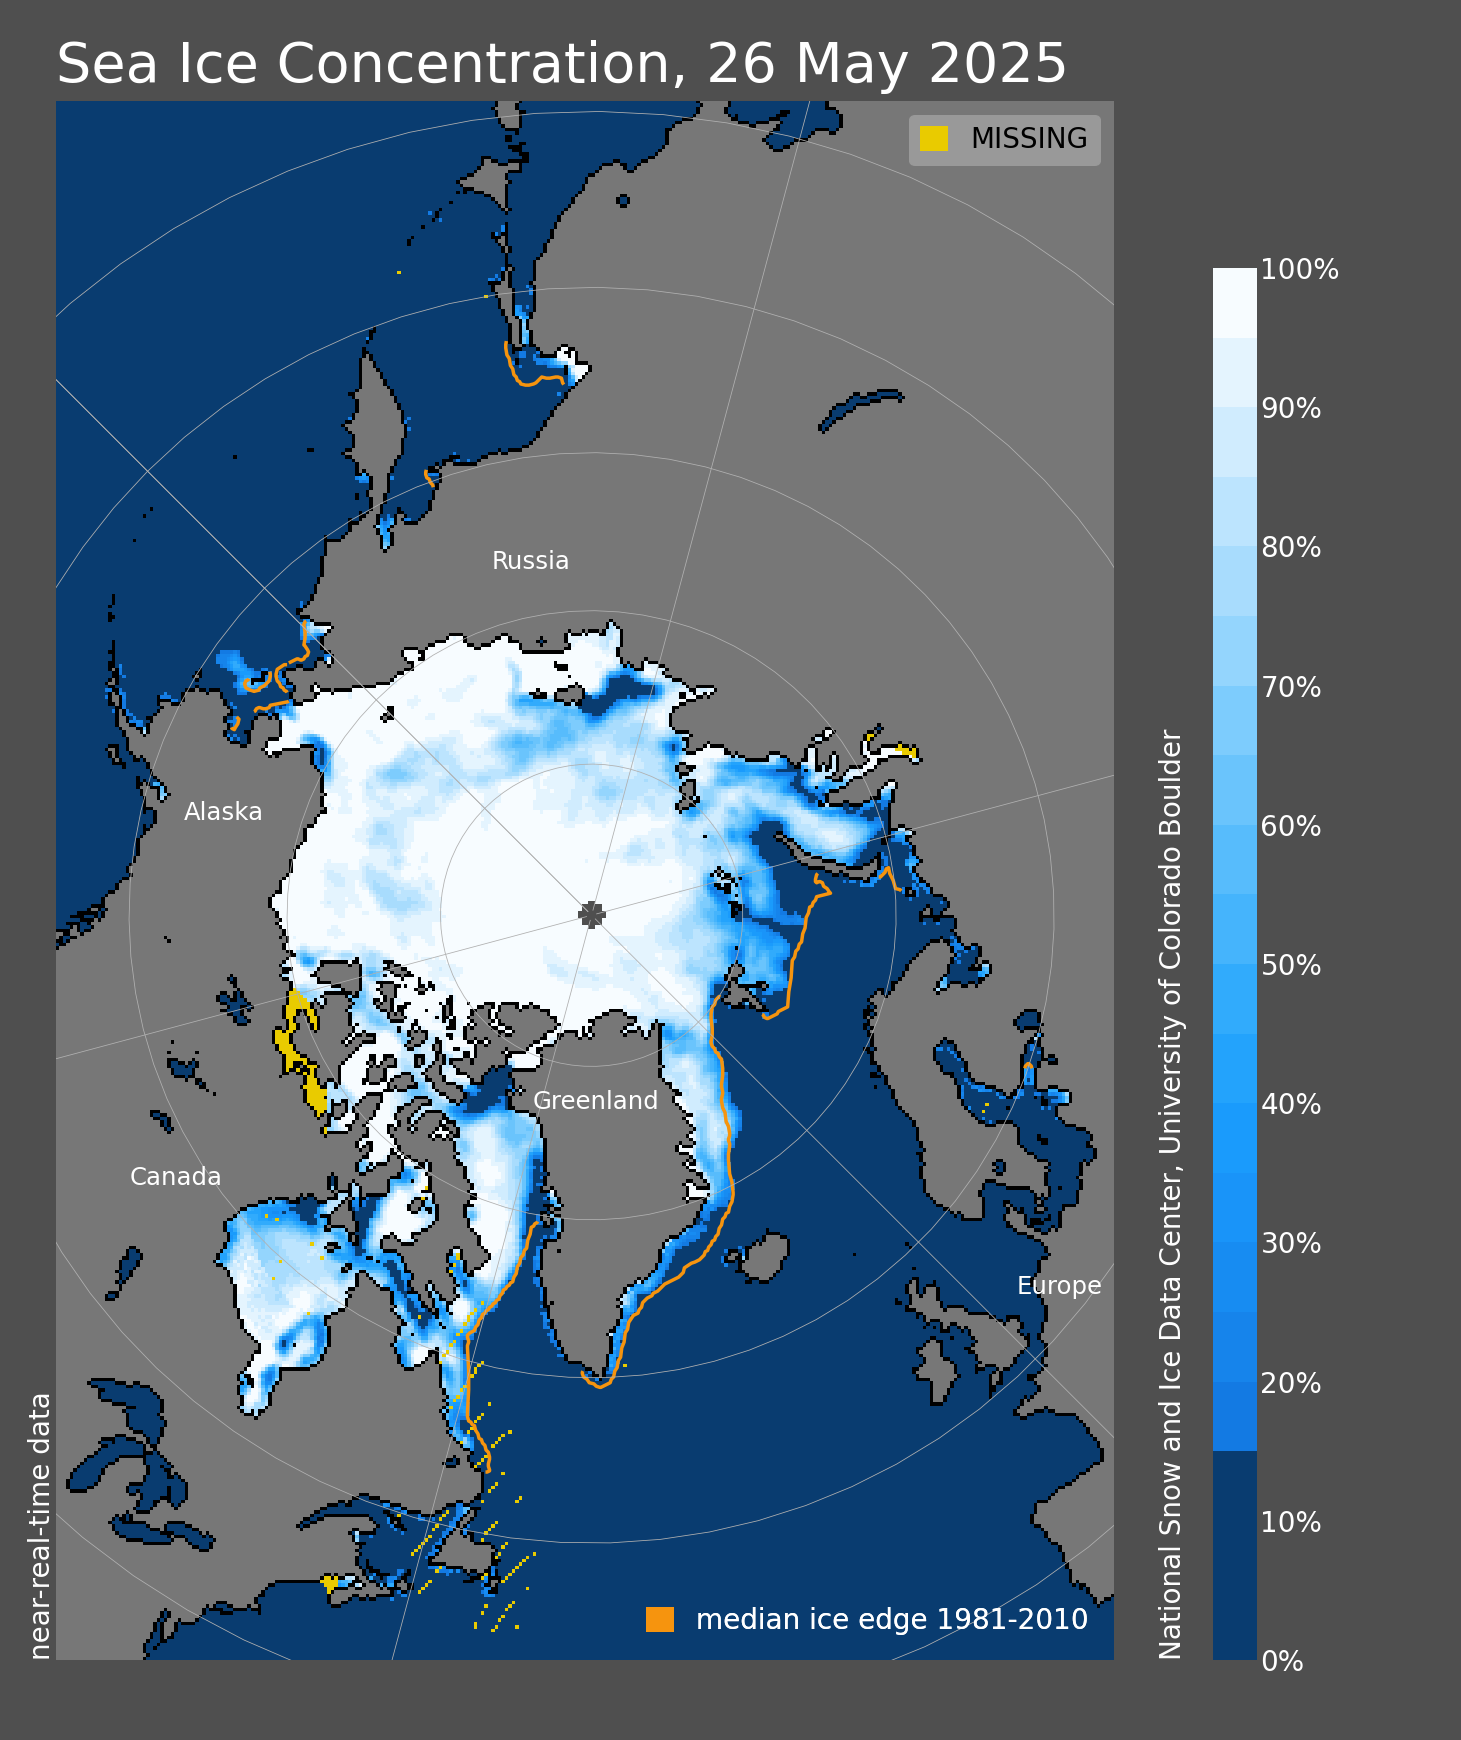
These images show the percentage of ice cover for each roughly 25-kilometer-square data cell that is more than 15 percent covered by ice on a given day. The daily images may be missing data (missing data appears as dark grey dots or areas). The area around the North Pole that is not imaged by the satellite is excluded from the area because there is no way to know what the concentration is within this area.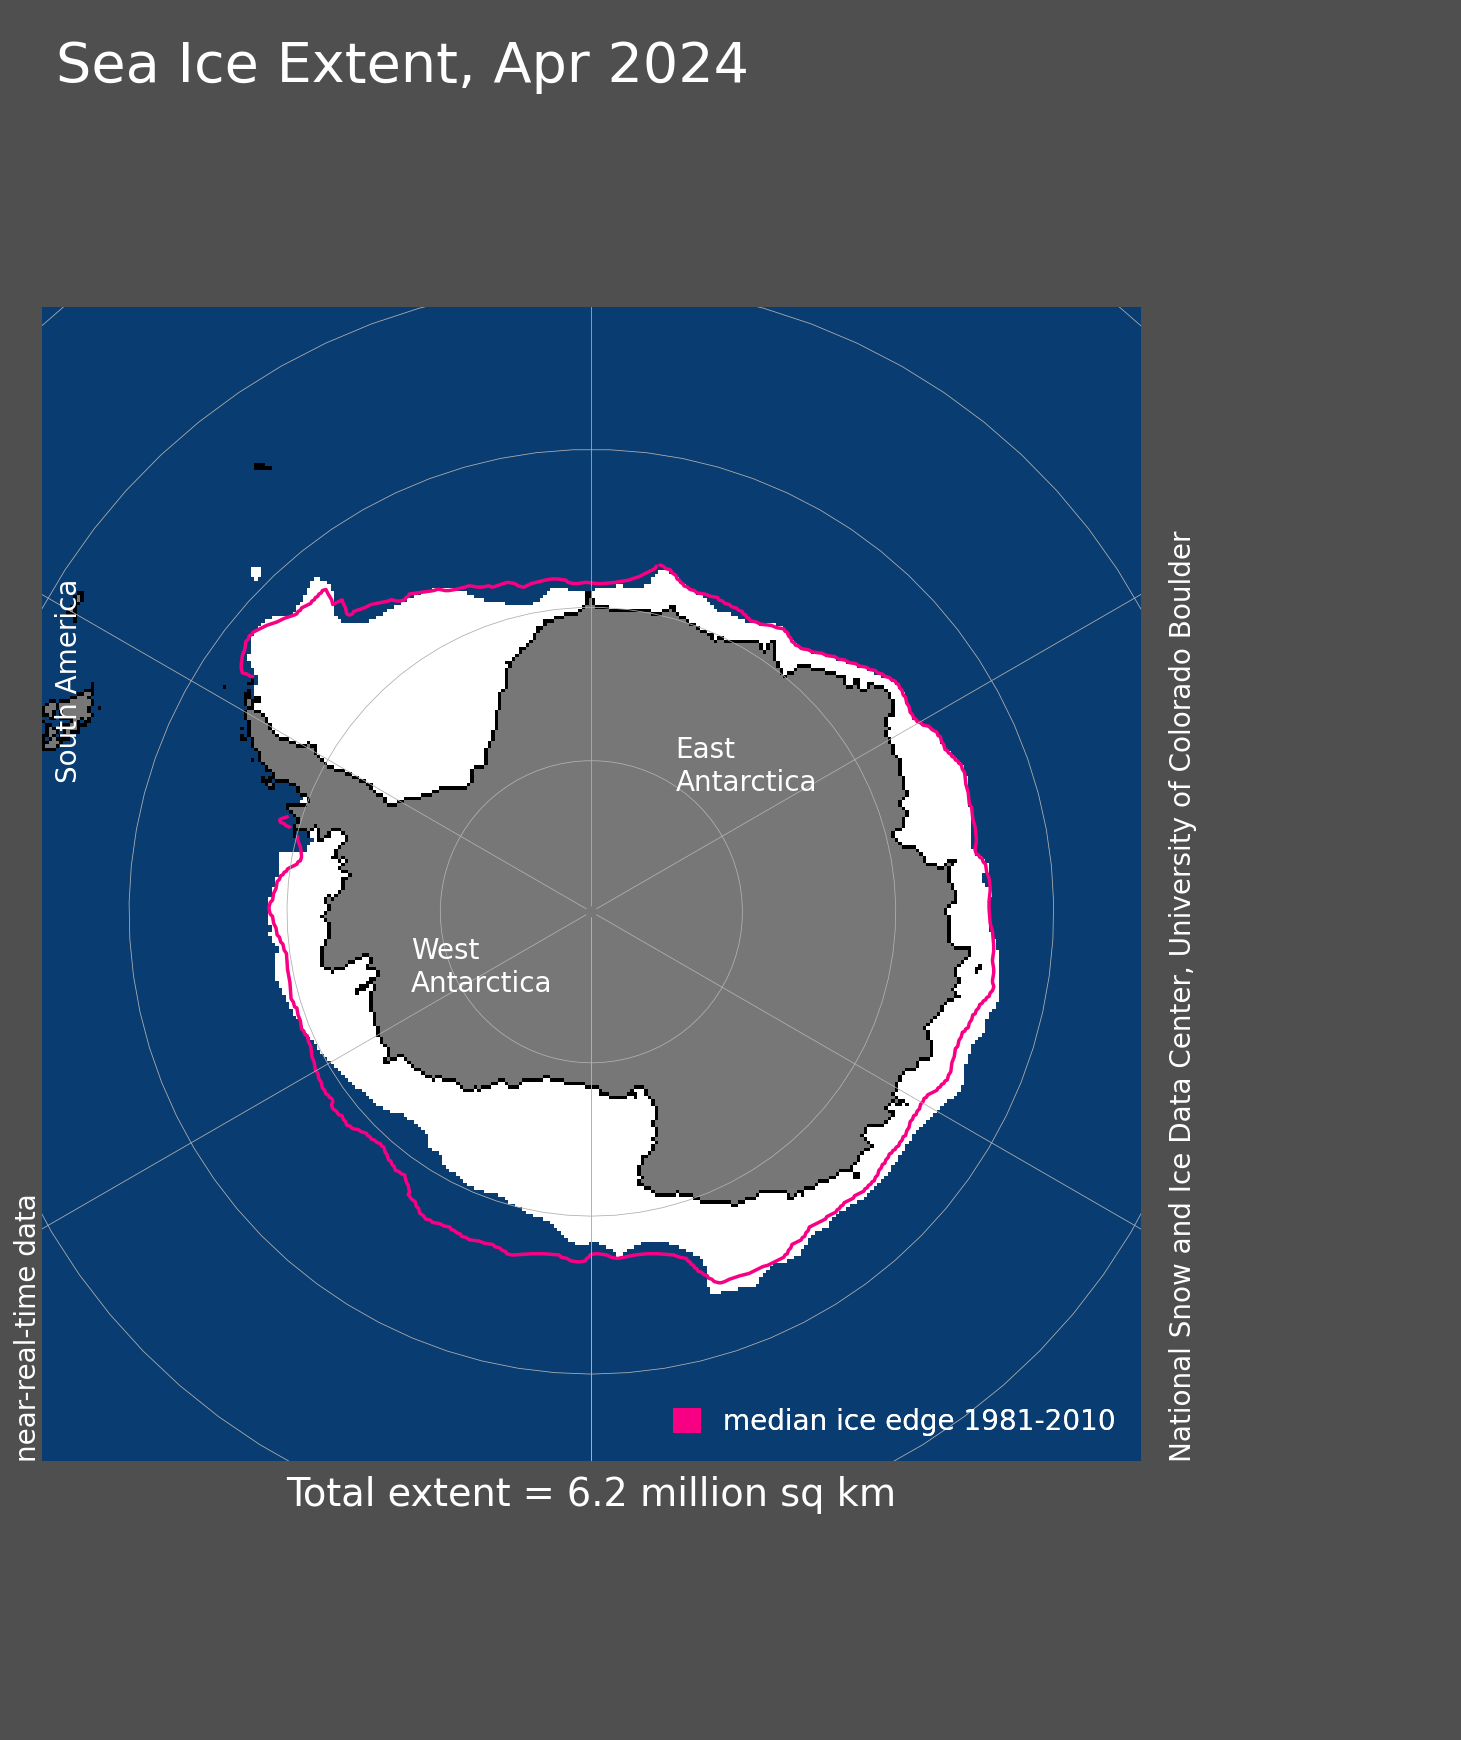
The monthly Sea Ice Index provides a quick look at Antarctic-wide changes in sea ice. It is a source for consistently processed ice extent and concentration images and data values since 1979. Monthly images show sea ice extent with an outline of the 30-year (1981-2010) median extent for that month (magenta line). Other monthly images show sea ice concentration and anomalies and trends in concentration.
Monthly Sea Ice Extent Anomaly Graph
More About Monthly Images
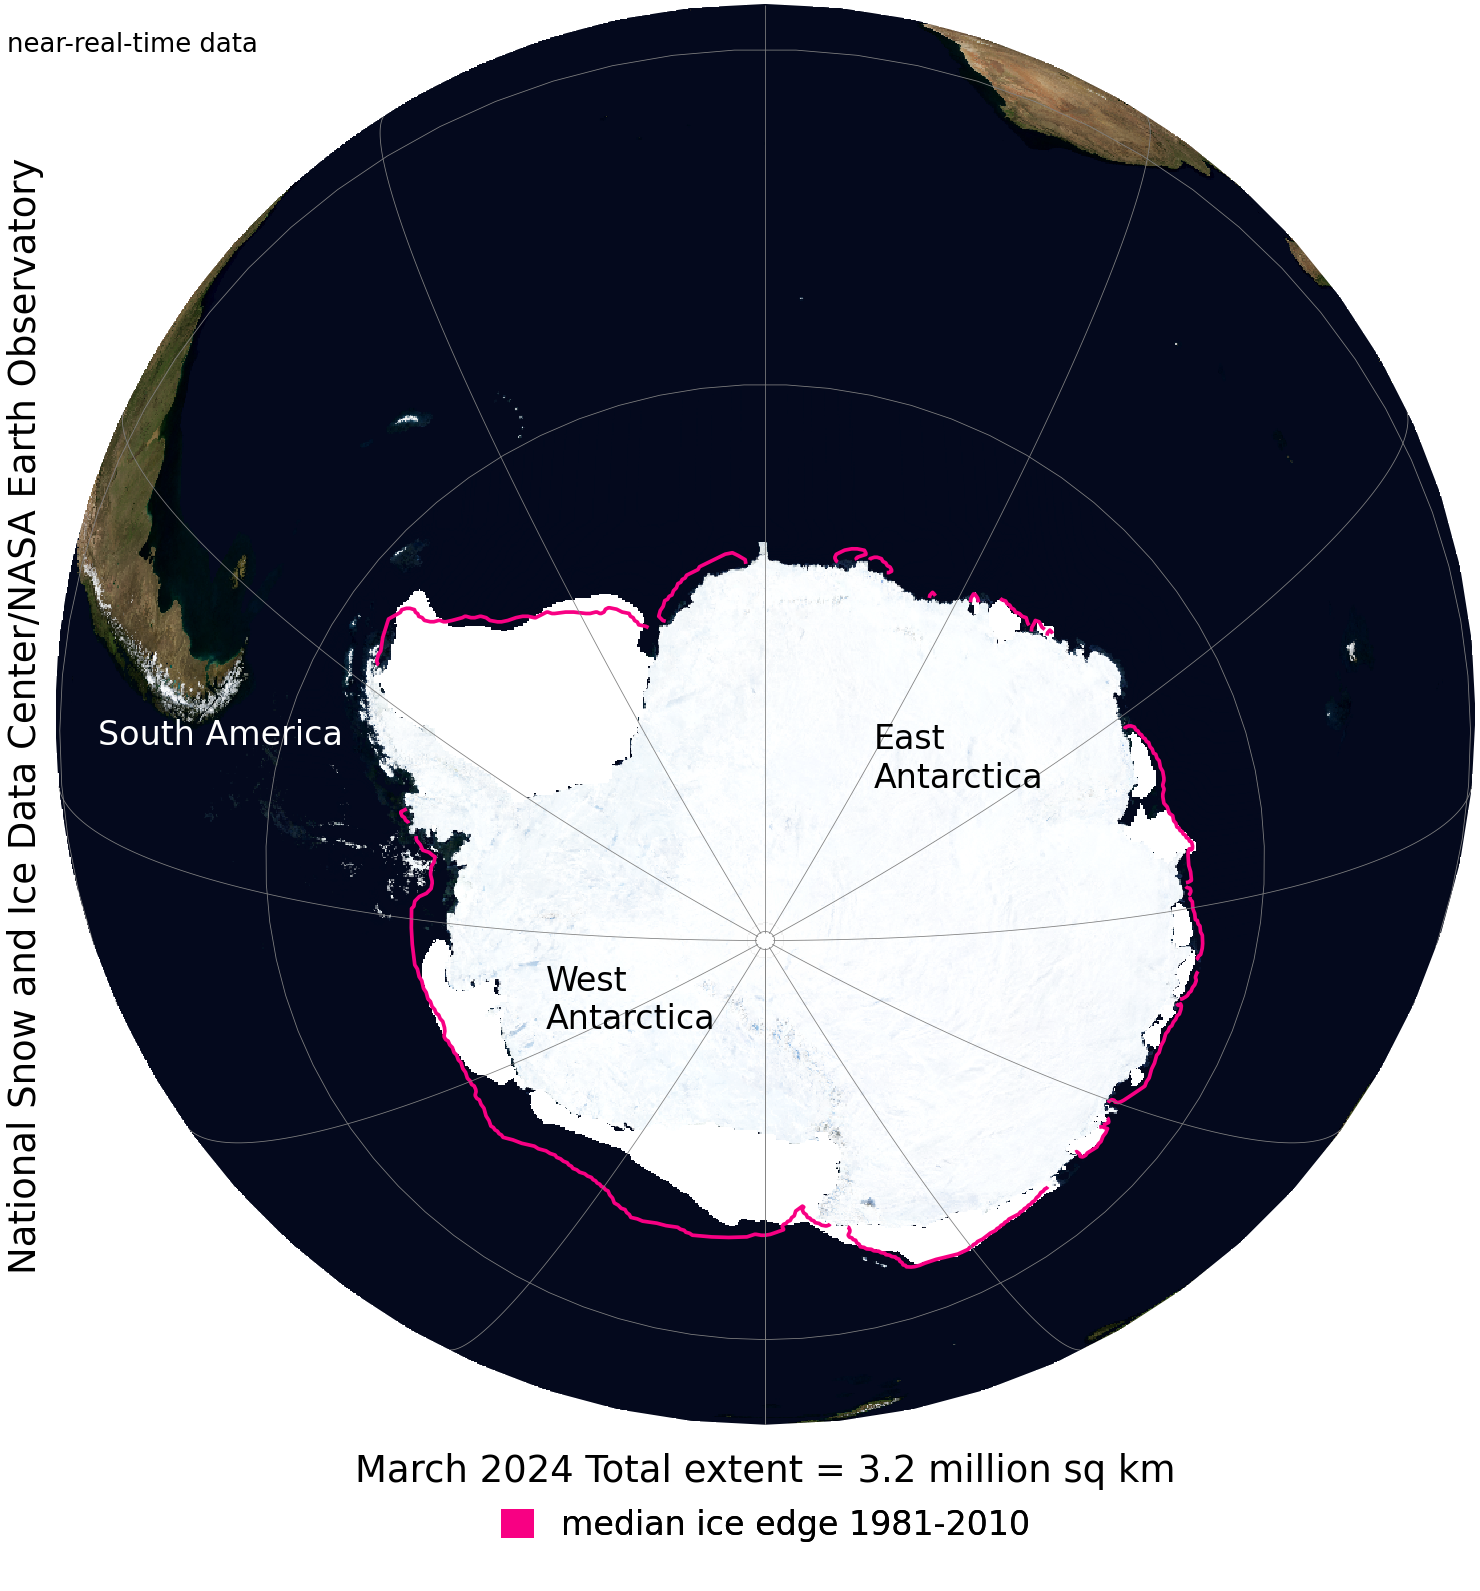
Monthly Sea Ice Extent
The monthly extent images show the expanse covered by ice at greater than 15 percent monthly mean concentration for the Antarctic and Antarctica. The total extent value is given in the bottom margin. It is derived from passive microwave data. The median line (in pink) shows a typical ice extent for that month, based on data from 1981 through 2010. The area around the North Pole that the satellite does not image is assumed to be covered by ice at more than 15 percent concentration.Monthly Sea Ice Concentration
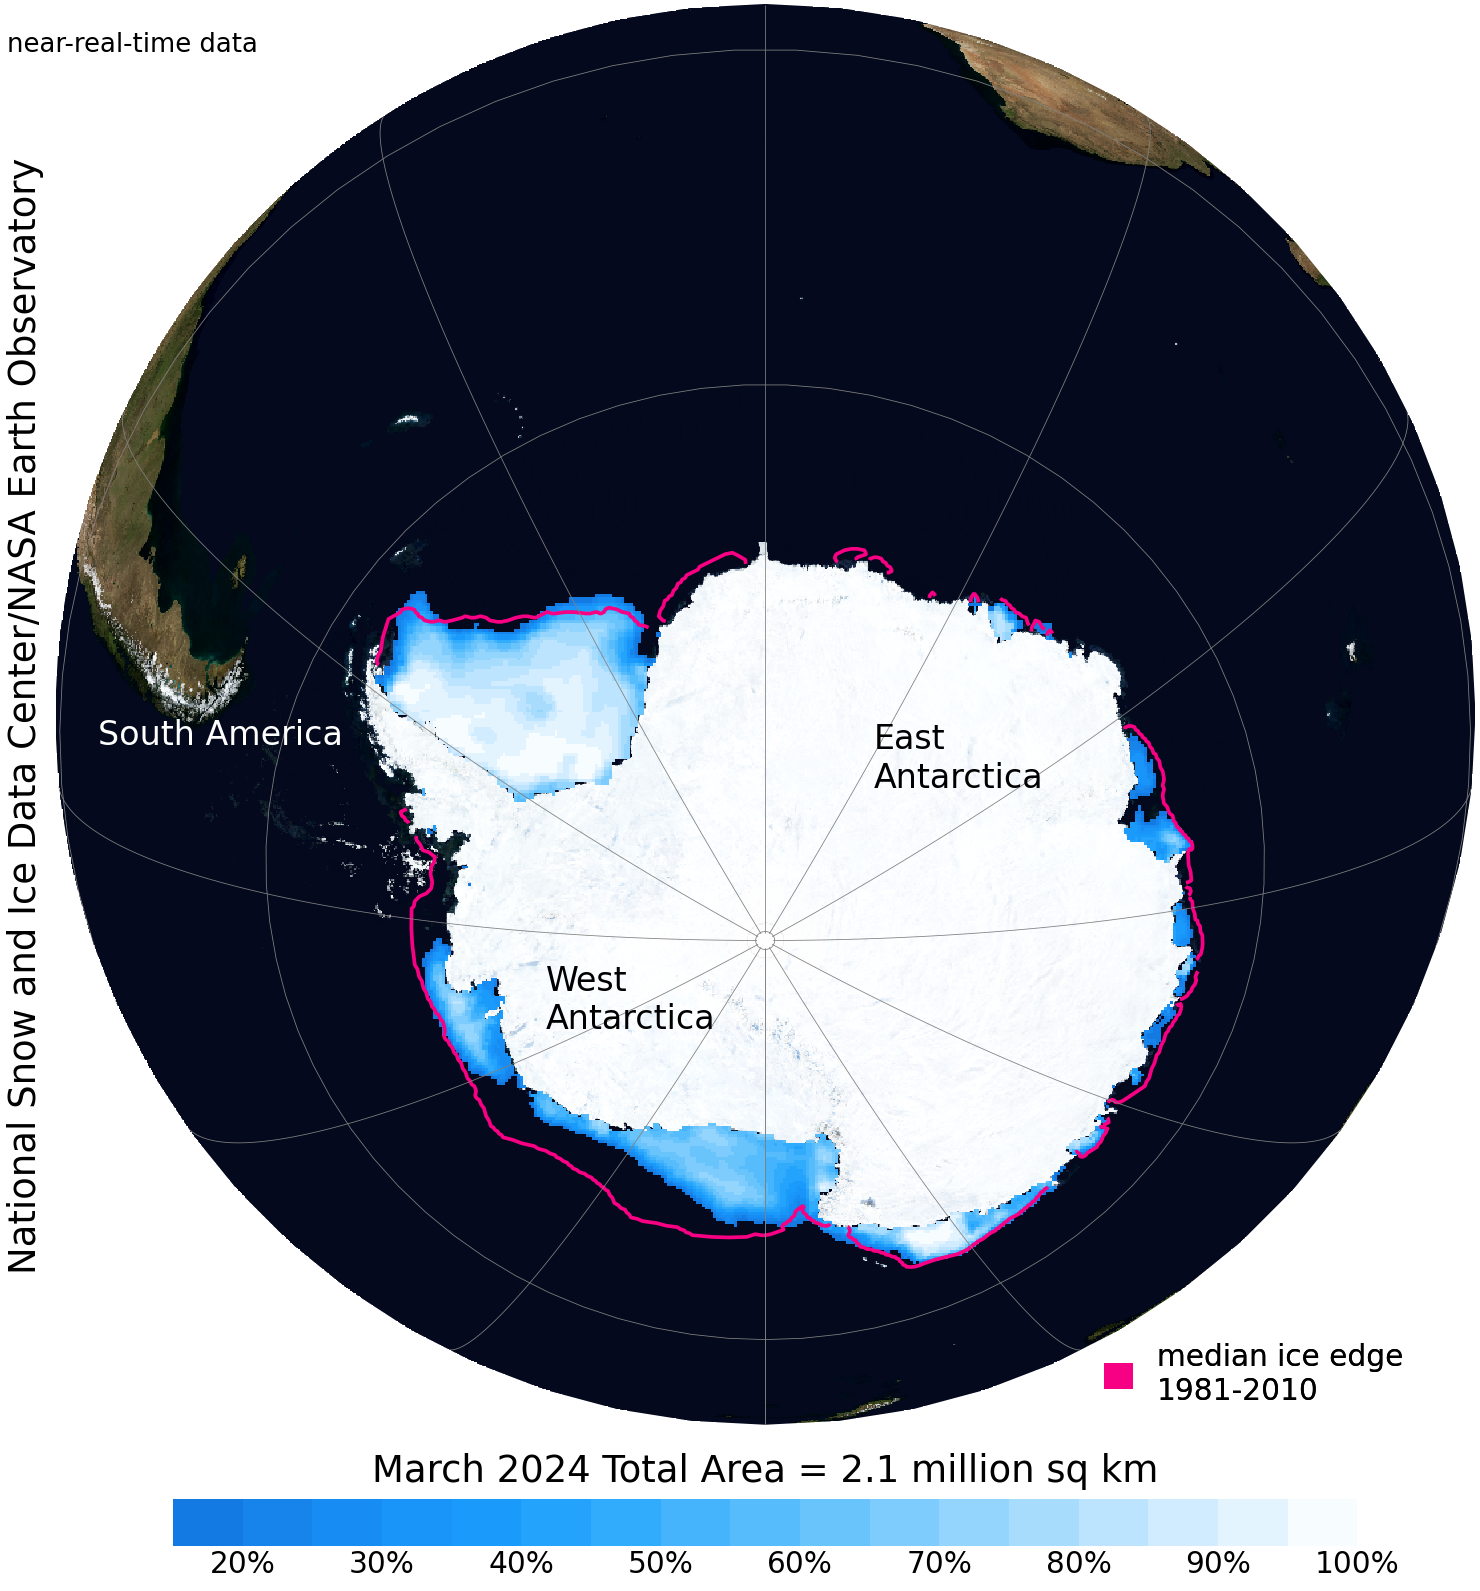
The monthly concentration images show a particular month's ice concentration with each 25 km data cell color-coded in shades of blue to white, where dark blue is zero percent ice (ocean) and white is 100 percent ice. The area around the North Pole that is not imaged by the satellite is left out of the images (dark grey circle).Monthly Sea Ice Concentration Anomaly
These images of anomalies in ice concentration show, in percent color-coded in shades of blue (negative anomaly) to red (positive anomaly), how much the ice concentration for a month differs from the mean calculated for that month over the 1981 through 2010 time range. The total anomalous area of sea ice for that month is also shown in the bottom margin of the image. The area around the North Pole that is not imaged by the satellite is left out of the images (light grey circle).Monthly Sea Ice Concentration Trend
These images of trends in sea ice concentration show if the trend in sea ice concentration at a particular grid cell location is positive or negative and give some indication of its magnitude in percent change per decade color-coded in shades of blue (negative trend) to red (positive trend). The area around the North Pole that is not imaged by the satellite is left out of the images (light grey circle).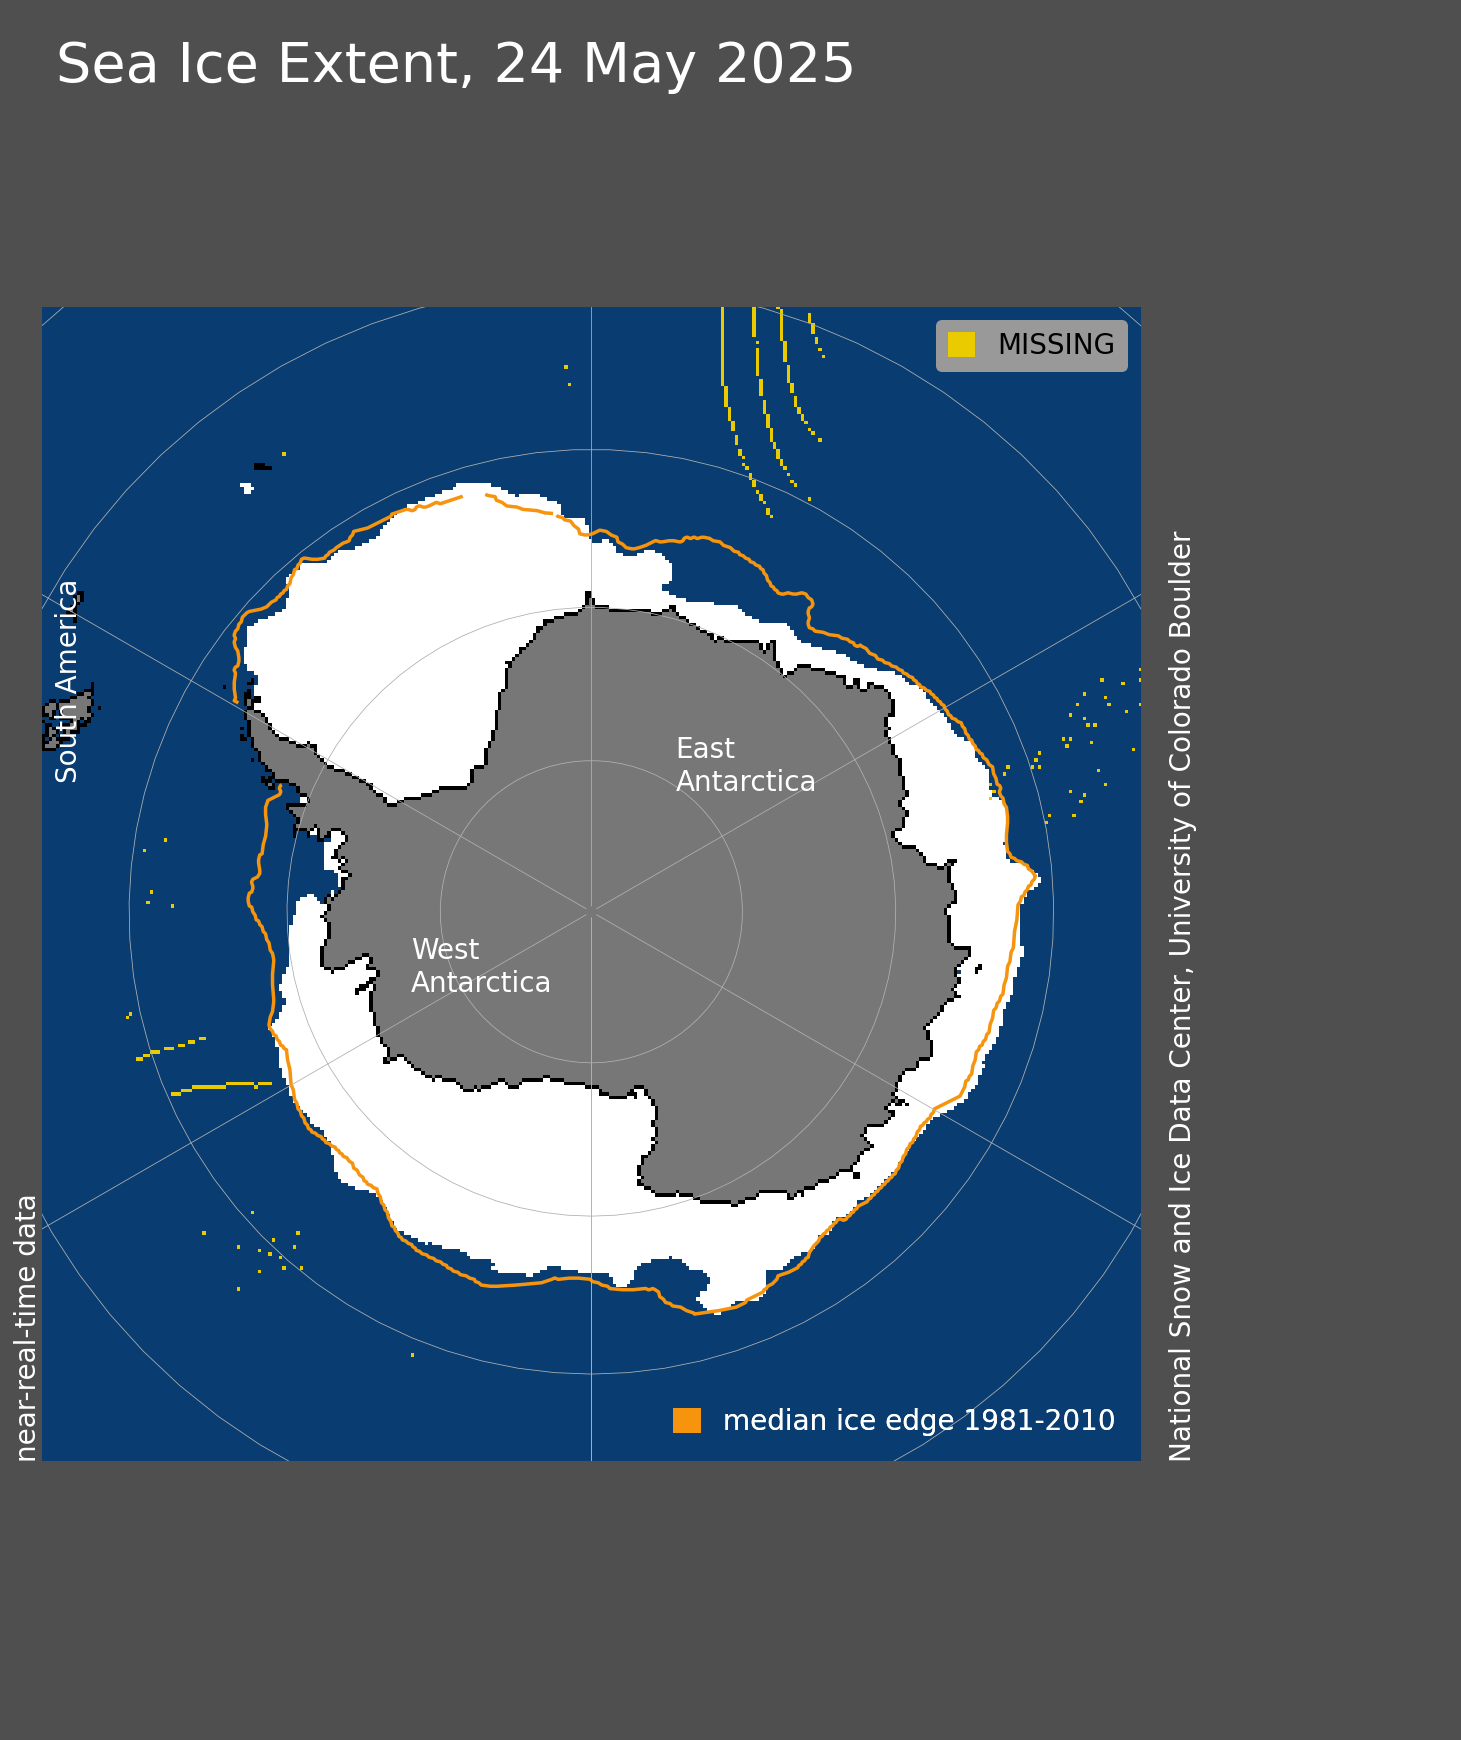
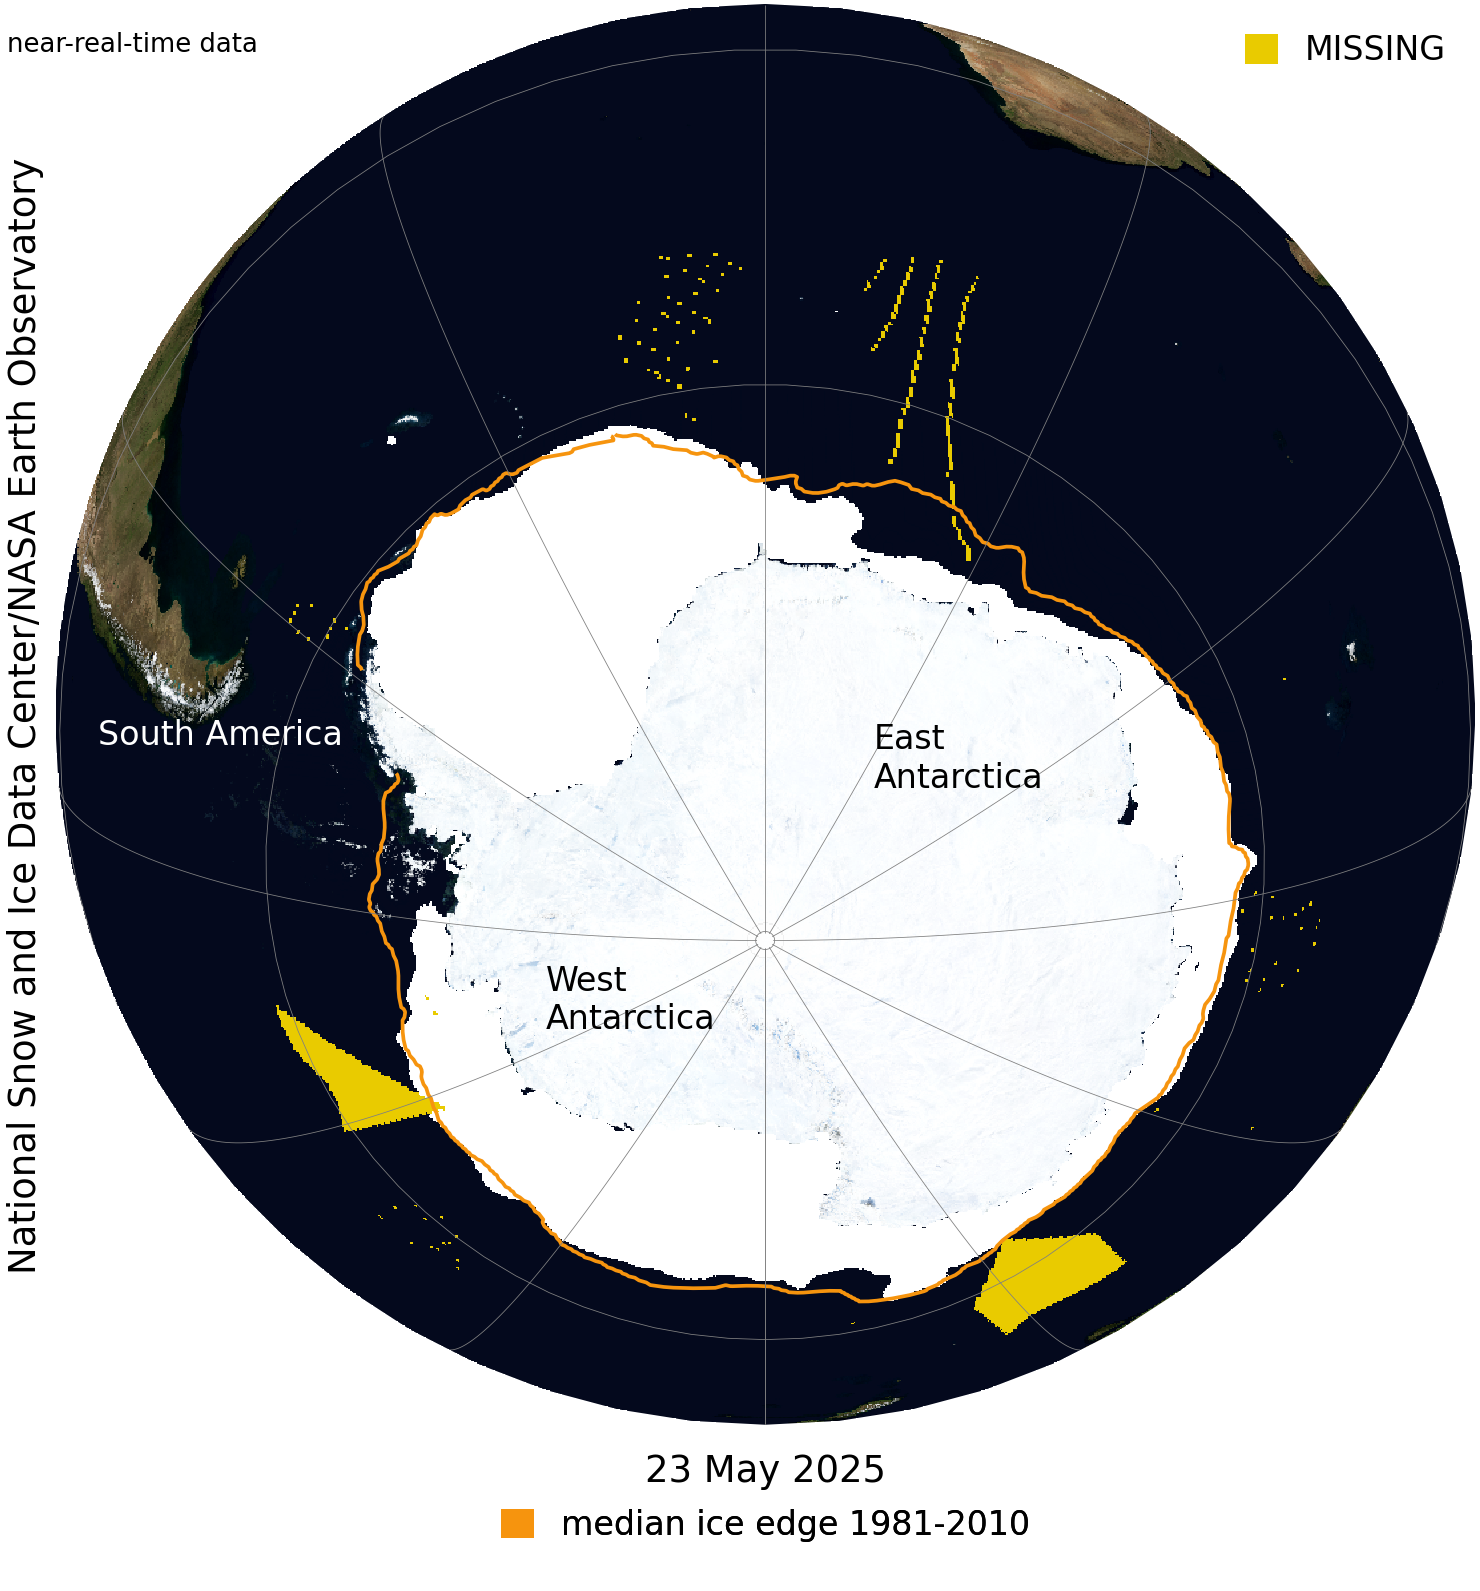
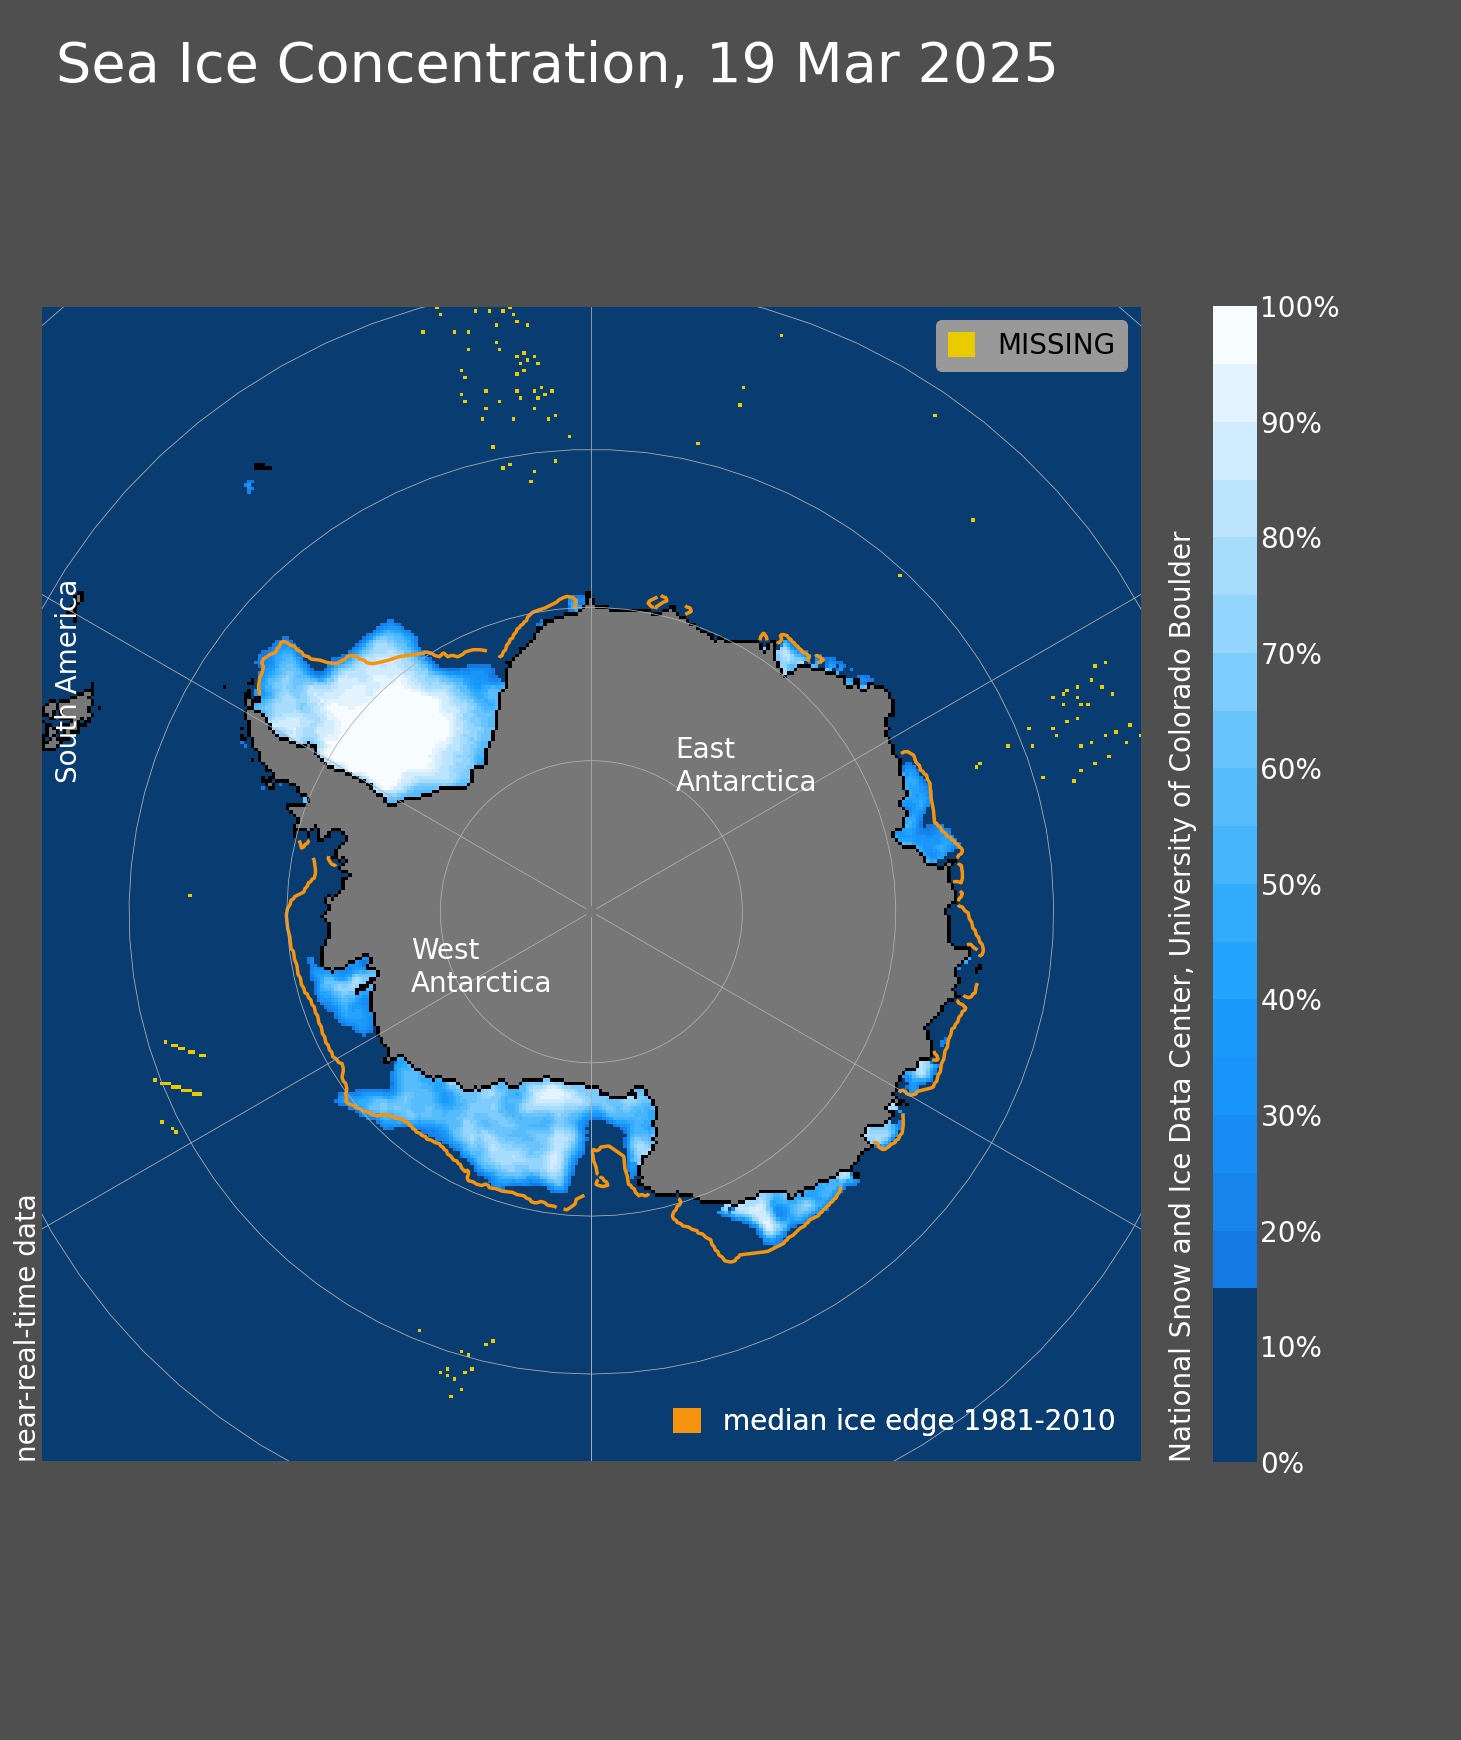
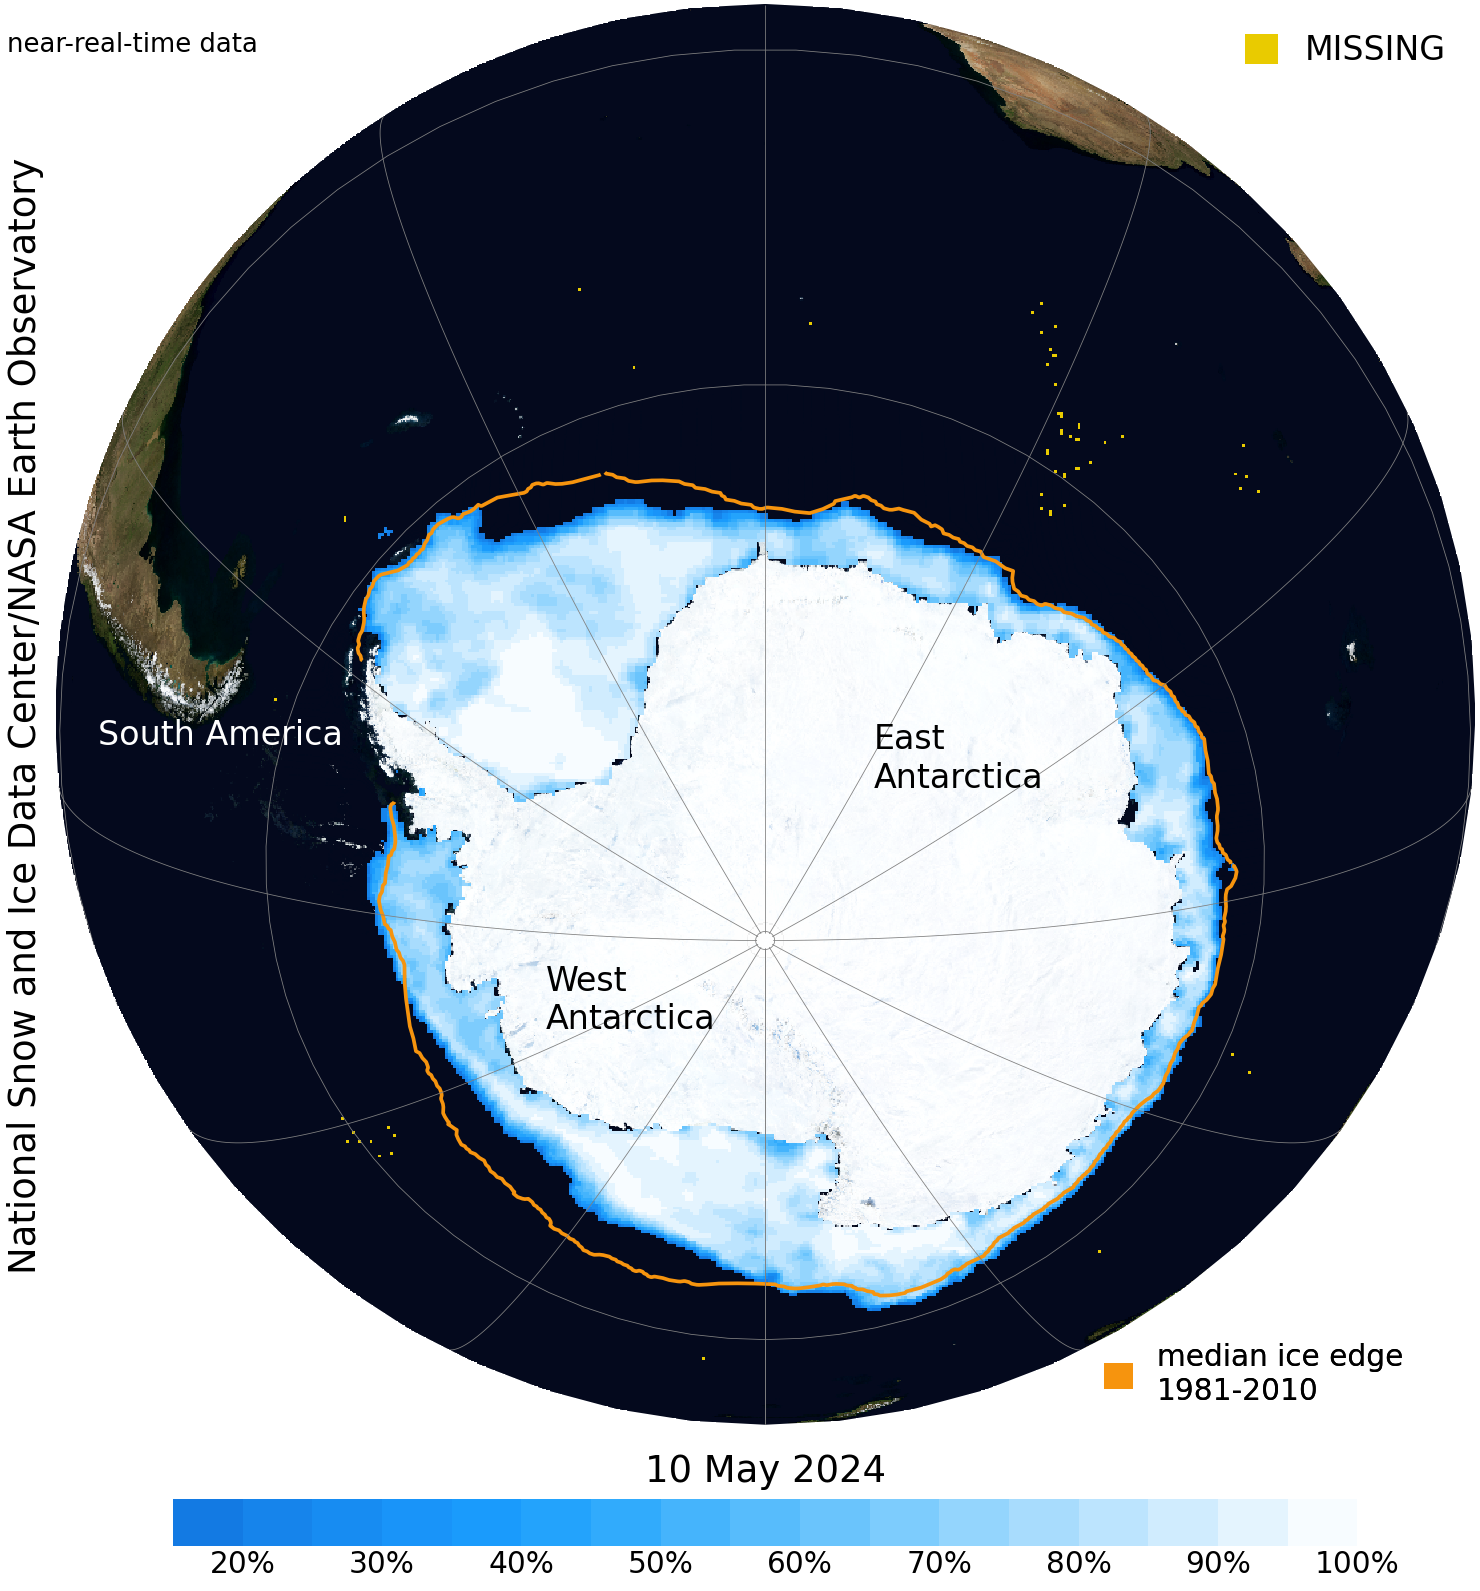
The daily Sea Ice Index provides a quick look at Antarctic-wide changes in sea ice. It provides consistently processed daily ice extent and concentration images and data since 1979. Daily extent images show ice extent at concentrations greater than 15% for a given day with an outline of the typical extent for that day based on a 30-year (1981-2010) median (orange line).
Daily Sea Ice Extent Time Series
More About Daily Images
Daily Sea Ice Extent
These images show the extent of ocean covered by ice at any concentration greater than 15 percent for a given day. This snapshot of current ice conditions may be missing data (missing data appears as gray dots or areas). The median line (orange in images) shows a typical ice extent for that day based on data from 1981 through 2010. The area around the North Pole that the satellite does not image is assumed to be covered by ice at more than 15 percent concentration.Daily Sea Ice Concentration
These images show the percentage of ice cover for each roughly 25-kilometer-square data cell that is more than 15 percent covered by ice on a given day. The daily images may be missing data (missing data appears as dark grey dots or areas). The area around the North Pole that is not imaged by the satellite is excluded from the area because there is no way to know what the concentration is within this area.About the banner image: This photograph of sea ice was taken during the Multidisciplinary drifting Observatory for the Study of Arctic Climate (MOSAiC) expedition. The photographer, atmospheric scientist Ivo Beck, illuminated a ridge of sea ice from behind with a searchlight to produce the dramatic green/blue shine. The MOSAiC sea ice focus asks how local and regional energy exchanges are affected by changes in ice and snow. These exchanges affect what we see in larger scale monitoring tools like the Sea Ice Index.