1. Introduction
Methane is the second most important anthropogenic greenhouse gas (GHG), with a radiative forcing equivalent to 60% of that due to CO2 (including the indirect effects of methane on atmospheric ozone, water vapor and carbon dioxide, Myhre 2013). Its atmospheric concentration has increased by 250% relative to pre-industrial levels (Saunois et al 2020). As carbon budgets are rapidly running out to meet the 1.5 °C target of the Paris agreement, methane abatement is seen as a cost-effective strategy to rapidly curb climate change due to its short lifetime (Nisbet et al 2020), and cheap mitigation measures in the energy sector bringing additional benefits such as methane recovery, leading to improved safety and air quality (Harmsen et al 2020). However, hard-to-abate agricultural methane emissions are projected to represent a significant part of residual methane emissions in climate mitigation scenarios (Harmsen et al 2020). Methane removal (MR) consists in eliminating methane from point sources or directly from the atmosphere (Boucher and Folberth 2010), which could increase abatement potential. MR is gaining momentum, with the development of a research agenda on atmospheric MR by the National Academies of Sciences, Engineering, and Medicine. Although several methods to remove methane have been proposed, the literature on their scalability and their possible costs is still sparse (Ming et al 2022a), unlike for carbon dioxide removal (CDR). This discrepancy reflects in the first place the broader debate on the prioritization of either CH4 or CO2 abatement, but also the specific challenges and opportunities of MR compared to CDR.
Firstly, methane mitigation could help counteract short-term warming and have a rapid impact on climate change, in line with the short-term effect of atmospheric methane (Jackson et al 2019, Abernethy et al 2023). Furthermore, methane is not part of the fertilization of the biosphere, so its atmospheric concentration may be reduced below pre-industrial levels (Boucher and Folberth 2010), simultaneously mitigating the health and ecosystem impacts of tropospheric ozone by reducing its concentration (Abernethy et al 2021). However, for long-term climate stabilization, focusing initial mitigation efforts on carbon dioxide is justified given the long atmospheric residence time of CO2, compared to the transient effect of methane abatement on temperature trends (Abernethy et al 2021, McKeough 2022).
Secondly, MR poses a number of technical challenges. Methane does not have the chemical properties (weak acidity and strong dipolar momentum) used to capture CO2, and its low atmospheric abundance would make air circulation cost-prohibitive in an MR plant (Lackner 2020). However, much less MR than CDR would be required to achieve a given climate impact due to the higher radiative efficiency of methane (Jackson et al 2019), and unlike CDR, there is no need for storage since the removed methane can be oxidized to CO2 without significantly reducing the climate benefits of the process (Boucher and Folberth 2010). Unlike carbon dioxide, which requires net negative emissions to reduce its atmospheric concentration, methane concentration can be reduced by lowering emissions due to its ten-years lifetime (Lackner 2020). However, the abatement potential of anthropogenic methane emissions is limited because methane emissions from food systems are difficult to reduce (Nisbet et al 2020, Jackson et al 2021). Furthermore, several studies have pointed out that a positive feedback from rising temperatures on natural methane emissions in the future may require the removal of atmospheric methane in addition to anthropogenic emission reductions to limit the surge of atmospheric methane concentrations (Boucher and Folberth 2010, Jackson et al 2019, 2021, Ming et al 2022a).
The technical and economic feasibility of removing atmospheric methane has been discussed for a decade, and the plausible costs, scalability and potentials of MR technologies are still very uncertain, not to say unknown. Existing studies exploring MR scenarios have assessed the impact of MR on atmospheric chemistry and temperature by imposing exogenous methane emission reductions (Abernethy et al 2021) or methane-oxidizing chlorine emissions (Li et al 2023). However, how MR could be integrated into a portfolio of existing mitigation options for future climate mitigation scenarios has not been investigated.
This study has two objectives: first, to investigate the removal costs and potentials that would enable MR to play a comparable role to bioenergy with carbon capture and storage (BECCS), a key CDR method in climate change mitigation scenarios; second, given the first condition achieved, to evaluate the impacts of MR on mitigation scenarios, emissions and temperature pathways, and compare them with CDR.
2. Methods
2.1. Modeling framework
We used the energy and climate model GET-ACC2 (Gaucher et al 2023), which quantifies least-cost pathways where low-carbon technologies, CDR, and abatement measures for CH4 and N2O are deployed to mitigate climate change given a set temperature target. The net present value of the social surplus (i.e. the sum of consumers surplus minus the energy supply costs and the cost of CH4 and N2O abatement, discounted at a 5% rate) is maximized with perfect foresight, leading to a preference for late spending, including late abatement. GET-ACC2 was developed by integrating the partial-equilibrium energy model GET7.1 (Azar et al 2013, Johansson et al 2020) with the aggregated carbon cycle, atmospheric chemistry and climate model ACC2 (Tanaka et al 2007, Tanaka and O’Neill 2018) (see SM1).
Since ACC2 (Tanaka et al 2007) resolves atmospheric chemistry, such as the production of ozone from methane through OH chemistry also considering pollutants including NOx, CO, and VOC, albeit in a highly parameterized manner, it is well suited to analyze the joint optimization of different GHGs emission pathways (Tanaka et al 2020). Four climate targets cases are considered: 1.5 °C scenarios with medium overshoot (up to 0.2 °C) and high overshoot (no limit) and 2.0 °C scenarios with no overshoot and with high overshoot (no limit). All three overshoot scenarios achieve their respective temperature targets by 2100. We did not consider the case of a 1.5 °C scenario without overshoot as it would require unrealistic near-term reduction of energy demand (Gaucher et al 2022, Tanaka et al 2022).
2.2. A generic MR solution
Detailed modeling of MR processes is beyond the scope of our study. We refer the interested reader to the existing literature (de Richter et al 2017, Oeste et al 2017, Wang et al 2022, Ming et al 2021, Ming et al 2022a, Ming et al 2022b, 2021, Abernethy et al 2023, Li et al 2023, Xiong et al 2023). Due to the lack of data on MR costs and energy requirements, we consider a generic MR characterized by the following two factors: (i) a cost per ton of removed methane c [$/tCH4] and (ii) a maximum annual removal potential p [tCH4/year]. We focus on these two factors because costs and potentials are critical for assessing a technology in the mitigation portfolio and are typically the most assessed characteristics of mitigation options (Mundra and Lockley 2023) including CDR (Fuss et al 2018). MR is optimized on an annual timestep for ACC2, with GET output interpolated from decadal timesteps. We also constrain the growth rate of MR. We thus add the following equations to the model:
where MRC [$] is the annual cost of MR, MR [tCH4] is the annual quantity of methane removed. We assume that the MR (ton CH4/yr) can grow at a growth rate g = 15% yr−1. There is no experience on how fast such technologies can expand, but for comparison, the assumed annual rate is on par with the annual rate of capacity additions of wind power over the last decade, and about 10% units smaller than the annual rate of capacity additions of solar power (IRENA 2024). a is the maximum arithmetic growth rate assumed to be 10 MtCH4 per year, in order to reach full annual potential p within a decade. We deliberately considered a simplistic model of MR as well as a fast growth rate to facilitate the interpretation of our results. We assume that the methane captured by MR will be fully oxidized and converted to atmospheric CO2 and subsequently enter into the carbon cycle of the model, although the added CO2 is almost negligible in terms of its warming effects. In order to compare MR and CDR, we also use a generic CDR based on the same approach considering associated costs and potential (see appendix C), in addition to the BECCS (Azar et al 2013).
2.3. Comparison of BECCS and MR
BECCS was the first large-scale CDR option considered in IAMs (Azar and Lindgren 2003, Azar et al 2006, van Vuuren et al 2007). BECCS became a widely used component of climate change mitigation scenarios long before the first prototypes were built (Köberle AC 2019) because two features made them attractive in models. Firstly, their large CDR potential enabled otherwise infeasible climate targets to be met (van Vuuren et al 2007, Beck and Mahony 2018) by compensating for excess emissions in hard-to-abate sectors and for the delay in emission reductions. In GET-ACC2, this effect can be quantified by the increase of the gross carbon budget, which is the cumulative gross CO2 emissions of the energy system for the period 2020–2100. Secondly, BECCS greatly reduces the costs of stringent mitigation pathways (Azar et al 2013). In GET-ACC2, the costs of achieving climate objectives are quantified as the net present value of the difference between the social surplus (defined as the consumer surplus minus the energy system costs) in the policy scenario and the social surplus in the baseline scenario. It is now well-established that CDR is necessary to achieve net zero emissions and the targets of the Paris Agreement (Babiker et al 2022), although the real-world efficiency of BECCS and other CDR technologies at the scale projected in mitigation scenarios remains unproven. We therefore examine what cost and potential an MR technology should reach in order to have the same role as BECCS, by quantifying the equivalence in terms of induced reduction in policy costs and gross carbon budget for a given climate target. We first perform simulations with BECCS only (without MR) to calculate the total policy cost and the gross carbon budget for each climate target. We then run the model without BECCS (bioenergy without CCS and fossil CCS kept available), but with MR for a wide range of MR potentials and costs for each climate target. Based on the results, we identify an optimal combination of MR potentials and costs that yields the equivalent policy cost and gross carbon budget obtained from the simulation with BECCS. Afforestation is exogenously included in the land-use emissions and is not optimized, and no other CDRs are considered here.
3. Results
3.1. Willingness to pay for MR
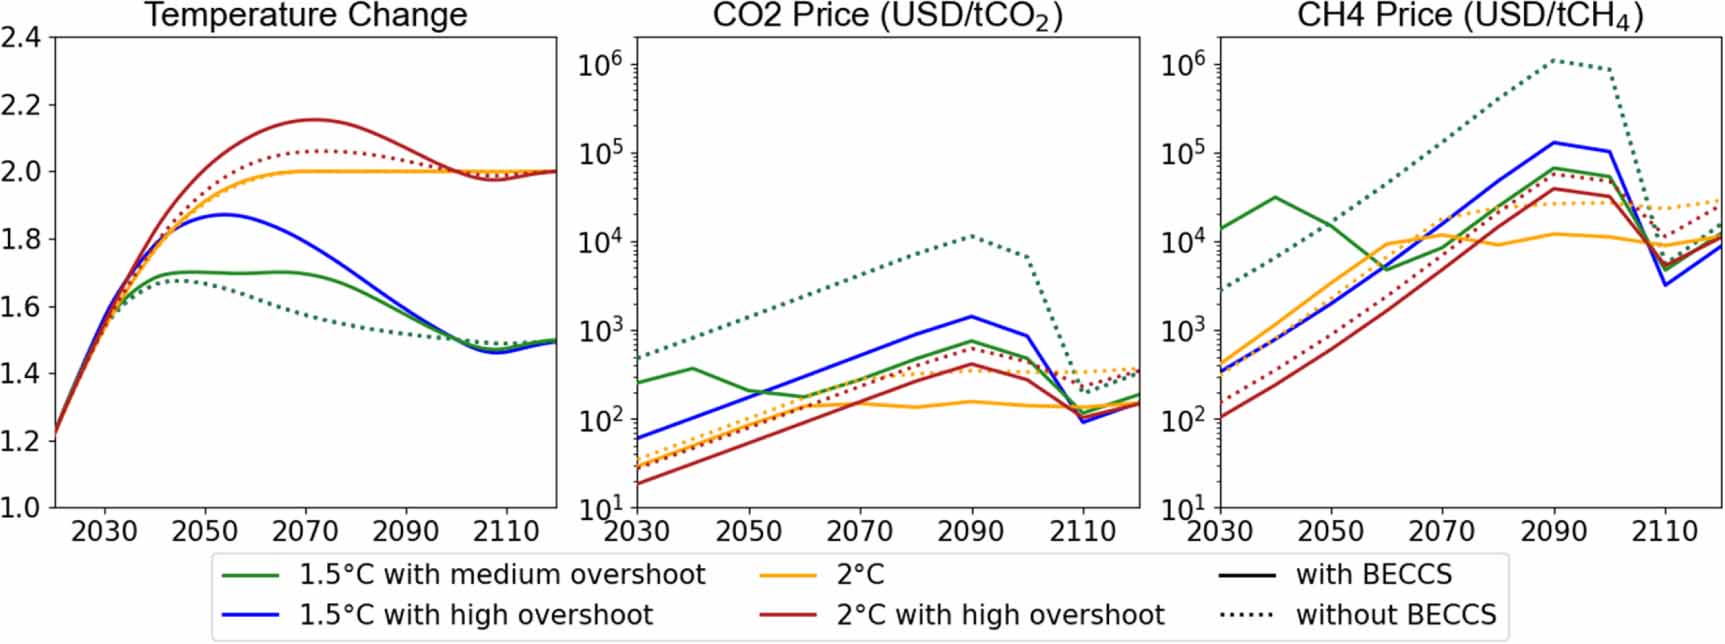
Our model generates the GHG abatement scenario that maximizes the social surplus for a given climate target assuming perfect foresight. Each solution is associated with a ‘shadow price’ time profile for each GHG. MR and CDR are used if their marginal cost per unit negative emission of CH4 and CO2, respectively, are exceeded by the shadow price of CH4 and CO2, respectively. GHG prices rise until the temperature constraint becomes binding (Johansson 2012). The shadow price of carbon grows exponentially with time, approximately with a growth rate equal to the discount rate, while the price of methane grows even faster than the carbon price, increasing by several orders of magnitude over the century (figure 1). This phenomenon mirrors the initially lower but increasing importance of methane abatement as the temperature approaches the target level, due to the short atmospheric lifetime of CH4 (Tanaka et al 2020). This trend is particularly pronounced in overshoot cases, because methane abatement can be delayed without affecting the final temperature, yet at the expense of a higher and longer overshoot (McKeough 2022). The availability of climate change mitigation options changes the GHG prices in a non-linear way. In the 1.5 °C scenario with high overshoot, the CH4 prices are almost one order of magnitude higher when BECCS is not available (figure 1), which increases the willingness to pay for MR accordingly. In the 1.5 °C scenario with medium and high overshoot without BECCS, the maximum temperature of 1.7 °C is not reached; as a consequence, the prices are the same. In this case, the near-term methane price is higher in the case with BECCS than in the case without BECCS. It underlines the dependence of the methane price on the temporal proximity of reaching the temperature constraint.
Figure 1. Least-cost temperature and GHG prices pathways for different climate target cases across the 21st century. Solid lines: with BECCS. Dotted lines: no BECCS (nor any other GHG removal). In that case, 1.5 °C with low and high overshoots are identical.
Download figure:
Standard image High-resolution image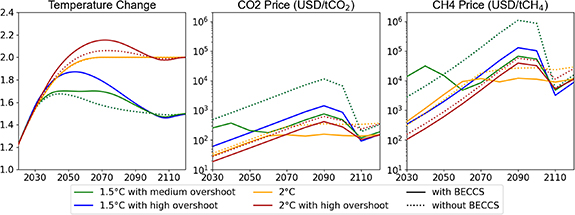
3.2. Equating BECCS with MR
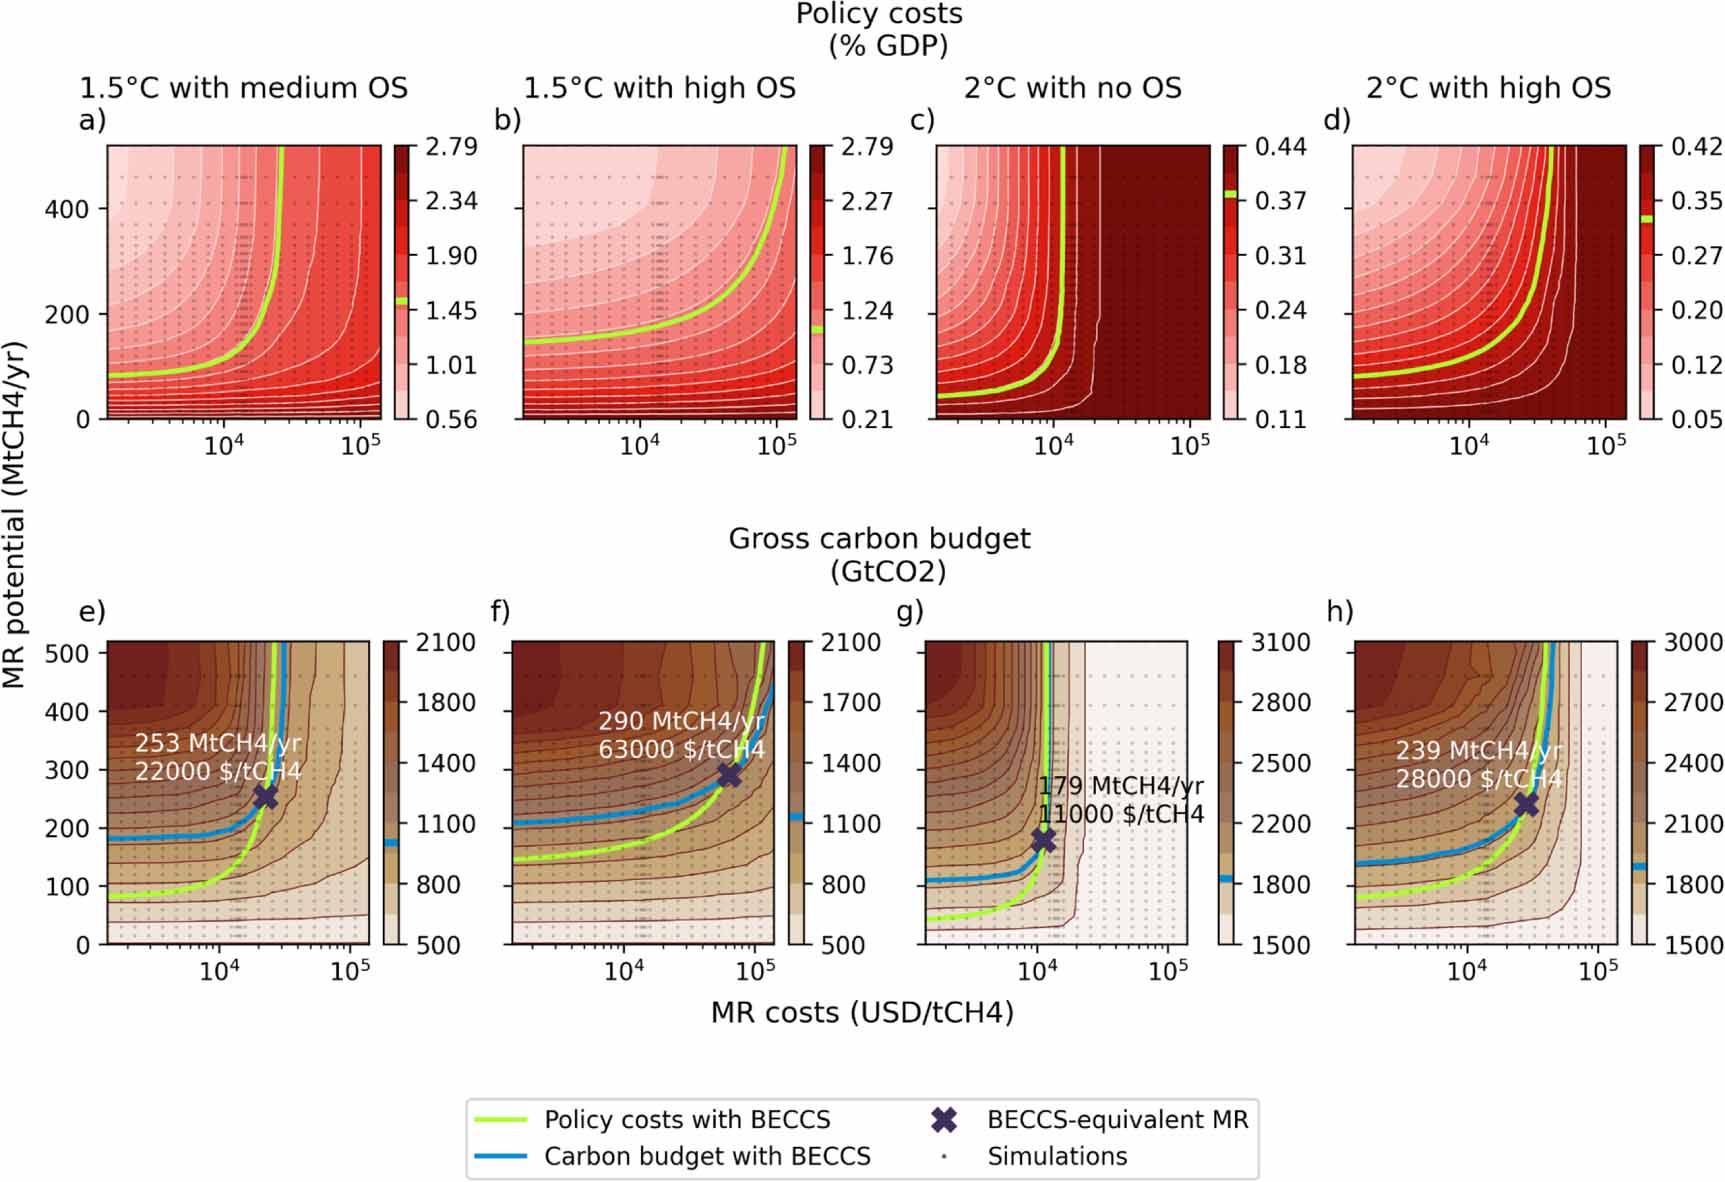
Figures 2(a)–(d) displays the policy costs for a range of MR unit costs and annual removal potentials, and shows that policy costs increase with decreasing MR potential and increasing MR unit cost. Policy costs are maximal and constant when MR costs become higher than the peak shadow price of methane in the no-BECCS case (dotted lines in figure 1). The gross carbon budget is also displayed on figures 2(e) and (f), and behaves in the opposite way: the higher the MR potential and the lower its cost, the higher the gross carbon budget.
Figure 2. Policy costs and gross carbon budgets across the 21st century depending on the MR costs and potentials for different climate target cases (in comparison to those with BECCS). X-axis (log scale): unit cost of methane removal, in USD per tCH4. Y-axis: maximum annual rate of methane removal, in MtCH4 per year. Top panels (a)–(d): the color corresponds to policy costs, defined as the net present values of future energy production costs, N2O and CH4 abatement costs and consumption losses as a percentage of GDP, compared to the no-policy scenario, obtained for each combination of MR cost and potential. The green curve represents the unit costs and annual removal potentials of the MR technologies that enable to achieve the same policy costs as in simulations with BECCS only (without MR). Bottom panels (e)–(h): The color corresponds to the gross carbon budgets, defined as the cumulative CO2 emissions across the 21st century excluding CO2 emissions from land-use and CDR. The blue curve represents the unit costs and annual removal potentials of the MR technologies that enable to obtain the same gross carbon budget as in with BECCS only (without MR). The intersection with the green curve, marked with a cross, indicates the cost (in $/tCH4) and potential (in MtCH4/year) of an MR technology that becomes equivalent to BECCS when the policy costs and the gross carbon budget are considered together. The black dots are the data points from the simulations, between which the policy costs and the carbon budgets are interpolated.
Download figure:
Standard image High-resolution image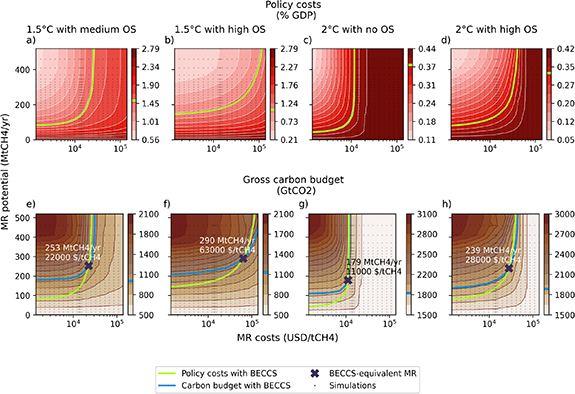
The costs and potential of the MR technology that would play the same role as BECCS (with regard to policy costs and gross carbon budgets) depend on the temperature target. The required MR potentials range between 179 MtCH4 per year (5GtCO2eq, using GWP100 for conversion), which is higher than current methane emissions from the agricultural sector, and 290 MtCH4 (8 GtCO2eq) per year, which is about 80% of the current global total anthropogenic emissions. The CO2-equivalents of these potentials are lower than the potential of BECCS in the model, around 15GtCO2/year, which is in the higher range of literature estimates (Fuss et al 2018). MR costs range from 11 000$/tCH4 (393$/tCO2eq based on GWP100) to 63 000$/tCH4 (2,250 $/tCO2eq based on GWP100). These costs are upper limits for MR to be as efficient as BECCS, and their CO2-equivalents are above the cost of BECCS in the model, around 170$/tCO2. GWP100 should therefore not be used to compare the cost-effectiveness of MR and CDR. The cost-effective conversion metric based on our calculations, which is assumed to be time-invariant, is higher than the GWP100 value (i.e. 28 (Szopa et al 2021)), close to or higher than GWP50, and path-dependent. For the potential, we obtain 59, 52, 84, and 63, and for costs we obtain 130, 370, 65 and 165 for 1.5 °C with medium OS, 1.5 °C with high OS, 2 °C with no OS, and 2 °C with high OS, respectively. These estimates further indicate that the cost-effective metrics to compare potentials are GWP38, GWP45, GWP20, GWP34, respectively. For removal costs, it corresponds to GWP32 for 2 °C with no OS. For the other pathways, there is by construction no time horizon that can give the desired GWP value (Tanaka et al 2020). These MR costs are also above recent estimates of the social cost of methane (Azar et al 2023) (4000–9000 $/tCH4 in 2020 depending on the scenario), which is therefore too restrictive a threshold to assess the future cost-effectiveness of MR if the role of MR is to replace BECCS used to achieve the climate targets considered here. MR technologies are currently in an early stage of development. However, targeted costs are within a range of approximately 100–1000$/tCO2eq (2800–28 000$/tCH4). For MR technologies involving the emission of chlorine atoms into the atmosphere, costs could potentially decrease to as low as 2–50$/tCO2eq (60–1400 $/tCH4, Ming et al 2022a). If these targeted costs are met, they will be cheaper than the BECCS-equivalent cost thresholds. However, the likely potentials are still unknown.
The equivalence metric presented here indicates whether BECCS is outperformed by an MR technology depending on its unit cost and potential, for a given climate target. It should be noted that adding a new CDR in the mitigation portfolio may allow a significant space for the CO2 budget with a small reduction in policy costs for a given temperature target (e.g. if its cost is close to the marginal carbon price), and in that case the green and blue curves in figure 2 might not intercept. In that case, the area above the two curves still represent the MR technologies outcompeting this CDR, yet the latter does not have an ‘equivalent’ with regards to these two metrics. In our model, this can happen for direct air carbon capture and storage (DACCS) and enhanced weathering (EW). As EW and DACCS are less cost-effective than BECCS in our model, the set of parameters where MR performs better is larger for these two technologies (see SM3).
Using this metric, we also show that including the positive temperature feedback on natural methane emissions in GET-ACC2 would not improve or significantly change the cost-effectiveness of MR relative to CDR, although such feedback is sometimes used as a justification for developing MR techniques (Boucher and Folberth 2010, Jackson et al 2019, 2021, Ming et al 2022a) (see SM4).
3.3. Emissions pathways
Because of the different lifetimes and radiative efficiencies of methane and carbon dioxide, an MR technology allowing the same carbon emissions and cost reductions as BECCS for a given climate stabilization target has different effects on the pathway to achieve it. We explore them by comparing the pathways with BECCS and with MR. To distinguish between what depends on gas properties and what depends on the way BECCS are modeled, we also introduce a third case of comparison, a generic CDR method whose cost and potential imply the same role as BECCS as defined by policy costs and gross carbon budgets, but share the same constraints as MR, see (E.1)–(E.4). Its cost and potential thus also depend on the climate target case. The comparison with the generic CDR is essential to ensure that the differences between MR and CDR are not influenced by the specific features of BECCS, as its deployment is constrained by its interactions with the energy system.
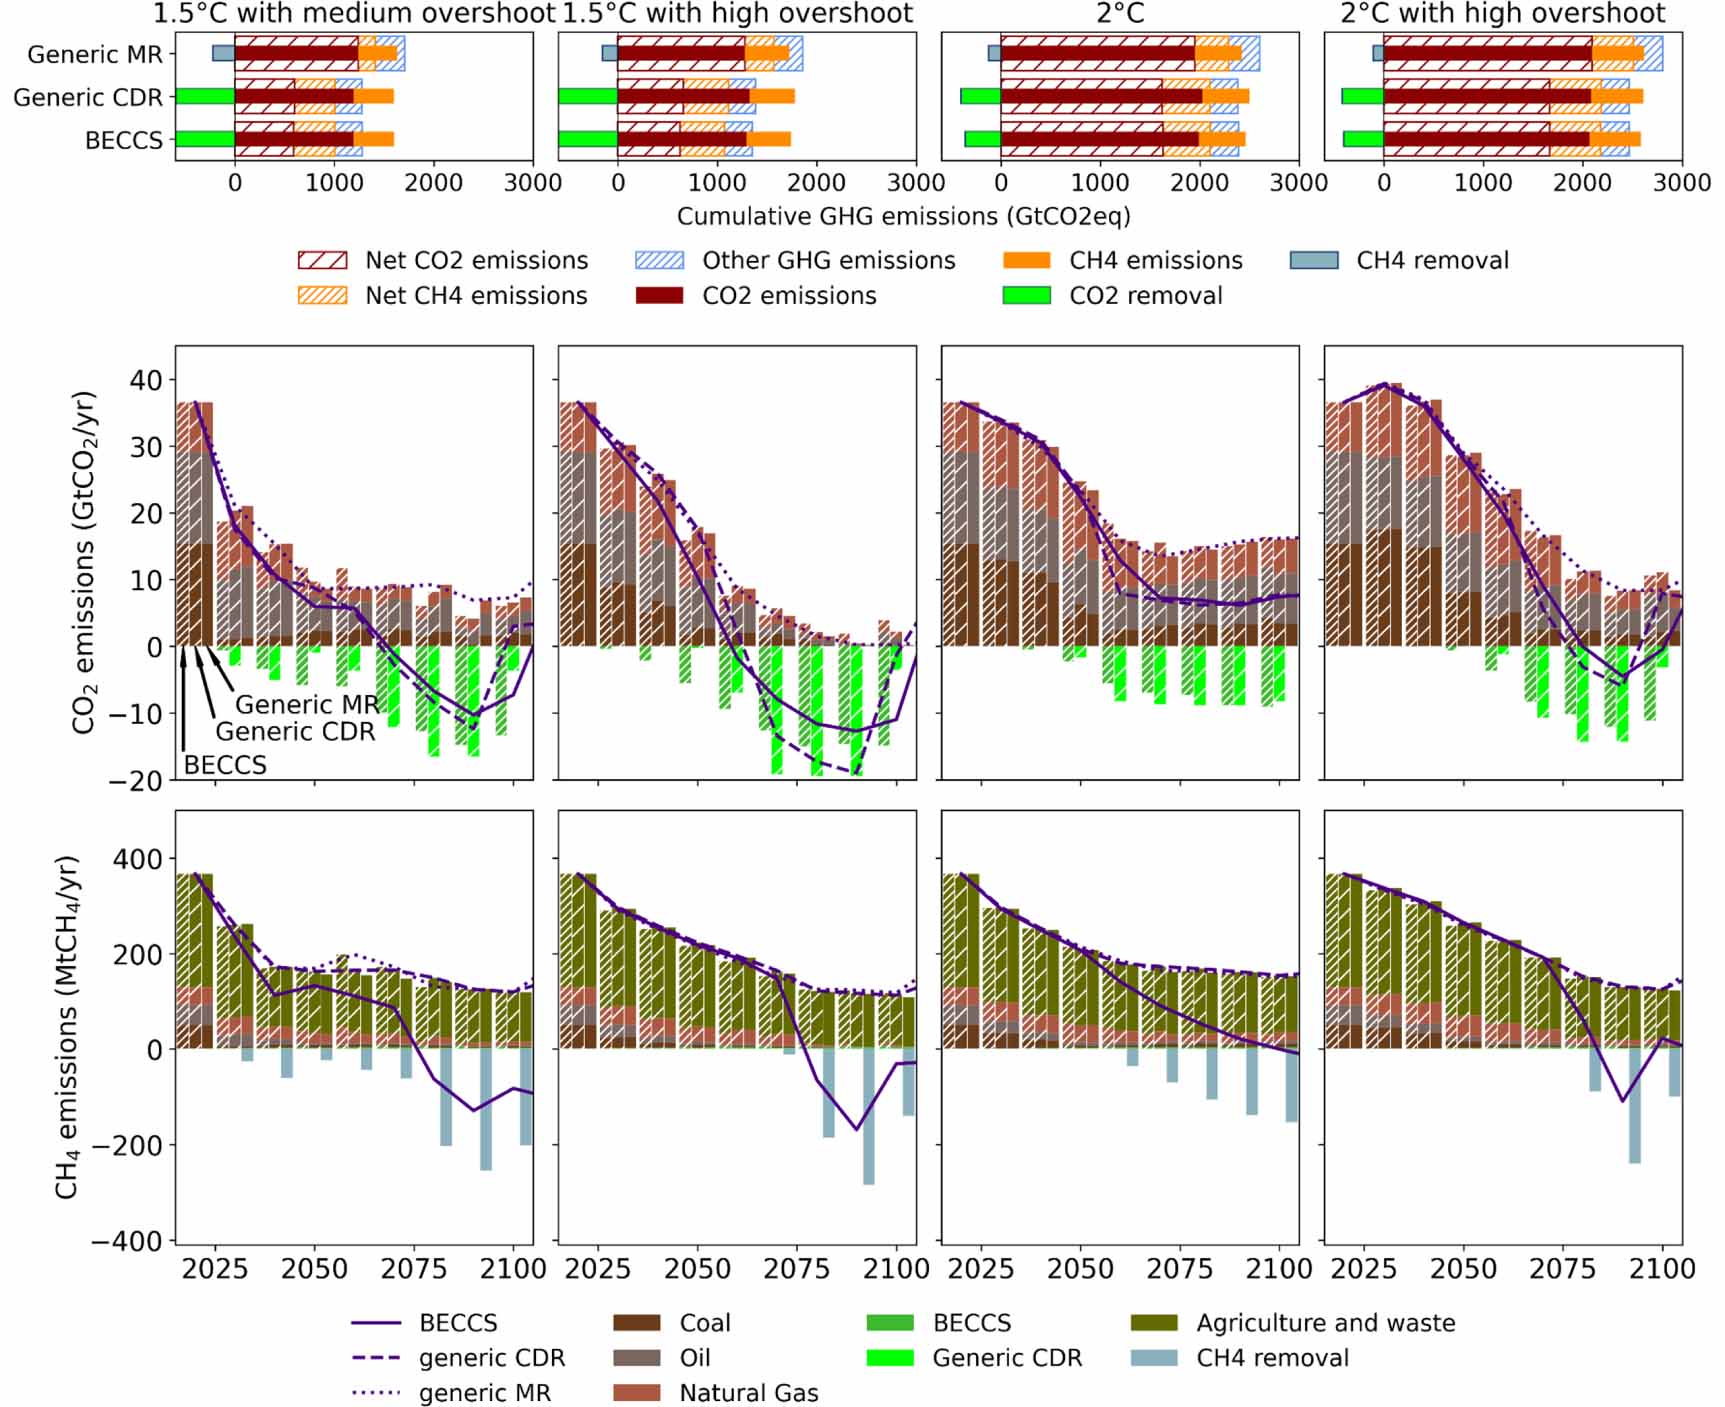
The cumulative CDR is much higher than the GWP100-based CO2-equivalent cumulative MR in all climate target scenarios (figures 3(a)–(d)). MR is used later than CDR, in particular in high overshoot scenarios (figures 3(e)–(l)), and net CH4 emissions reach net-negative levels before 2100 in all MR scenarios except the 2 °C without overshoot case. In this latter case, gross emission pathways of methane and CO2 are very close for the MR and CDR cases. The gross CO2 emission pathways differ between the MR and CDR cases in the other climate target scenarios: in the end of the century, the gross CO2 emissions with MR are much higher in the 1.5 °C with medium overshoot case, and lower in the two high overshoot cases, with almost zero CO2 emissions in the 1.5 °C with high overshoot case. Compared with other GHG capture methods, the use of BECCS is projected to grow more gradually throughout the 21st century. The pace of the deployment of BECCS is slower due to limited annual growth in geological carbon sequestration capacity and also in energy supply technologies in GET. Once investments in bioenergy supply technologies have been made, low operating costs justify continued use and CO2 sequestration throughout their lifetime, even during temporary declines in carbon prices, such as in the 1.5 °C with medium overshoot case when the temperature stabilizes and before the temperature declines (figure 1). As a consequence, the net CO2 emissions reductions of the generic CDR case are slightly delayed compared to the BECCS case.
Figure 3. GHG emissions across the 21st century for three different GHG removal technologies (a) generic CDR without BECCS, a generic MR without BECCS, and BECCS and different climate target cases, in GtCO2eq based on GWP100. First row (a)–(d): cumulative GHG emissions from 2020 to 2100. Second row (e)–(h): CO2 emissions across the 21st century excluding land-use. Lines represent net emissions. Third row (i)–(l): CH4 emissions across the 21st century. Lines represent net emissions.
Download figure:
Standard image High-resolution image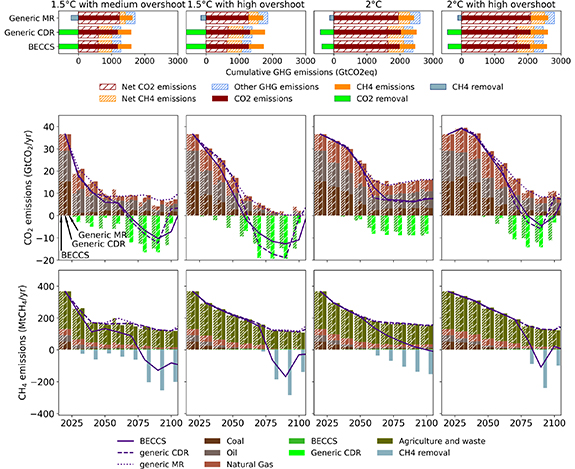
3.4. Policy costs and equity
Cumulative policy costs until 2100 are equal by design for the different GHG removal technologies, but their distribution across the 21st century can be affected by the technology portfolio. In the first place, BECCS enables the high overshoot scenarios (figure 1), in which the costs borne by future generations can be higher than in no-overshoot scenarios (Emmerling et al 2019). Substituting BECCS with MR in high overshoot scenarios further shifts the balance between near-term and long-term efforts because MR is used later than CDR (figures 4(a)–(d)). However, determining whether this results in a more or less equitable situation requires to consider several conflicting factors: future generations will be richer under the scenario assumptions based on the SSP2 baseline (Bertram et al 2021) thereby easing the effort required in relative terms, but they will also face higher climate damages which are not included in the scenario (Thiery et al 2021) and to which they have not themselves contributed.
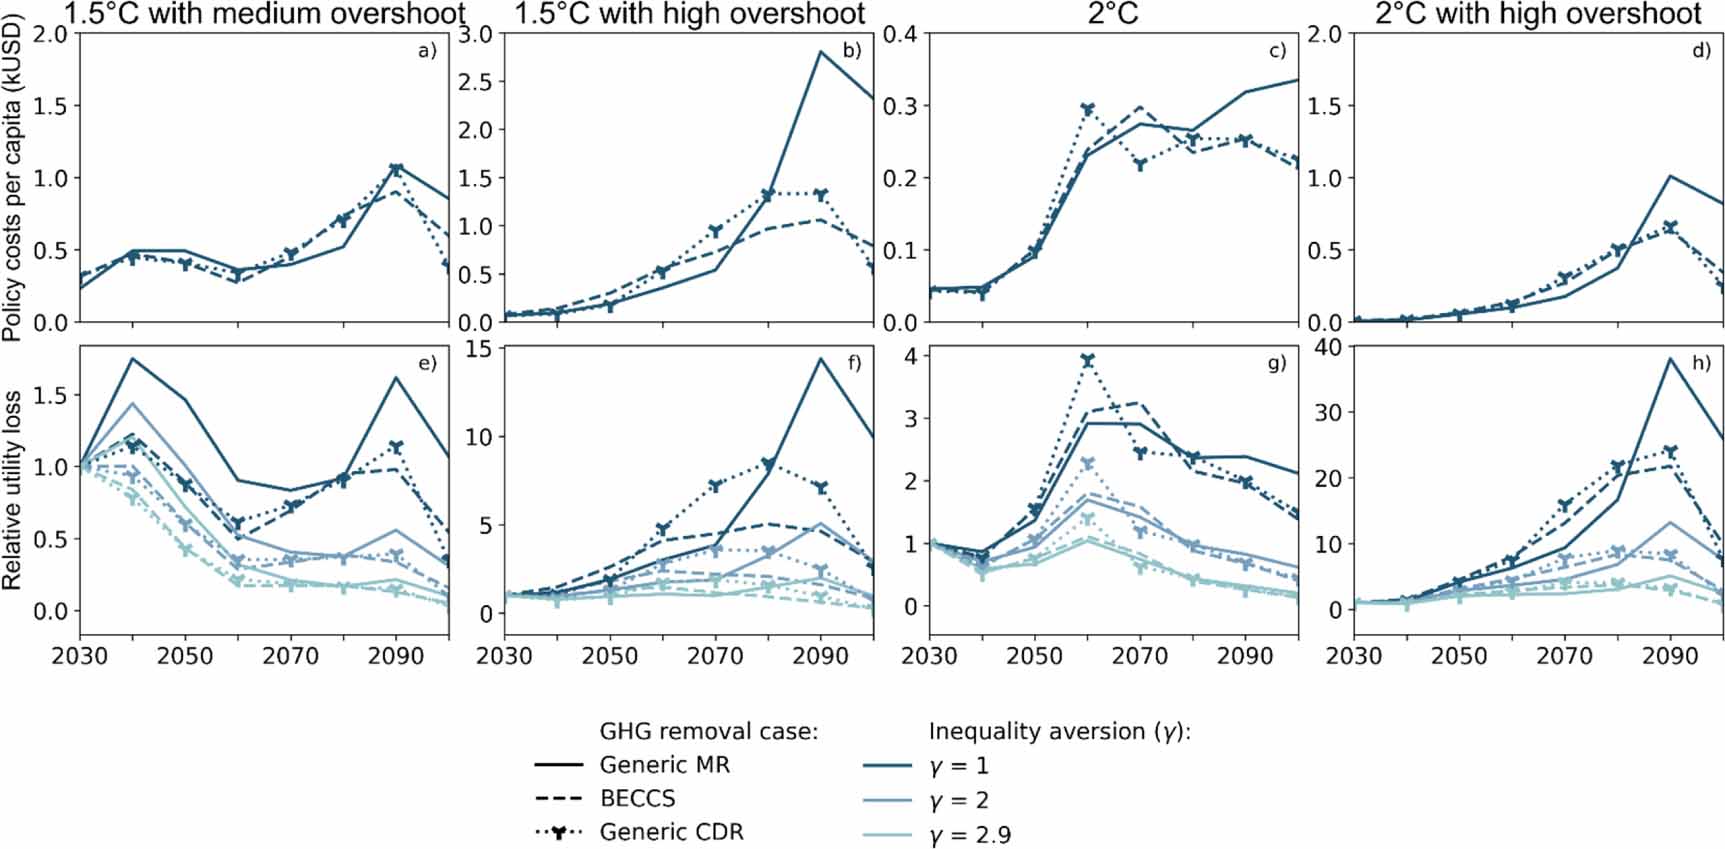
Figure 4. Top panels (a)–(d): per capita annual policy costs across the 21st century. Policy costs are the future energy production costs and consumption losses, compared to the no-policy scenario. Bottom panels (e), (f): evolution of the utility loss (relatively to the loss in 2030) for each climate target and for different values of the inequality aversion coefficient γ, assuming that the consumption loss is proportional to the policy costs. The top panels correspond to the case γ = 0 without normalization.
Download figure:
Standard image High-resolution image
Setting aside the issues of climate damages, intergenerational equity in the effort distribution can be assessed from a utilitarian perspective. Here, we assume that utility takes an ‘isoelastic’ form, usually referred to as a constant relative risk aversion (CRRA) utility function, $u{\text{ }}\left( t \right) = \frac{{c{\text{ }}{{\left( t \right)}^{1 - \gamma }} - 1}}{{1 - \gamma }}$, where c is the consumption and $\gamma $ is the elasticity of marginal utility of consumption. If γ = 1, $u\left( t \right) = \ln \left( {c\left( t \right)} \right)$. CRRA is the most frequently used utility function in economics; it assumes that the aversion to (intertemporal) inequality and risk is constant in relative terms for different consumption levels. We assume that the consumption loss is proportional to the policy costs computed by the model (see appendix C). Following the Ramsey equation (Ramsey 1928), the discount rate r satisfies: $r = \rho + \gamma g$, where $\rho $ is the rate of time preference, and $g{\text{ }}$ is the average growth rate of per capita consumption (1.7% p.a. in the SSP2 baseline). The discount rate ($r$ = 5% p.a.) used in the optimization is exogenous and was chosen for consistency with the model that produced the base scenario (MESSAGEix). Therefore, the values for $\gamma $ consistent with the assumed values of the discount rate and of the per capita growth rate range from $\gamma $ = 0, corresponding to a linear utility function, neutrality to inequality and a strong time preference rate of $\rho $ = 5% p.a. and $\gamma $ = 2.9 defining a strongly concave utility function, i.e. strong aversion to inequality and a preference rate $\rho = $ 0% per year.
In high overshoot scenarios, the annual utility loss increases sharply towards the end of the century with MR, for all values of $\gamma $, whereas this is only true for $\gamma $ values below or equal to 1.5 with CDR technologies (figures 4(e)–(h)). The effort distribution in the 1.5 °C with medium overshoot cases is relatively independent of the GHG removal technology. In the 2 °C scenarios without overshoot and with BECCS, the costs and utility losses peak in the 2060s. MR flattens the effort distribution in terms of relative utility impact. However, this is also the case for the generic CDR, implying that the reason is not inherent in MR, but rather in the slower growth of BECCS (as discussed in section 2.2 we assume an optimistic maximum deployment rate for MR and the generic CDR technology), which requires earlier deployment and earlier emission reductions. From the perspective of intertemporal utility, MR therefore appears to be a less equitable strategy than CDR in cases of cost-effective pathways with high overshoot, which could undermine its social acceptability, if inequality aversion is less than $\gamma $ = 2.9 or if economic growth is lower than assumed. However, as shown in the figure, the more inequality-averse a society is, the less problematic this becomes, since the society in the SSP2 scenario will be much better off towards the end of the century compared to the current generation. The used inequality aversion assumed here can be contrasted with values for the elasticity of marginal consumption recommended by independent experts (1 $ \unicode{x2A7D} \gamma \unicode{x2A7D} $ 2, Nesje et al 2023).
Equity and justice issues go beyond this intertemporal utility calculation. Both MR and CDR are associated with their own risks, notably for future generations. CDR requires storage and stewardship of storage, which poses a risk of leakage, in particular for nature-based solutions such as soil carbon sequestration, afforestation and reforestation or biochar (Prado and Mac Dowell 2023). Similarly, MR must continue, once it has started, in order to maintain a low atmospheric concentration of methane: if it is stopped, the effects of the MR fade away in around ten years and the temperature rapidly rises to the level it would have had without MR. This issue is analogous to the termination issue of solar radiation management which, if terminated unintendedly, say due to a lack of governance, could lead to an abrupt large rebound of temperatures (Parker and Irvine 2018, Lee et al 2021). The same principles of environmental and climate justice must guide MR and CDR, and these include ensuring a fair decision-making process that actively involves all affected communities (Batres et al 2021), notably in order to limit possible negative externalities. For instance, simulations of methane oxidation enhancement by chlorine or hydroxyl radicals indicate that it could increase air pollution (Horowitz 2024), and that chlorine injection could further reduce stratospheric ozone in the Antarctic region (Li et al 2023). The burden of deploying these technologies must also be fairly distributed. While it remains unclear whether MR potential, like CDR, is unevenly distributed geographically (Strefler et al 2021), any such regional disparity could raise questions of historical responsibility with regard to global warming (Skeie et al 2017).
4. Conclusion
To fill the knowledge gap on the use of MR technologies in cost-effective mitigation pathways, we pursued the inherent differences and similarities of MR and CDR. As process-level and economic data on MR technologies are lacking today, we used a top-down approach to constrain the necessary costs and potentials for MR to become competitive with BECCS, based on two metrics: the cumulative gross CO2 budget and the policy costs.
We showed that it was theoretically possible for MR to play the same critical role as CDR on mitigation pathways for the considered metrics. MR could be cost-effective for unit costs up to 62$/kgCH4, but the removal potential needs to reach several hundred Mt CH4 per year to replace BECCS. Yet it is not known whether such removal levels can be achieved sustainably. Our cost-effective scenario results indicate that the deployment of MR is further delayed than the deployment of CDR, in particular in overshoot scenarios. As a consequence, an MR technology that delivers the same gross CO2 budget and cost savings as BECCS could make the intergenerational effort distribution less equitable than CDR in high overshoot scenarios. Assessing other aspects of MR such as possible interactions with the energy system, atmospheric chemistry feedbacks or environmental impacts would require further analyses considering relevant processes in detail.
The accuracy of these general results for a specific MR technology depends on how closely it aligns with our simple modeling assumptions, especially those concerning constant MR costs. However, non-linear, concentration-dependent costs are likely. For instance, it was shown that existing active methane oxidation technologies such as thermo-catalysts, photo-catalysts, electro-catalysts and biofilters are too energy-intensive to oxidize methane cost-effectively at atmospheric concentrations (Abernethy et al 2023) but that they could be deployed over methane point sources, where the concentration is very high (Nisbet-Jones et al 2021). A recent assessment of concentration-dependent oxidation costs has shown that, at current atmospheric concentrations, the costs of three MR technologies (photocatalysis, thermal-catalysis, and biofiltration) are several orders of magnitudes above the thresholds that we calculated (Hickey and Allen 2024). Methane abatement elsewhere may also render these technologies costlier if atmospheric methane concentration decreases, counterbalancing possible learning effects. Non-linear costs are also to be expected for methods that enhance atmospheric methane oxidation by increasing OH (Wang et al 2022) or Cl sinks (Oeste et al 2017, Li et al 2023). For instance, recent research (Li et al 2023) indicates that chlorine emissions must exceed a threshold of 90 Tg yr−1 in order to reduce atmospheric methane concentration. However, the general state of knowledge is still in its infancy and the possible side-effects are too large for an economic assessment to be relevant at this stage. Furthermore, while not addressed in this study, the risks of large-scale failure of MR and CDR technologies should not be overlooked. Their deployment must not delay near-term emission reductions to prevent exacerbating future carbon lock-in (Anderson and Peters 2016, Anderson et al 2023).
Finally, targeting methane is also a way to mitigate near term warming: methane emission reductions can reduce temperatures while CO2 emission reductions cannot (Allen et al 2022). MR could strengthen this possibility. In our scenarios, MR is used to quickly reduce temperature after overshoots, but not to mitigate near-term warming. Near-term mitigation could be a more salient feature of MR with alternative scenario assumptions: for instance, assuming fixed energy demand, our model cannot solve the 1.5 °C case with medium overshoot with either BECCS or generic CDR, while it can be solved if MR is available with a potential above 200 MtCH4 per year from year 2030 (representing two thirds of current anthropogenic methane emissions), highlighting the possible use of MR for shaving the temperature peak. However, MR processes are still at a very early stage, their achievable costs, potentials and side-effects are still unknown. It is therefore rather unlikely that they play such a significant role in the near-term.
Acknowledgment
We acknowledge the European Union’s Horizon Europe research and innovation programme under Grant Agreements N° 101056939 (RESCUE—Response of the Earth System to overshoot, Climate neUtrality and negative Emissions). K T was supported by the Achieving the Paris Agreement Temperature Targets after Overshoot (PRATO) project under the Make Our Planet Great Again (MOPGA) program funded by the National Research Agency in France under the Programme d’Investissements d’Avenir, Grant Numbers ANR-19-MPGA-0008. D J A J was supported by the Swedish Energy Agency, Project Number 2021-00067.
Data availability statement
The data that support the findings of this study are openly available at the following URL/DOI: https://doi.org/10.5281/zenodo.13359368.