1. Introduction
Ambient air pollution is an environmental factor that negatively affects human health (Brunekreef and Holgate 2002). The major component of air pollution is fine particulate matter with a diameter of ⩽2.5 μm (PM2.5), which can originate from a variety of anthropogenic and natural sources (Lim et al 2012). Due to its small size, PM2.5 can be deposited deep into the lungs where it induces oxidative stress and the onset of respiratory diseases, which can lead to premature mortality (Shiraiwa et al 2017, Silva et al 2017, Chowdhury et al 2018). Studies from the last few decades conducted using increasingly larger cohorts have shown that PM2.5 exposure is associated with risk of non-accidental disease and mortality (Cooke et al 2007, Puett et al 2009, Burnett et al 2014). There were an estimated 4.2–8.9 million deaths associated to annual mean PM2.5 globally in 2015 (Cohen et al 2017, Burnett et al 2018, Lelieveld et al 2018).
Fire, including landscape fires, deforestation fires, and agricultural waste burning, contributes to around 4% of global ambient PM2.5 as direct or precursor aerosol emissions (McDuffie et al 2021). The most important gases and aerosol species emitted by fire with respect to human health is carbon dioxide, carbon monoxide, nitrogen oxide, non-methane volatile organic compounds, black carbon, and organic carbon (Voulgarakis and Field 2015). Fire-PM2.5 accounted for 4%–21% of premature deaths related to annual mean PM2.5 exposure during 2016–2019 (McDuffie et al 2021, Roberts and Wooster 2021). Wildfire-PM2.5 accounted for 0.62% of all-cause deaths associated with daily PM2.5 exposure during 2000–2016 (Chen et al 2021).
Fire activity and its emissions change in response to climate and socioeconomic factors (Naeher et al 2007), which vary over time. For example, until 1750, global fire activity decreased in concert with a global cooling (Marlon et al 2008). However, since the start of the Industrial Revolution, anthropogenic factors have been the primary determinants of fire activity, and in the early 20th century, population increases and industrialization resulted in substantial land-use changes, which in turn led to increased fire emissions (Arora and Melton 2018). Then, in the mid-20th century, fire emissions decreased as a result of reduced fuel loads as a consequence of increased wood harvesting and cropland expansion (Kloster et al 2010, Andela et al 2017), although extreme drought conditions associated with climate change markedly increased fire activity in the final three decades of the century (Kloster et al 2010). Changes in relative humidity and temperature have also contributed to increases in global extreme fire weather (Jain et al 2021).
The impacts of fire on air quality and health are also affected by climate change. In Amazon, fire emissions were 1.5–2.8 times greater during drought years in the period 2001–2012 (Reddington et al 2015). Recently, an unexpected drought in Australia in 2019–2020 lead to nine times greater health costs than that estimated for fires prior to 2019 (Johnston et al 2021). In the 21st century, ambient PM2.5 is expected to reach dangerous levels in many regions during fire season (Knorr et al 2017). It will therefore be necessary to identify the health burden associated with fire under diverse scenarios.
Most previous studies on the health burden of fire have been conducted at the regional/country level and have examined the historical period. In North America, previous studies have shown that fire associated annual mortality is 8700–28 000 deaths in the US and 570–2500 deaths in Canada (Yao et al 2016, Jones and Berrens 2017, Liu et al 2017, Fann et al 2018, Matz et al 2020). In the Amazon, the mortality associated to fire smoke decreased up to the year 2012 as a result of reduced deforestation (Reddington et al 2015). In Equatorial Asia, mortality associated to annual mean PM2.5 emitted from peat fires was 44 040 and the impact of El-Niño on mortality due to daily PM2.5 exposure was 11 880 deaths in 2015 (Crippa et al 2016, Kiely et al 2020). In European 27 countries, daily PM2.5 related mortality has been calculated as 1080 and 1483 per year in 2005 and 2008, respectively (Kollanus et al 2017). Two previous studies have examined global mortality associated to annual mean fire-PM2.5: Johnston et al (2012) reported that around 339 000 annual deaths associated to fire spanning the period 1997–2006, and Roberts and Wooster (2021) reported that around 677 745 annual deaths associated to fire for the period 2016–2019. Despite these previous studies, there remains an information gap in the literature regarding future global mortality associated with fire-PM2.5.
Here, we estimated present (2010s) global mortality associated with annual mean fire-PM2.5 and the projected values for the 2050s and 2090s under a diverse set of future scenarios. Our results show the ranges of potential future fire-PM2.5 mortality that can be expected depending on future climate and socioeconomic changes. This study provides insights regarding the inter-country changes in mortality under the different future scenarios.
2. Methods
Fire-related PM2.5 emissions and their associated mortality were estimated for the present period (2010s, 2011–2020) and projected for two future periods (2050s [2051–2060] and 2090s [2091–2099]). The analysis comprised three steps: (1) simulation of fire emissions using a global fire model, (2) simulation of surface PM2.5 concentrations with and without fire, and (3) simulation of mortality associated with fire-PM2.5 (figure 1). To project future fire-PM2.5 mortality, we simulated with alternative settings for the future changes in fire emissions, population, and baseline mortality. The acronyms used in this study can be found in table 1.
Figure 1. Study flow with main input variables (details of the variables are presented in appendix A). Colored, dashed boxes (yellow, blue, and red) correspond to the simulations presented in sections 2.2–2.4, respectively. Grey boxes indicate the main simulators. MRBRT (meta-regression-Bayesian regularized trimmed model) is the risk curve that was used in the 2019 Global Burden of Disease Study.
Download figure:
Standard image High-resolution image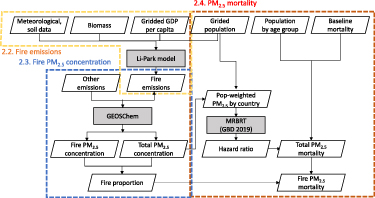
Table 1. List of acronyms.
| Acronym | Description |
|---|---|
| GBD | Global Burden of Disease |
| TMREL | Theoretical minimum risk exposure level |
| BM | Baseline mortality rate |
| IHD | Ischemic heart disease |
| LRI | Lower respiratory tract infection |
| COPD | Chronic obstructive pulmonary disease |
| Group 5 | Highest-income countries |
| Group 4 | High-income countries |
| Group 3 | Mid-income countries |
| Group 2 | Low-income countries |
| Group 1 | Lowest-income countries |
2.1. Future scenarios
The projections were made under 10 potential future scenarios produced by combination of two Representative Concentration Pathways (RCP2.6 or 6.0) with five Shared Socioeconomic Pathways (SSP1–5) (table 2). The two RCPs represent opposite levels of climate change: the global mean temperature increase by 2100 compared with the preindustrial level is kept below 2 °C (RCP2.6) or increased by 3 °C–4 °C (RCP6.0). The five SSPs cover a wide range of changes of population growth, economic development, and land use, which are the major anthropogenic drivers of fire activities. By using these combined pathways, we were able to obtain a potential range of fire-PM2.5 mortality and identify different outcomes among the scenarios.
Table 2. Future scenario dataset.
| Scenario name | Climate variable | Socioeconomic variable | Land use variable |
|---|---|---|---|
| SSP1-2.6 | RCP2.6 | SSP1 | SSP1-2.6 |
| SSP2-2.6 | SSP2 | SSP2-2.6 | |
| SSP3-2.6 | SSP3 | SSP3-2.6 | |
| SSP4-2.6 | SSP4 | SSP4-2.6 | |
| SSP5-2.6 | SSP5 | SSP5-2.6 | |
| SSP1-6.0 | RCP6.0 | SSP1 | SSP1-6.0 |
| SSP2-6.0 | SSP2 | SSP2-6.0 | |
| SSP3-6.0 | SSP3 | SSP3-6.0 | |
| SSP4-6.0 | SSP4 | SSP4-6.0 | |
| SSP5-6.0 | SSP5 | SSP5-6.0 |
a The climate variable includes meteorological, soil, and biomass inputs.
The meteorological, soil, and biomass inputs for fire emissions followed the RCPs and were derived from Global Climate Models (GCMs) in ISIMIP2 (Inter-Sectoral Impact Model Intercomparison Project2) (Thiery et al 2017, Lange 2019). To address the uncertainty range of future conditions projected by the GCMs, we selected two GCMs that bracketed the projected changes in air temperature and precipitation: HadGEM2-ES (greatest global changes of increasing temperature and precipitation) and GFDL-ESM2M (least global changes) (appendix A).
Socioeconomic inputs (population, GDP, and baseline mortality) were simulated following SSPs (SSP1–5). Spatial projections for population and GDP for fire simulations were derived from Jones and O’Neill (2016) and Murakami et al (2021). For the mortality simulation, country-level projections of population were derived from the United Nations World Population Prospects (United Nations 2022) for the historical period and from International Institute for Applied Systems Analysis for the future period (Samir and Lutz 2017). Historical baseline mortality rate was derived from Institute for Health Metrics and Evaluation (IHME 2020), and future changes were derived from the International Futures integrated modeling system (Sellers 2020). Land-use change data for fire emissions were developed based on the 10 SSPs ×ばつ RCPs (SSP–RCP combination) obtained from Fujimori et al (2018). The input variables used for each stage of the analysis are listed in appendix B.
2.2. Simulation of fire emissions
Fire emissions were simulated by using the Li-Park model at 0.5° ×ばつ 0.5° resolution. This model considers natural and human ignitions, fuel load and flammability, and human fire suppression for fire counts, and wind speed for the spread of fire (Li et al 2012). Agricultural fires, peat fires, and fires due to land-use change were statistically simulated in the Li-Park model (Li et al 2013, Park et al 2021). The Li-Park model was chosen because it has been validated against observations and showed low error in spatial distribution (0.86 normalized mean error), and can be used to assess the impact of socioeconomic factors (population, GDP per capita, and land-use change), climate (including soil moisture, temperature, and wind speed), and biomass on fire emissions (Park et al 2023).
After simulating burned area, Li-Park calculated the gases and aerosols emitted from fires by incorporating fuel combustion and burned area. Fuel combustion is determined by biomass and combustion completeness, and combustion completeness is scaled by soil moisture (Park et al 2023). Gas and aerosol emissions were classified into the six types used by the Global Fire Emissions Database (van der Werf et al 2017) by using ecoregion map (Olson et al 2001), peat map (Xu et al 2017), and plant type functions (simulated in CLM4.5).
2.3. Simulation of fire-PM2.5 concentrations
To simulate surface PM2.5 concentrations, we used the GEOS-Chem global three-dimensional model of atmospheric chemistry and transport v13-04; www.geos-chem.org; Bey et al 2001). Surface PM2.5 concentration was simulated at 4° ×ばつ 5° resolution with 72 vertical layers and then downscaled to 0.5° ×ばつ 0.5° resolution by using a first-order conservative remapping technique. The thermodynamics of secondary inorganic aerosols were simulated with the ISORROPIA II package (Fountoukis and Nenes 2007, Pye et al 2010).
Because our aim was to identify health-burden changes from fire-PM2.5 emissions only, the meteorological data (MERRA2 reanalysis meteorological data) and anthropogenic emissions (Fujimori et al 2018) were fixed at the 2010s levels to exclude the effects from these factors (Knorr et al 2017, Li et al 2020).
To estimate the health impacts of annual mean PM2.5, we used yearly mean PM2.5 concentrations. We compared our model results with aggregated Global Burden of Disease (GBD) 2016 year gridded PM2.5 exposure data (IHME 2021) and with PM2.5 data collected by monitoring stations around the world in 2016 (appendix C).
To evaluate avoidable mortality from fire, PM2.5 concentrations were simulated with $\left( {PM{{2.5}_{{\text{fire}}}}} \right){ }$ and without $\left( {PM{{2.5}_{{\text{wofire}}}}} \right){ }$ fire emissions. We assumed that all sources of PM2.5 concentrations have the same contribution to premature deaths. We multiplied fire proportion (equation (1)) by total PM2.5 mortality to calculate fire-PM2.5 mortality, which is the proportion of PM2.5 caused by fire out of total PM2.5 (Ford et al 2018). This method prevents overestimation of fire-related mortality when the hazard function is a logarithmic curve.
2.4. Simulation of PM2.5 mortality
PM2.5 related mortality was calculated as in the GBD2019 study (Murray et al 2020). A hazard ratio was derived for each disease and age group by using the meta-regression–Bayesian regularized trimmed model (MRBRT) (IHME 2021) (equation (2)):
where c is country, i is disease, and j is age group. HR is hazard ratio, PM2.5 c is population-weighted PM2.5 by country, and TMREL is theoretical minimum risk exposure level, which is assumed to be 2.4 μg m−3.
Five diseases were examined: chronic obstructive pulmonary disease (COPD), lung cancer, ischemic heart disease (IHD), stroke, and lower respiratory tract infection (LRI). In addition, the following age groups were used: COPD and lung cancer, adults only (age > 25 years, one group); IHD and stroke, adults only (age > 25 years; 5 y intervals = 15 groups); and LRI, children only (age < 5 years, one group). MRBRT curves use splines with a Bayesian prior to avoid overestimation of risk at high exposure levels (McDuffie et al 2021). The MRBRT model outputs mean and 5th and 95th percentile values via an ensemble approach. We used the proportion of two PM2.5 exposures (ambient outdoor and household air pollutant) as defined by Ghosh et al (2021) because the MRBRT splines created one set of cause-specific risk curves for these two sources of PM2.5.
Avoidable mortality ($Mort$) was calculated at the country, disease, and age group levels (equation (3)):
where $BM$ is baseline mortality rate, and $Pop$ is population. As input data, we used 2011–2019 averaged BM obtained from IHME (2020) (http://ghdx.healthdata.org/gbd-results-tool) for the present simulation (2010s); we multiplied the present BM by the future BM changes for each SSP, as determined by using the International Futures integrated modeling system (Sellers 2020) to obtain the BM for the 2050s and 2090s projections. We then compared the fire-PM2.5 mortality among five country groups based on income; 204 countries were categorized by 2016 GDP per capita (see appendix D for details).
3. Results
3.1. Current fire impacts
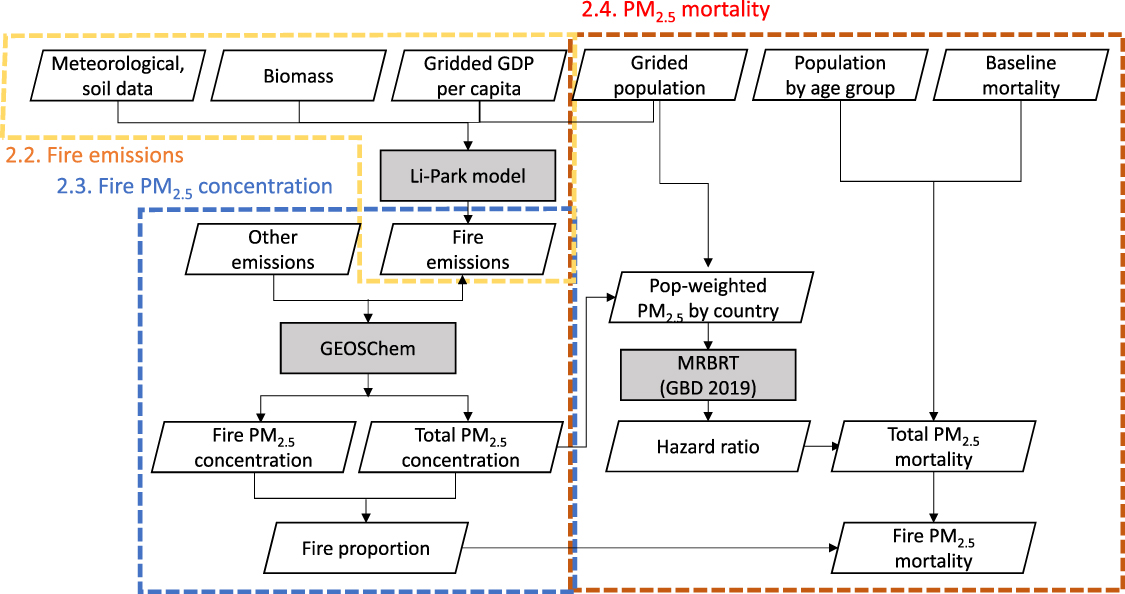
In the 2010s, the global land annual PM2.5 concentration was 20.4 μg m−3. It was slightly higher than the GDB 2016 gridded PM2.5 exposure mean estimate of 18.6 μgm−3. PM2.5 exposure was highest in countries in Asia, the Middle East, east Asia, and Africa (figure 2(a)). When we aggregated the GDB 2016 gridded PM2.5 exposure mean estimate to 4° ×ばつ 5° resolution and compared it with our GEOS-Chem estimates, we obtained a correlation coefficient of 0.82 and a normalized mean bias of 3.4% (figure 2(c)). We also compared our GEOS-Chem estimates with annual surface observations aggregated at 0.25° ×ばつ 0.25° resolution (N = 147) and obtained a correlation coefficient of 0.68 and a normalized mean bias of 34%. The world mean fire-PM2.5 proportion was 8.4%, and its spatial distribution was different from that of total PM2.5; it was highest in Africa, Equatorial Asia, Amazon, and North America (figure 2(b)).
Figure 2. Evaluation of PM2.5 concentration and fire proportion. (a) Annual average PM2.5 concentration in 2016 (with 2010s fire emissions). (b) Fire-PM2.5 proportion. (c). Correlation between the 2016 Global Burden of Disease (GBD) tool PM2.5 exposure at 4° ×ばつ 5° resolution. (d) Correlation between observed annual average PM2.5 concentration (Table S2); average value in each 0.25° ×ばつ 0.25° grid. (e) GBD annual PM2.5 concentration. (f) Observed annual average PM2.5 concentration.
Download figure:
Standard image High-resolution image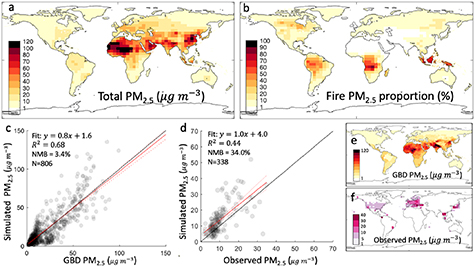
3.2. Fire-PM2.5 mortality
We estimated that 4.15 (3.33–4.92 lower/upper MRBRT estimates in GBD) million deaths associated with annual ambient PM2.5 exposure in the 2010s. By disease, IHD contributed 38%, stroke 34%, COPD 18%, lung cancer 9%, and LRI 2%. These values are consistent with previous estimates obtained by using GBD 2019 risk functions (McDuffie et al 2021).
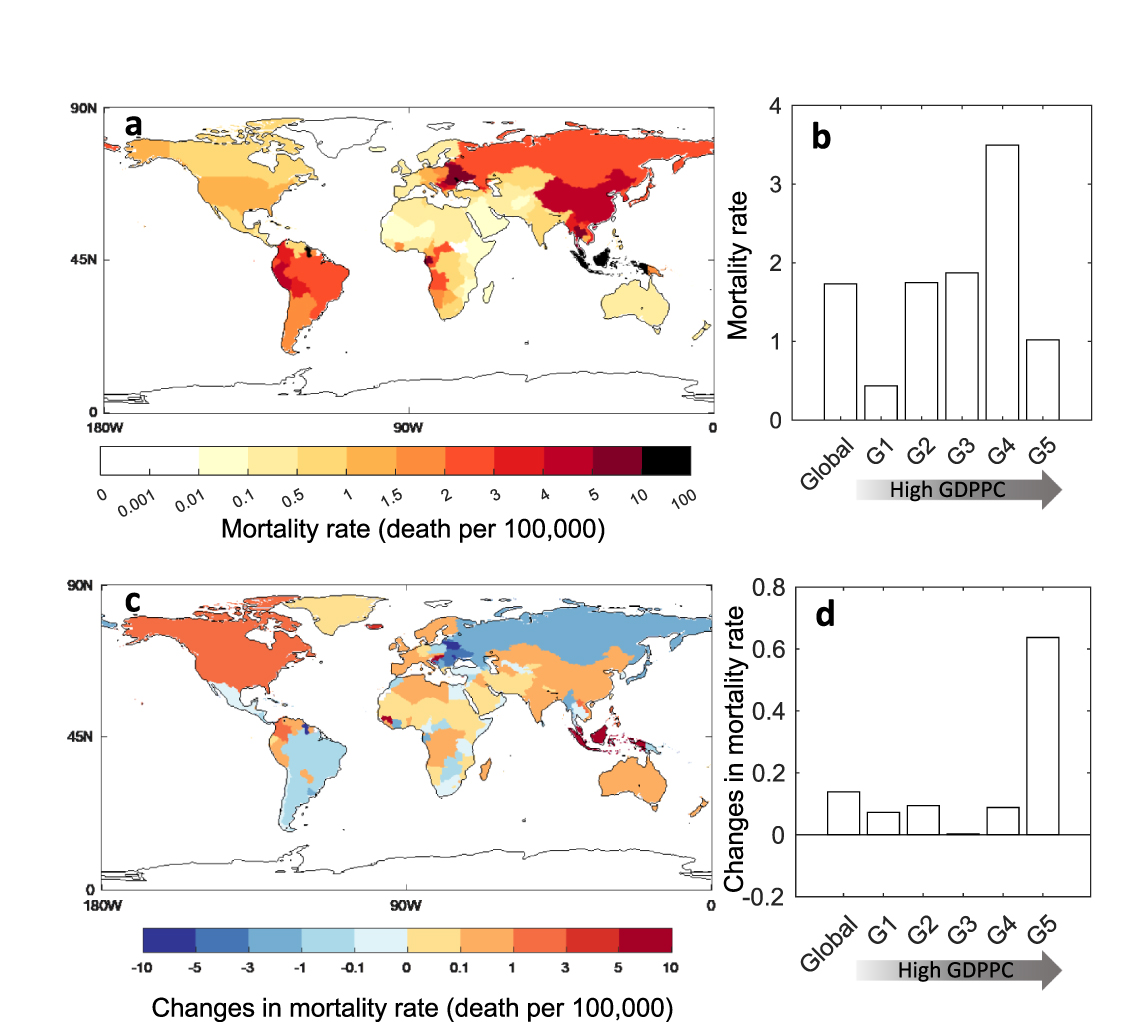
Global fire-PM2.5 mortality was estimated at 135 180 (105 403–163 738) deaths in the 2010s, which is about 3.3% of the total global mortality associated with ambient PM2.5. This indicates a global mortality rate at 1.73 deaths per 100 000 population. The mortality rate of fire-PM2.5 was highest in tropical regions (central Africa, southern Africa, and Southeast Asia), east Asia, east Europe, and Russia (figure 3(a)).
Figure 3. Fire-PM2.5 mortality rate (deaths per 100 000 population) and the changes in 2090s under SSP3-6.0. (a) National-level fire-PM2.5 mortality rate in the 2010s. (b) Fire-PM2.5 mortality rate for groups of countries stratified by 2016 GDP per capita [GDPPC] in the 2010s. (c) Changes in national-level fire-PM2.5 mortality rate in the 2090s under SSP3–6.0 compared to the 2010s. (d) Changes in fire-PM2.5 mortality rate for groups in 2090s under SSP3–6.0 compared to the 2010s. Appendix D shows the countries comprising each group. Rate was calculated by dividing total mortality by total population.
Download figure:
Standard image High-resolution image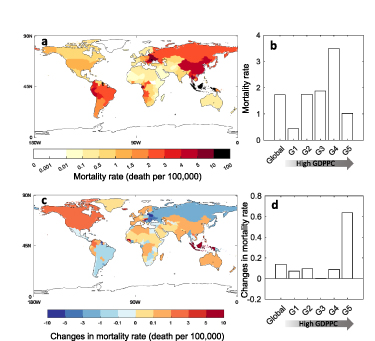
When stratified by GDP per capita into five groups (group 1, lowest GDP; group 5, highest GDP; appendix D), the mortality rate was the highest in group 4 (3.5 deaths per 100 000 population) (figure 3(b)). Malaysia contributed the most to the deaths in group 4 with 15.6 deaths per 100 000 population, followed by Eastern Europe (Lithuania and Romania with 6.8 and 5.9 deaths per 100 000 population, respectively) and then China (with 4.5 deaths per 100 000 population). Groups 2 and 3 had 1.8 and 1.9 deaths per 100 000 population, respectively. In Group 2, the major contributors were Indonesia and Republic of Moldova with 16.7 and 10.7 deaths per 100 000 population, respectively. In Group 3, the major contributors were Guyana, Belarus, and Gabon with 15.5, 8.0, and 7.4 deaths per 100 000 population, respectively. Group 5 had 1.0 death per 100 000 population, and the major contributors were Brunei (8.6 deaths per 100 000 population), East Asia (Republic of Korea and Japan with 3.1 and 2.7 deaths per 100 000 population, respectively), and North America (US and Canada with 1.2 and 1.0 deaths per 100 000 population, respectively). Group 1 had the lowest mortality rate (0.43 deaths per 100 000 population), whereby Myanmar and Democratic People’s Republic of Korea (with 3.6 and 2.9 deaths per 100 000 population, respectively) had the highest values. Current country-level mortality values and their rates are shown in supplementary 2 table.
3.3. Future fire-PM2.5 mortality
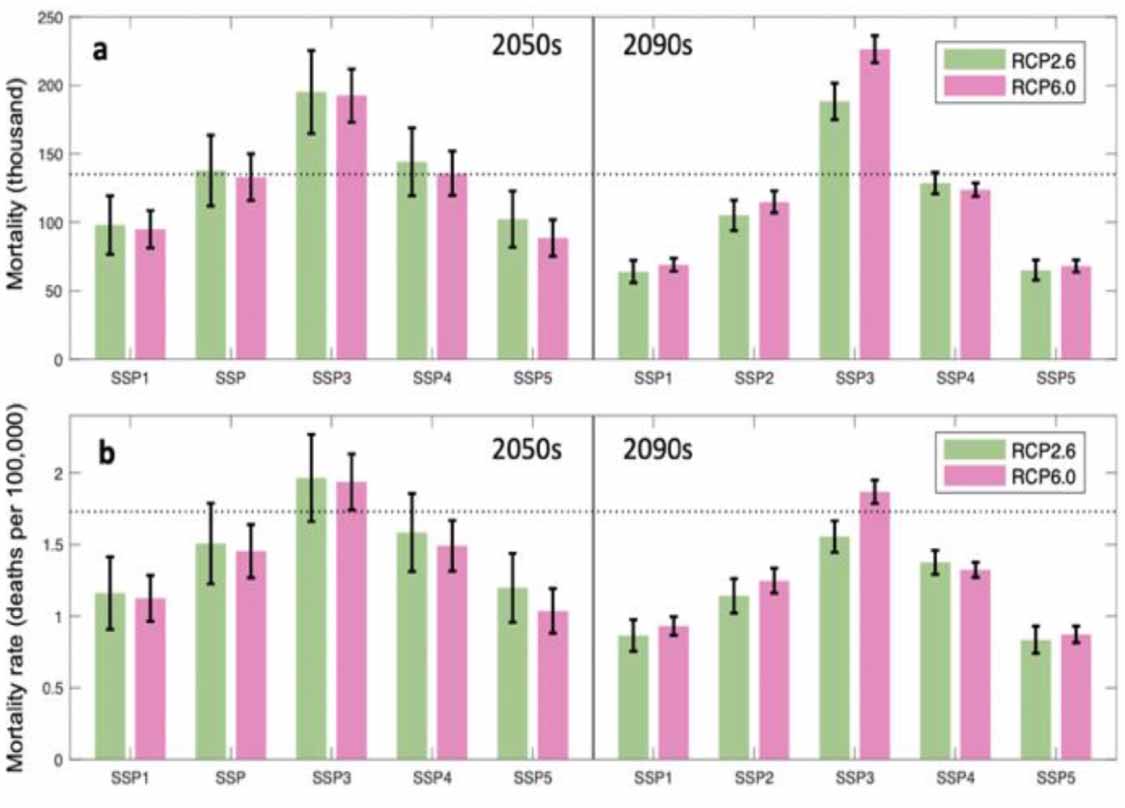
We estimated future fire-PM2.5 mortality using 10 SSP–RCP scenarios. For the 2050s, the mean value of total global deaths (GCM-based means) ranged from 88 611 (SSP5–6.0) to 195 186 (SSP3–2.6); for the 2090s, the estimates ranged from 64 162 (SSP1–2.6) to 226 410 (SSP3–6.0) (figure 4(a)). The mortality rate (GCM-based means) increased only under SSP3 in the 2050s (1.97 [SSP3–2.6] and 1.94 [SSP3–6.0] deaths per 100 000 population) and SSP3–6.0 in the 2090s (1.87 deaths per 100 000 population) (figure 4(b)).
Figure 4. Future estimated global fire-PM2.5 mortality by SSP-RCP scenario. (a) Fire-PM2.5 mortality. (b) Fire-PM2.5 mortality rate. Dashed line indicates the historical value. Bar plots show GCM-based means and the end points of the vertical lines indicate the two GCM values. Each bar represents one SSP-RCP scenario. For instance, the left bar labeled SSP1 in green corresponds to SSP1-2.6.
Download figure:
Standard image High-resolution image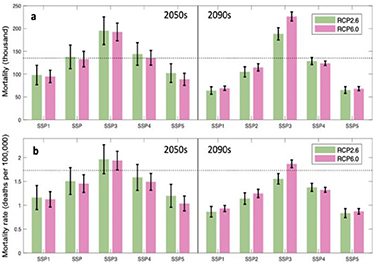
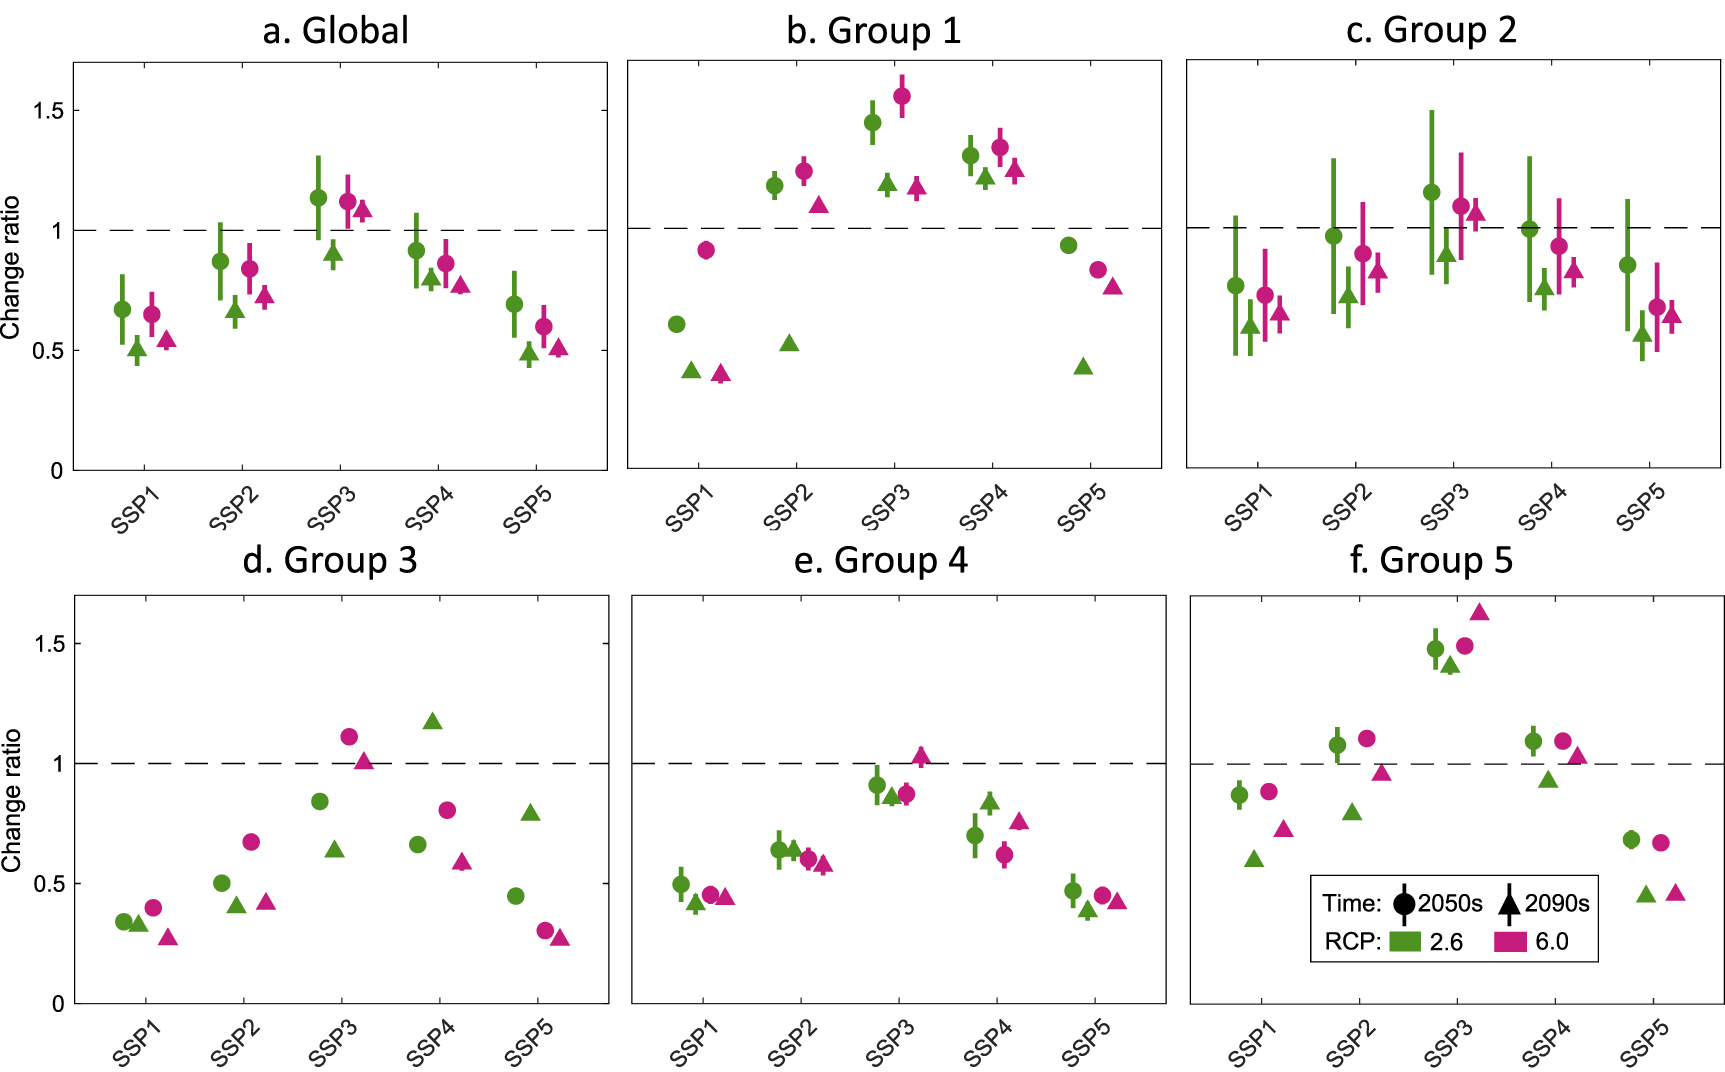
Figure 5 shows the changes in global fire-PM2.5 mortality rate under the 10 SSP–RCP scenarios by the five country income groups. Group 5 (highest-income countries) showed increased mortality rate under SSP3. For example, The fire-PM2.5 mortality rate in Brunei mostly decreased, but increased under SSP3–2.6, SSP4–2.6 and SSP3–6.0 in the 2090s. North America had increased mortality rates under most scenarios. The US and Canada had the highest death rates under SSP3–6.0 (2.6 and 3.4 deaths per 100 000 population, respectively) in the 2090s. In contrast, group 4, the group with the highest fire-PM2.5 mortality, showed decreased values, which resulted from a marked decrease in Eastern Europe. China also showed a decreasing trend, except for under SSP3–6.0 in the 2090s. However, Malaysia had an increased mortality rate, particularly under RCP6.0 in the 2090s (24.5, 22.4 deaths per 100 000 population under SSP3–6.0 and SSP4–6.0, respectively). Group 3 also had a decreased fire-PM2.5 mortality rate, except for under SSP3–6.0 and SSP4–2.6. We found a notable decrease in mortality rate in Guyana and Belarus, but an increased mortality rate in Gabon, particularly in the 2050s, under SSP2, 3, and 4. Group 2 showed a lower mortality rate in the 2090s than in the 2050s because of a large reduction in Eastern Europe (i.e. in the Republic of Moldova and Ukraine) in the 2090s. South Asian countries (i.e., Indonesia and Vietnam) had an increased mortality rate, particularly under RCP6.0 in the 2090s. Group 1 had the lowest mortality rate at both future time points, although Myanmar and Democratic People’s Republic of Korea had an increased mortality rate under SSP4 in the 2090s. Country-level fire-PM2.5 mortality and mortality rate are shown in supplementary 3 table.
Figure 5. Change in future fire-PM2.5 mortality rate (deaths per 100 000 population) compared to the 2010s, by RCP/SSP scenario. The Y-axis shows change in mortality rate. A value over 1 (dashed line) means future fire-PM2.5 mortality rate may increase. (a) Global change. (b)–(f) Change by countries grouped by 2016 GDP per capita. The vertical line associated with each point represents the uncertainty derived from the two GCMs used (GFDL-ESM2M and HadGEM2-ES).
Download figure:
Standard image High-resolution image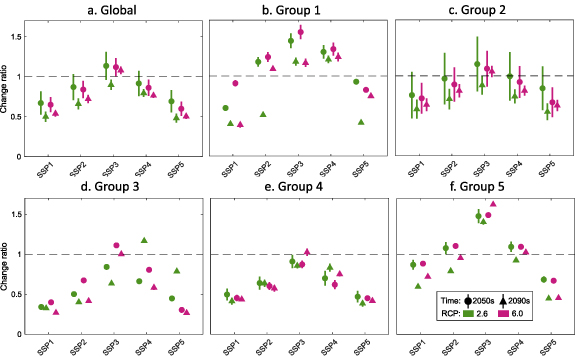
4. Discussion
4.1. Impact of climate change on fire-PM2.5 mortality
Comparing the results under two RCPs revealed the difference between limiting global mean temperature increase to 2 °C and allowing it to rise by 3 °C–4 °C. The projected future global fire-PM2.5 mortality rates between the two RCPs were not significantly different (mean values: 1.32, 1.33; p= 0.93), indicating that even if we successfully mitigate greenhouse gas emissions and achieve the 1.5 °C–2 °C temperature limit goal, the impact of fires on global health may not be significantly reduced. This result is consistent with our previous study, where we assessed the individual impact of meteorological factors on fire emissions and found no differences between RCP2.6 and RCP6.0 (Park et al 2023).
In the 2090s, however, RCP6.0 produces higher global mortality rate compared to RCP2.6 within the context of SSP3 (figure 4). The mortality rate is increased particularly in North America, Europe, and Australia (figure 3(c)), which in turn caused a notable increase of mortality rate in the countries in group 5 (figure 3(d)). Outside of group 5, China and Equatorial Asia also showed an increased mortality rate. RCP6.0 is characterized by warmer, drier conditions in many fire-sensitive areas compared to RCP2.6, which creates more flammable fuel conditions and increases extreme wildfire (Abram et al 2021, Gaboriau et al 2022).
Our results showed that, under climate change, increase in fire emissions became a prominent factor to increased mortalities, especially when the climate change combined with anthropogenic factors (e.g. land use transition). Fire emissions increased in the Arctic-boreal zone, the Amazon, Africa, and Equatorial Asia under RCP6.0 compared to RCP2.6 (appendix E). Many of these regions are expected to experience decreases in relative humidity, and the Amazon and Asian regions are expected to have increased biomass. Africa is expected to undergo increased land transitioning to cropland or pasture, which would potentially lead to more fire occurrences under RCP6.0.
Among the two GCMs that we used, GFDL-ESM2M generally resulted in a higher mortality rate than HadGEM2-ES, even though HadGEM2-ES projects higher air temperature increases in many areas. The gap between the two GCMs was particularly large in the group 2 countries (e.g. Indonesia) (figures 5(c) and (e)). This is because GFDL-ESM2M predicted less long-term precipitation leading to more peat fires in Equatorial Asia (appendix E).
Altogether, these results suggest that regions experiencing prolonged periods of precipitation deficiency or increased aridity due to climate change may have higher fire emissions. Therefore, countries in such areas should consider developing climate change adaptation measures to address the projected impact of fires on health.
4.2. Impact of socioeconomic changes on fire-PM2.5 mortality
The global fire-PM2.5 mortality rate varied depending on the SSP used. SSP3 produced the highest mortality, whereas SSP1 and 5 produced the lowest. The main reason for the lowest mortality under SSP1 and 5 was decreased in future baseline mortality rate compared with the other SSPs. Population aging is the leading future air quality health risk (Tang et al 2022). The SSP1 and SSP5 scenarios in particular assume a longer life expectancy and marked increase of the elderly population (Samir and Lutz 2017). However, at the same time, they have the lowest increase of baseline global mortality (Sellers 2020) (appendix F).
In contrast, SSP3 represents a future with large challenges to climate change adaptation and mitigation and difficulties in improving health services, resulting in the highest baseline mortality rate among the SSPs. This scenario resulted in the highest fire-PM2.5 mortality in many countries.
Socioeconomic factors also influence changes in fire activities in the future depending on the SSP used. A previous study on future global burned area indicated that rapid population growth coupled with slow urbanization (SSP3) may lead to an increase in burned areas; however, other scenarios may lead to decreases in burned area from population increases, highlighting the importance of fire suppression (Wu et al 2021). In addition, increased GDP per capita is another critical factor in reducing future fire activity; GDP increases under sustainable development (SSP1) lead to a greater reduction in fire emissions than under SSP3, highlighting the importance of investments for fire and land management (Park et al 2021).
4.3. Limitations
The present study has several limitations. The first is that global fire emissions modeled by different processes and under different assumptions can produce various historical fire emissions trends (Li et al 2019). In the present study, we did not use ensemble fire models so that we could reduce the computations needed to simulate air quality from the model emissions datasets and also limit the uncertainties associated with the different models’ assumptions. We used the Li-Park fire model because it fully captures meteorological, land-use transition, and socioeconomic drivers, all of which are good for identifying the impact of future scenarios on fire. However, a future ensemble-based study is needed, as utilizing models with divergent mechanisms can further reveal uncertainties.
The second limitation is that we simulated PM2.5 concentration at 4° ×ばつ 5° resolution and then downscaled to 0.5° ×ばつ 0.5° to reduce the computation time; then, the impact of fire-specific PM2.5 was calculated based on the difference between with and without fire emissions in GEOS-Chem (equation (1)). This approach may have oversimplified the contributions and toxicities of non-linear chemical reactions in aerosols from other sources.
Finally, health impact analyses inherently include much uncertainty due to variations of risk curves, types of diseases, and other assumptions such as TMREL. Here, we followed the methods used in the most recent GBD study (Murray et al 2020). When we compared our estimated global fire-PM2.5 mortality for the 2010s with previous study results, our estimation was smaller. We attribute this difference to differences not only in fire emissions values, but also differences in risk functions. Using a linear risk function, absolute fire-PM2.5 mortality during 2016–2019 has been estimated as 677 745 deaths, which was 8%–21% of the overall mortality associated to ambient air pollution (Roberts and Wooster 2021). However, when the sectoral contribution to PM2.5 mortality was estimated using the GBD 2019 method, it was reported that the fire sector (agricultural waste burning and open fire) contributed 4.1% (157 139 deaths) to the overall mortality associated to ambient air pollution (McDuffie et al 2021), which is more consistent with our present estimation (3.3%; 135 180 deaths).
5. Conclusions
Here, we found that mortality associated with global fire-PM2.5 in the 2050s and 2090s will depend on future climate change and socioeconomic scenarios. In the 2090s, global fire-PM2.5 mortality is likely to decrease under any scenario except for under SSP3–6.0, mainly due to large reductions of baseline mortality and fire emissions. However, fire may increase PM2.5-related mortality in the highest-income countries under SSP3–6.0. Thus, these countries should consider implementing health-related adaptation policies geared toward mitigating future fire-related health risk.
Data availability statement
All data that support the findings of this study are included within the article (and any supplementary files).
Funding
This research was supported by the Environment Research and Technology Development Fund (JPMEERF23S21120) of the Environmental Restoration and Conservation Agency of Japan.