In our last post, we put our AI data analyst, Spotter, to the test by predicting which teams would navigate the group stage and claim a spot in the historic, expanded Round of 32. Spotter successfully predicted 29 of the 32 teams that punched their ticket to the knockout rounds!
While most of the heavy hitters advanced as expected, soccer is defined by its chaos, and the data models caught a fascinating outlier.
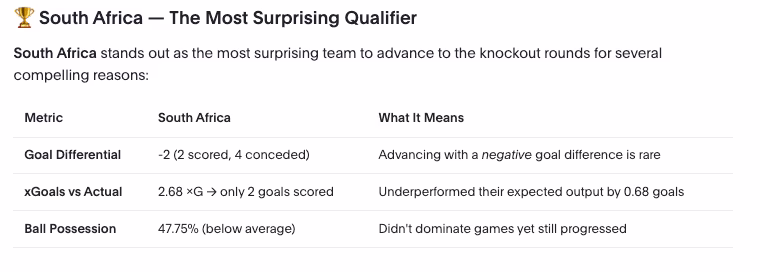
According to Spotter's post-group-stage analysis, South Africa stood out as the ultimate statistical anomaly. They defied the odds to advance out of Group A, but a deep dive into the data reveals just how heavily they skewed the metrics:
[画像:Spotter's post-group-stage analysis, South Africa]South Africa's survival was a masterclass in defensive resilience. Statistically, teams require a positive goal differential to progress, yet Bafana Bafana advanced while allowing 1.33 goals per game and converting a mere 0.66. They consistently underperformed their 2.68 xG, proving they weren’t even maximizing the few premium chances they generated.
Unfortunately for neutrals, this underdog story was short-lived; they were promptly ousted 1-0 by a clinical Canadian side in the very first match of the Round of 32.
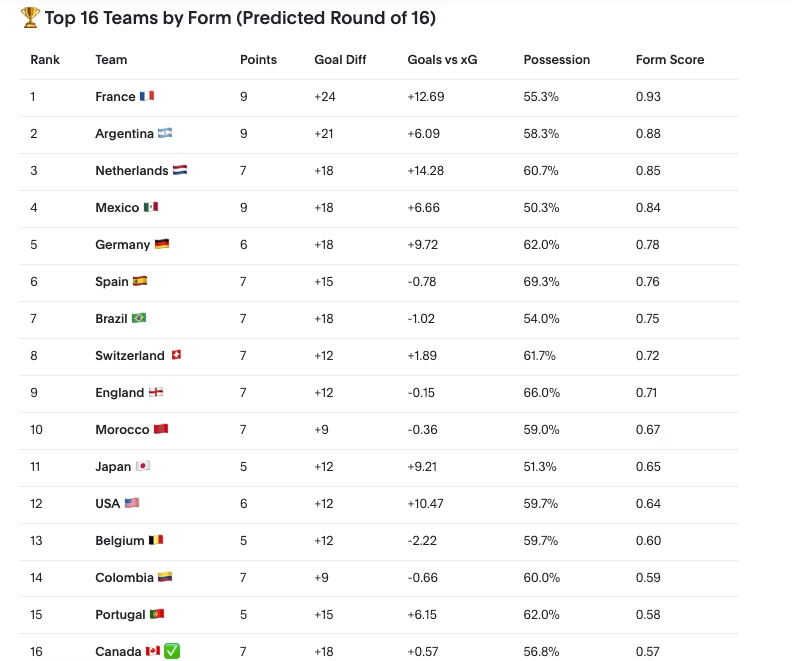
With the tournament narrowing down, Spotter has already crunched the numbers for the Round of 16. To identify the elite field, we utilize a Composite Form Score Methodology that weights underlying performance far more heavily than simple luck.
📊 Composite Form Score Blueprint:
Points per game (40%) - Core win/draw/loss record
Goal differential per game (25%) - Balance between offensive flair and defensive structure
Goals vs. xGoals (20%) - Evaluating finishing efficiency versus expected output
Possession (15%) - In-game dominance and tactical control
With Canada already locked in after their Sunday victory, Spotter’s model predicts that the remaining 15 slots will be claimed by the tournament's most statistically dominant sides.
[画像:Spotter’s Round of 16 Bracket]As the remaining Round of 32 fixtures play out over the coming days, we will see if the favorites hold true to Spotter's metrics or if another underdog is waiting to rip up the script. Stay tuned for our next data drop!
The group stage is heating up, and the picture of who will advance to the knockout rounds is becoming clearer by the day.
With two group stage matches completed, six teams have already punched their tickets to the Round of 32, while others are battling for the remaining spots. Here's everything you need to know about the qualification picture, with a little help from Spotter.
Six powerhouse nations have secured their places in the Round of 32 with perfect records: two wins from two matches. Leading the pack is Germany, who have been utterly dominant with 9 goals scored, and just 2 conceded, giving them a tournament-best +7 goal difference. Their attacking prowess has been nothing short of spectacular.
Close behind are Argentina, the defending champions, who boast the only perfect defensive record in the tournament—zero goals conceded. With Lionel Messi in scintillating form (5 goals, 9.65 average player rating), they look every bit the champions they are.
France and the USA share identical records with 6 goals scored and just 1 conceded each. The Americans are riding high on home advantage, controlling matches with an impressive 63.5% average possession - the highest among the qualified teams.
Rounding out the confirmed qualifiers are Norway, powered by Erling Haaland's 4 goals, and Mexico, who have been defensively resolute with zero goals conceded.
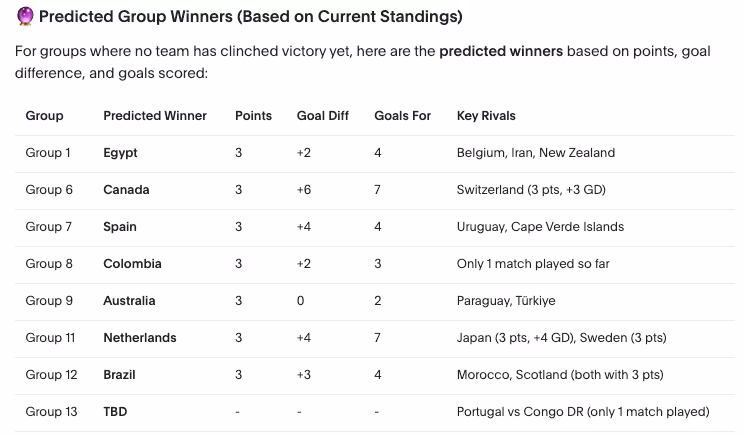
Beyond the confirmed six, Spotter projects 26 additional teams to reach the Round of 32 based on current standings and statistical trends.
Strong contenders for group runner-up spots include Brazil, England, Spain, the Netherlands, and Canada. The Canadians have been particularly impressive, boasting a +6 goal difference and a remarkable 70% possession rate. Jonathan David has netted 3 goals to lead their charge.
The battle for best third-place finishes is where things get intriguing. Teams like Sweden, Morocco, South Korea, and Belgium are fighting for the coveted spots allocated to the top third-place finishers. Belgium, in particular, presents an interesting case — they've generated 3.14 expected goals but converted just once, suggesting their fortunes could turn dramatically.
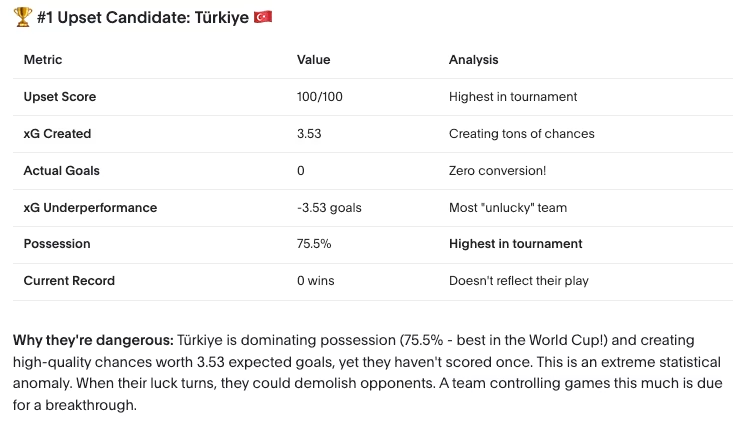
[画像:Predicted group winners]Perhaps the most fascinating statistical story belongs to Türkiye. Despite zero wins, they lead the tournament in possession (75.5%) and have generated 3.53 expected goals—yet haven't scored. Check out this detail uncovered by Spotter:
[画像:Spotter showing Türkiye rankings]With one group match remaining for most teams, the margins are razor-thin. The difference between glory and heartbreak could come down to goal difference, head-to-head records, or even fair play points.
One thing is certain: this tournament has already delivered drama, spectacular goals, and unforgettable moments. With Messi scoring every 35 minutes and 20 goals coming in the final five minutes of matches, the knockout rounds promise to be even more thrilling.
We will be back with another prediction round from Spotter, showing us who will move on to the final 16!
The group stage is live, and Team USA's home opener gives you a clean test for how agentic analytics holds up under tournament pressure. The final score shows one thing, but what does the data suggest?
We asked Spotter to give us a data-driven read on the USA vs Paraguay game, score the performance, and surface the standout players. We even asked it to predict what will happen against Australia on June 19.
The two short clips below show the workflow end-to-end: a post-match read on Paraguay, followed by a predictive look at Australia. Both come from the same Liveboard created with SpotterViz, so you can follow the question, the KPIs, and the call without leaving the product.
Let's see what Spotter has to say.
Team USA opened its World Cup bid with a 4-1 win over Paraguay at SoFi Stadium, and the underlying numbers back up the scoreline. Spotter pulled three data signals to the front, illustrating a dominant performance from the Stars and Stripes.
65% possession, with the midfield setting the tempo for long stretches
66.7% goal conversion rate, the best mark among the top sides in the group stage so far
Folarin Balogun's brace, which earns him a 9.0 rating (5th in the tournament) and puts him level with the joint-top scorers
Australia arrived at their fixture in a very different way. They beat Türkiye 2-0 with just 28% possession, a clean sheet, and a 9.2 rating for goalkeeper Patrick Beach, the third highest in the tournament. So the question remains, who will come away with the points?
The tactical question for June 19 is whether a possession-heavy US side can break down a stellar goalkeeper and a defense that withstood another possession-heavy opponent.
So we asked Spotter. Based on both teams' previous games, what is the most likely outcome of the USA vs Australia?
Spotters calls a USA victory, 2-1, with a 55%-60% win probability for the hosts. The Aussie’s goalkeeper, Patrick Beach, is the variable that could pull the margin tighter, something that could sway the result.
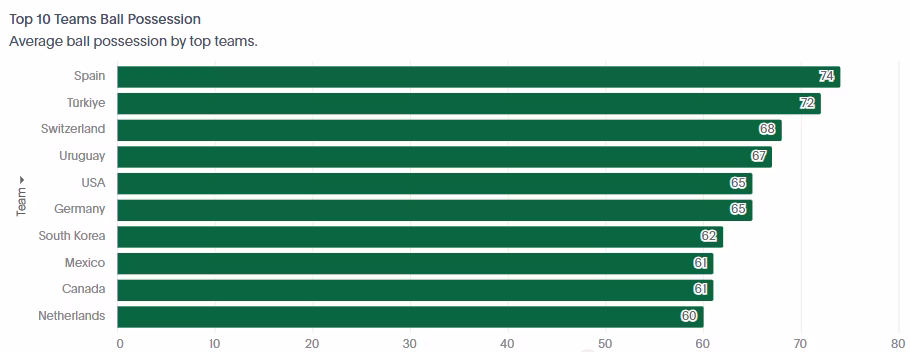
Did you know that the four highest-possession teams of the tournament so far have not won their match? Possession alone does not move the scoreboard; what makes the USA opener stand out is the clinical conversion rate behind it.
[画像:Average ball possession by top teams]As of EOD June 15th 2026
Check in next week as we predict the Group Stage winners and set the stage for the Round of 32!
Soccer is a game of stories, but the most fascinating stories are often buried deep inside the numbers. And this year on the world's biggest stage, the tournament has expanded by nearly 60% – traditional scouting reports and pundit hot-takes simply can't keep up with the sheer volume of new data. That’s why we’re looking at the tournament through a much wider lens.
By connecting Spotter, our agentic analyst, directly to a massive dataset spanning 150 years of international football, we can creatively interrogate history in plain English. Instead of just tracking standard box scores, we are mapping multi-decade team rivalries, uncovering unexpected geographic scoring advantages, and finding the hidden math that defines real tournament underdogs.
As the tournament progresses and more data is available, this will be reflected in our data set to provide more opportunities to explore, drill, and uncover insights that tell a new story - all with the power of ThoughtSpot & Spotter.
If you want to pick a winner, build a fantasy bracket, or just hold your own in the group chat, Spotter has you covered. The real challenge is whether you can ask the right question fast enough to find an edge. That is exactly why we put our analytics platform to the test.
With a century and a half of international match results into a single, centralized ThoughtSpot Liveboard, the beautiful game can now be visualized with beautiful data. Instead of forcing you to scroll through static, pre-canned dashboards, we pointed Spotter—our natural language analyst—directly at the entire dataset.
How does this change your analysis? You can type questions in plain English just like you would in a search engine. Spotter instantly translates your words into data queries, calculates the metrics behind the scenes, and builds interactive visualizations from scratch.
If you want to dig deeper into a specific spike or anomaly, you simply click to drill down into the granular details.
Here are some of our favorite questions that led to astounding answers with Spotter:
Predict the winner of each group stage
How has the average score per game trended since 1900?
Which national teams have won the most competitive home matches across history?
Which tournaments have produced the heaviest match counts in the last 100 years?
We aren't stopping at historical data. Because sports analytics move as fast as the action on the pitch, we will update this blog post like a rolling news feed throughout the entire tournament.
As new match statistics flow into our Liveboard every single day, we will use ThoughtSpot to analyze the shifting trends, unexpected upsets, and standout player performances. You will see the exact plain-English question we asked Spotter, the instant answer it produced, and the live chart that came back.
Be sure to bookmark this page and check back regularly as the tournament progresses. Here is our data roadmap for the upcoming weeks:
June 10: Pre-game predictions on total goals and the highest-scoring group
June 18: A data-driven read on the USA's opening match
June 25: Group-stage wrap and the round-of-32 outlook
July 2: Round-of-16 analytical picks
July 9: Quarterfinal probabilities and penalty-shootout scenarios
July 16: Semifinal predictions and historical match-up math
July 16–19: Final poll, final prediction, and the post-game "What Spotter said" recap
The historical analysis runs on a 150+ year dataset of international match results, including dates, teams, scores, venues, and tournament context.
Yes. New analytical updates are added at each of the milestones listed above, with live match data flowing into the platform daily.