Are you looking to retrieve stock market data using Python? You're at the right place. In this article, you'll learn how to get stock market data using Python. You can further use the data to analyze, visualize, and get insights from it.
You'll be using the yfinance Python library to get the current and historical stock market price data from Yahoo Finance.
Installing Required Libraries
Yahoo Finance is one of the widely used platforms that provides stock market data. You can easily download the dataset from their website, but if you want to access it directly from a Python program, you can use the yfinance library. To install yfinance using pip, you need to run the following command at a command prompt:
pip install yfinanceThe yfinance Python library is free to use and it does not require an API key.
The code used in this project is available in a GitHub repository and is free for you to use under the MIT license.
Get Current Stock Price Data
You need to have the ticker of the stock for which you want to extract the data. In the following example, we'll be finding the market price and previous close price for GOOGL.
import yfinance as yf
ticker = yf.Ticker('GOOGL').info
market_price = ticker['regularMarketPrice']
previous_close_price = ticker['regularMarketPreviousClose']
print('Ticker: GOOGL')
print('Market Price:', market_price)
print('Previous Close Price:', previous_close_price)
This produces the following output:

This example uses the regularMarketPrice and regularMarketPreviousClose properties to get the required data. The yfinance library provides numerous other properties that you can explore. These include zip, sector, fullTimeEmployees, longBusinessSummary, city, phone, state, and country. You can get the complete list of the available properties using this code:
import yfinance as yf
ticker = yf.Ticker('GOOGL').info
print(ticker.keys())
Get Historical Stock Price Data
You can get all the historical price data by providing the start date, end date, and ticker.
# Importing the yfinance package
import yfinance as yf

# Set the start and end date
start_date = '2020年01月01日'
end_date = '2022年01月01日'

# Set the ticker
ticker = 'GOOGL'

# Get the data
data = yf.download(ticker, start_date, end_date)

# Print the last 5 rows
print(data.tail())
This produces the following output:
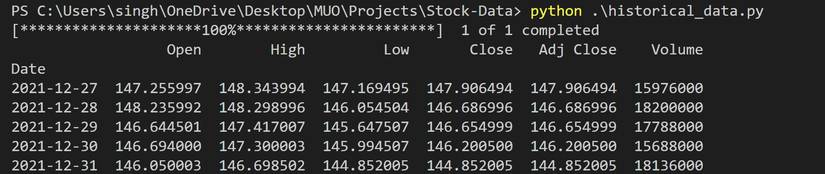
The above code will fetch the stock price data from 2020年01月01日 to 2022年01月01日.
If you want to pull data of multiple tickers at once, you can do so by providing the tickers in the form of a space-separated string.
import yfinance as yf
start_date = '2020年01月01日'
end_date = '2022年01月01日'

# Add multiple space separated tickers here
ticker = 'GOOGL MSFT TSLA'
data = yf.download(ticker, start_date, end_date)
print(data.tail())
Transforming Data for Analysis
In the above dataset, Date is the index of the dataset and not a column. To perform any data analysis on this data, you need to convert this index into a column. Below is how you can do that:
import yfinance as yf
start_date = '2020年01月01日'
end_date = '2022年01月01日'
ticker = 'GOOGL'
data = yf.download(ticker, start_date, end_date)
data["Date"] = data.index

data = data[["Date", "Open", "High",
 "Low", "Close", "Adj Close", "Volume"]]

data.reset_index(drop=True, inplace=True)
print(data.head())
This produces the following output:

This transformed data is the same as the data you would have downloaded from Yahoo Finance.
Storing the Received Data in a CSV File
You can export a DataFrame object to a CSV file using the to_csv() method. Since the above data is already in the form of a pandas DataFrame, you can export the data into a CSV file using the following code:
import yfinance as yf
start_date = '2020年01月01日'
end_date = '2022年01月01日'
ticker = 'GOOGL'
data = yf.download(ticker, start_date, end_date)
print(data.tail())
# Export data to a CSV file
data.to_csv("GOOGL.csv")
Pandas is the widely used data-analysis Python library. If you're not much comfortable with this library, you should get started with basic operations using Pandas.
Visualize the Data
The yfinance Python library is one of the most convenient libraries to set up, fetch data, and perform data analysis tasks with. You can use this data to visualize results and capture insights using libraries like Matplotlib, Seaborn, or Bokeh.
You can even display these visualizations directly on a webpage using PyScript.